| Param | Original file | Final file |
|---|---|---|
| Filename | modeM0/AS1A05_037T01_9000003144_21324cztM0_level2.evt | modeM0/AS1A05_037T01_9000003144_21324cztM0_level2_quad_clean.evt |
| Size (bytes) | 517,561,920 | 96,762,240 |
| Size | 493.6 MB | 92.3 MB |
| Events in quadrant A | 3,405,757 | 624,574 |
| Events in quadrant B | 3,538,662 | 634,280 |
| Events in quadrant C | 3,327,542 | 610,990 |
| Events in quadrant D | 4,933,917 | 579,561 |
| Mode M0 | |||
|---|---|---|---|
| Quadrant | BADHDUFLAG | Total packets | Discarded packets |
| A | 0 | 14589 | 2 |
| B | 0 | 14939 | 2 |
| C | 0 | 14375 | 2 |
| D | 0 | 19255 | 2 |
| Mode SS | |||
|---|---|---|---|
| Quadrant | BADHDUFLAG | Total packets | Discarded packets |
| A | 0 | 138 | 0 |
| B | 0 | 138 | 0 |
| C | 0 | 138 | 0 |
| D | 0 | 138 | 0 |
| Mode M9 | |||
|---|---|---|---|
| Quadrant | BADHDUFLAG | Total packets | Discarded packets |
| A | 0 | 14 | 0 |
| B | 0 | 15 | 0 |
| C | 0 | 15 | 0 |
| D | 0 | 15 | 0 |
| Quadrant | Total seconds | Saturated seconds | Saturation percentage |
|---|---|---|---|
| A | 6911 | 30 | 0.434091% |
| B | 6911 | 56 | 0.810302% |
| C | 6911 | 73 | 1.056287% |
| D | 6911 | 315 | 4.557951% |
Noise dominated data is calculated using 1-second bins in cleaned event files. If a bin has >2000 counts, and if more than 50% of those come from <1% of pixels, then it is considered to be noise-dominated and hence unusable.
| Quadrant | # 1 sec bins | Bins with >0 counts | Bins with >2000 counts | High rate bins dominated by noise | Noise dominated (total time) | Noise dominated (detector-on time) | Marked lightcurve |
|---|---|---|---|---|---|---|---|
| A | 7671 | 6912 | 4 | 4 | 0.05% | 0.06% | 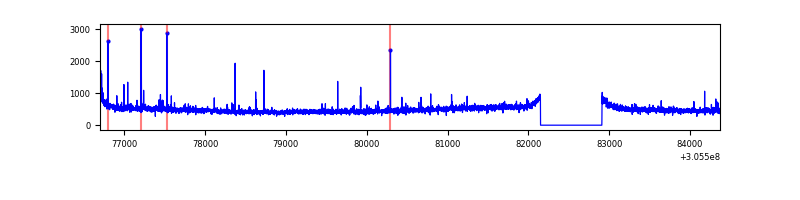 |
| B | 7671 | 6912 | 4 | 4 | 0.05% | 0.06% | 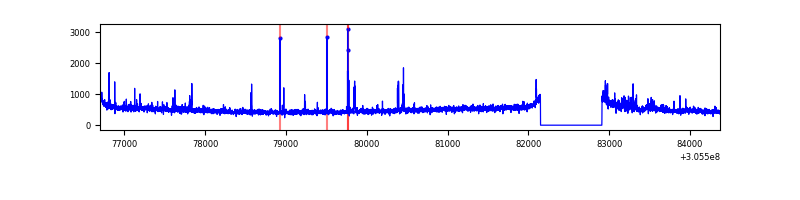 |
| C | 7671 | 6912 | 0 | 0 | 0.00% | 0.00% | 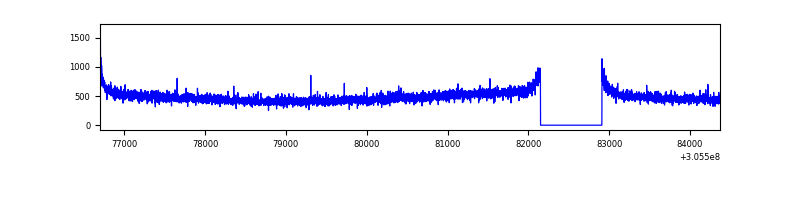 |
| D | 7671 | 6912 | 252 | 252 | 3.29% | 3.65% | 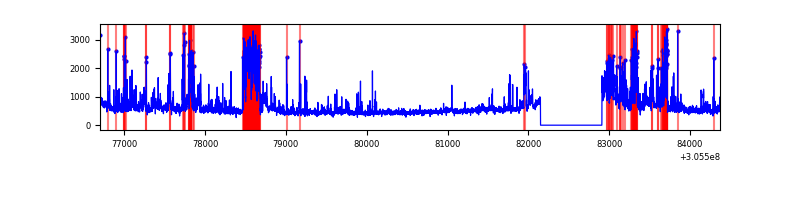 |
Top three noisy pixels from each quadrant. If the there are fewer than three noisy pixels in the level2.evt file, extra rows are filled as -1
| Pixel properties | Quadrant properties | ||||||
|---|---|---|---|---|---|---|---|
| Quadrant | DetID | PixID | Counts | Sigma | Mean | Median | Sigma |
| A | 11 | 47 | 27038 | 150.28 | 858 | 841 | 174.3 |
| A | 9 | 143 | 21371 | 117.77 | 858 | 841 | 174.3 |
| A | 4 | 2 | 12388 | 66.24 | 858 | 841 | 174.3 |
| B | 3 | 64 | 58884 | 355.09 | 855 | 836 | 163.5 |
| B | 0 | 189 | 53481 | 322.04 | 855 | 836 | 163.5 |
| B | 0 | 190 | 42475 | 254.71 | 855 | 836 | 163.5 |
| C | 14 | 238 | 129501 | 672.96 | 816 | 825 | 191.2 |
| C | 0 | 10 | 9501 | 45.37 | 816 | 825 | 191.2 |
| C | 13 | 61 | 5848 | 26.27 | 816 | 825 | 191.2 |
| D | 7 | 38 | 483292 | 2423.98 | 818 | 794 | 199.1 |
| D | 12 | 233 | 408464 | 2048.06 | 818 | 794 | 199.1 |
| D | 1 | 52 | 327448 | 1641.05 | 818 | 794 | 199.1 |
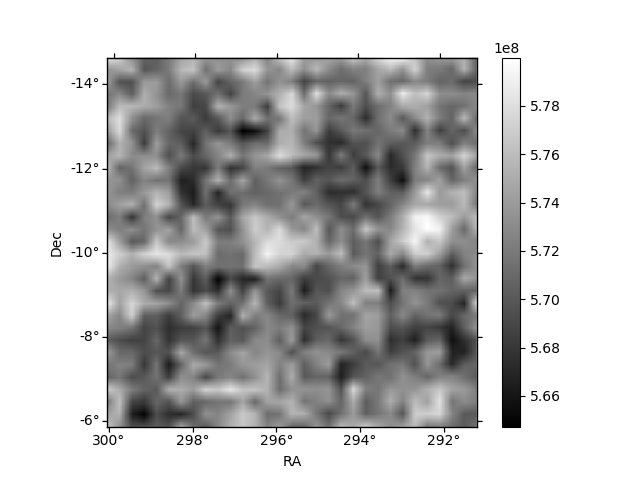
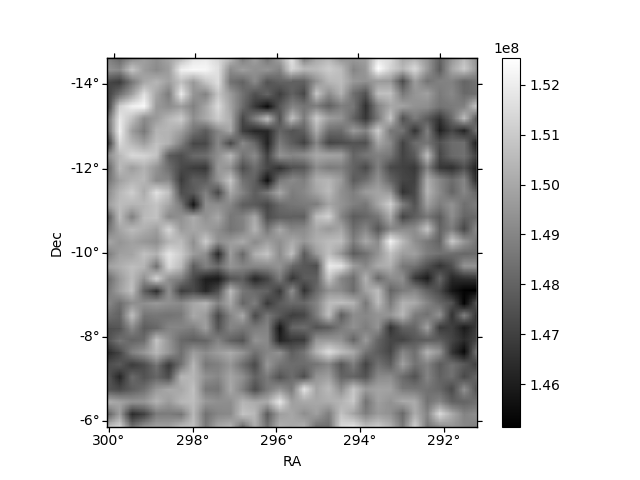
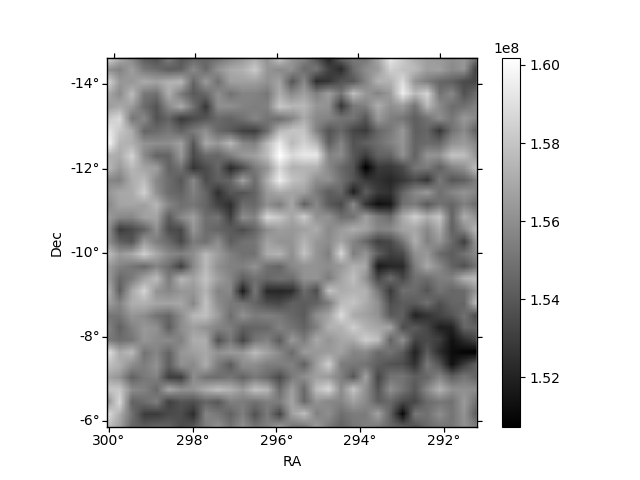
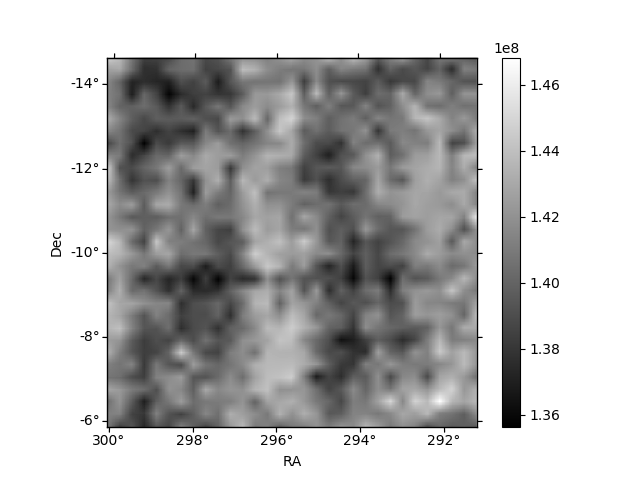
Histogram calculated using DETX and DETY for each event in the final _common_clean file
| Quadrant A | 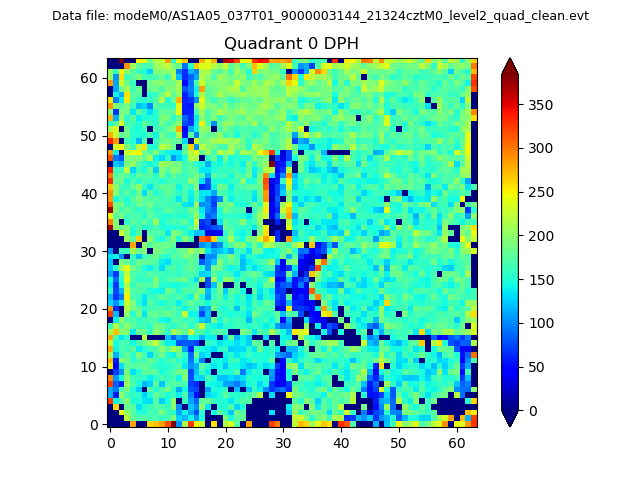 |
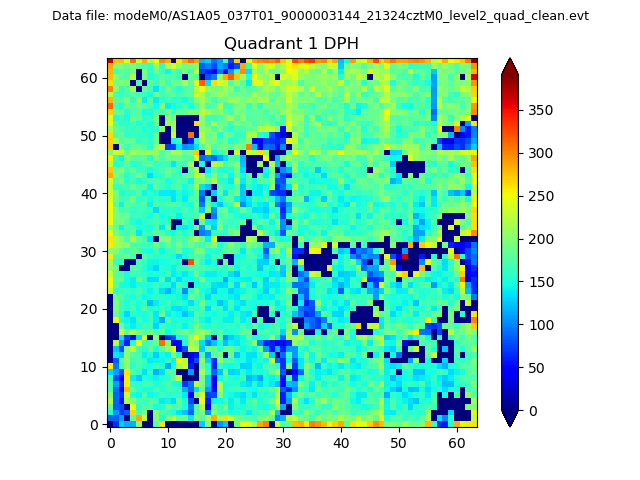 |
Quadrant B |
|---|---|---|---|
| Quadrant D | 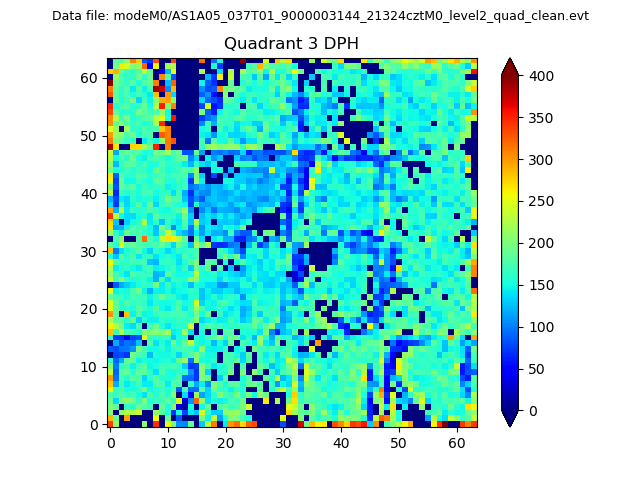 |
 |
Quadrant C |
| Plot type | Count rate plots | Images |
|---|---|---|
| Comparison with Poisson distribution Blue bars denote a histogram of data divided into 1 sec bins. Red curve is a Poisson curve with rate = median count rate of data. |
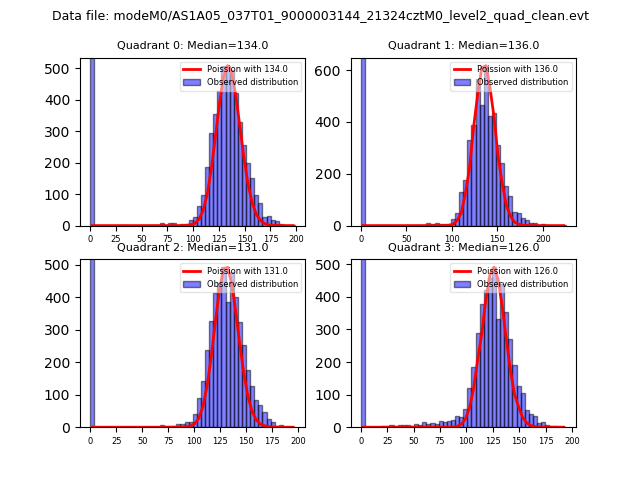 |
 |
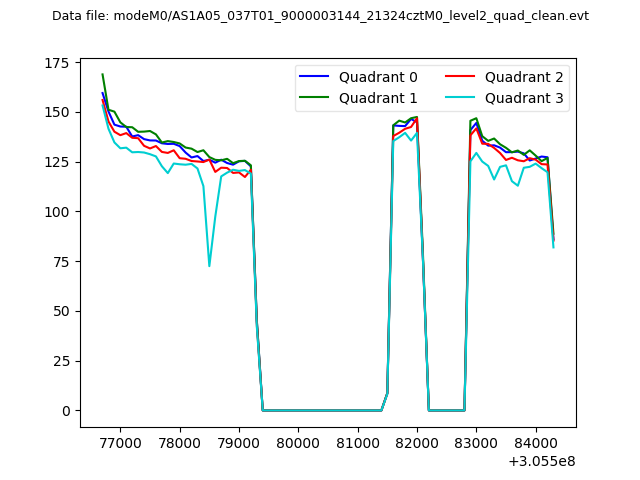
| Quadrant-wise count rates Data is divided into 100 sec bins |
 |
|
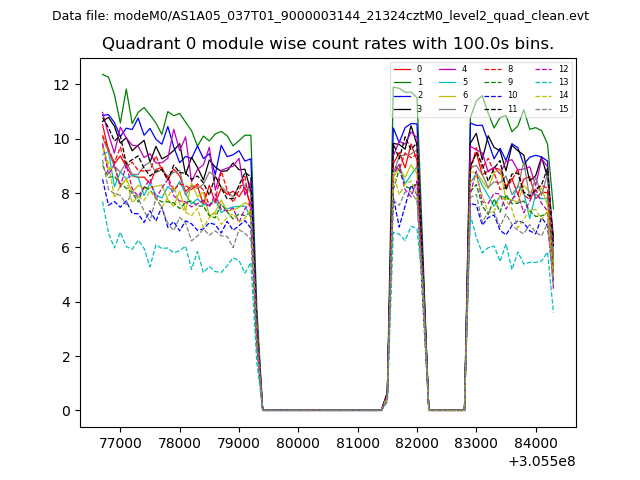
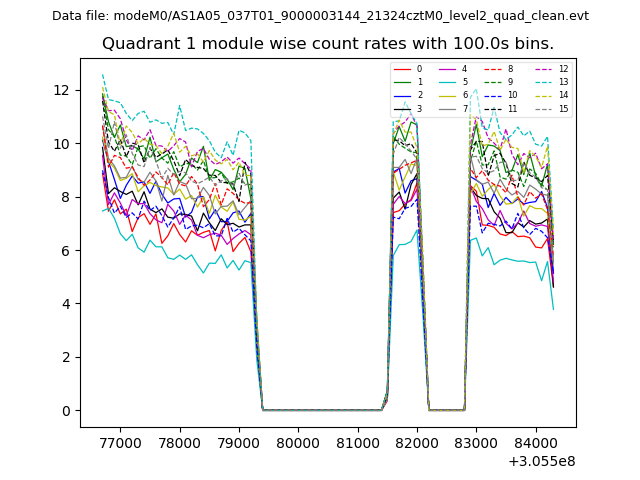
| Module-wise count rates for Quadrant A Data is divided into 100 sec bins |
 |
 |
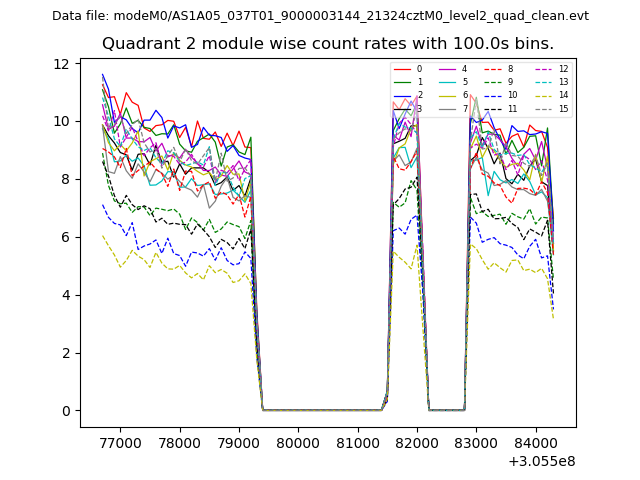
| Module-wise count rates for Quadrant B Data is divided into 100 sec bins |
 |
 |
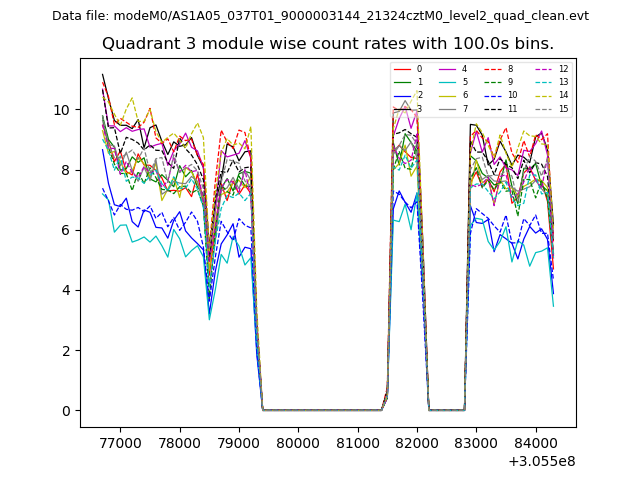
| Module-wise count rates for Quadrant C Data is divided into 100 sec bins |
 |
 |
| Module-wise count rates for Quadrant D Data is divided into 100 sec bins |
 |
 |
| Parameter | Plot |
|---|---|
| CZT HV Monitor | 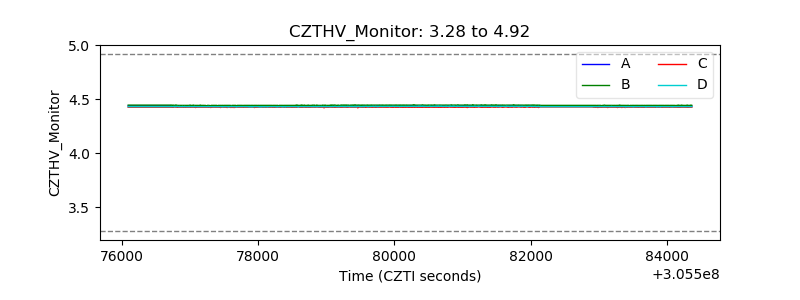 |
| D_VDD | 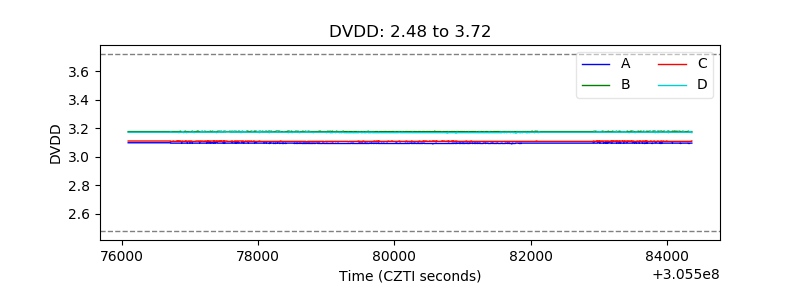 |
| Temperature 1 | 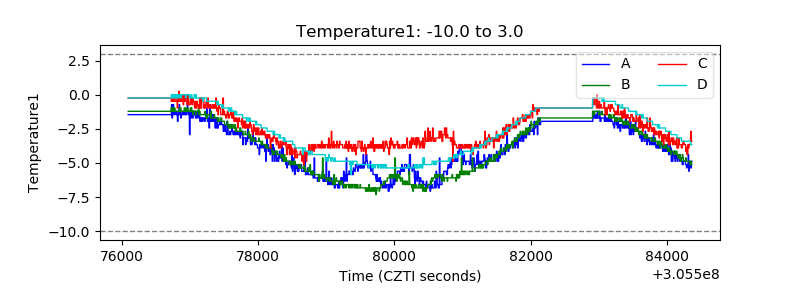 |
| Veto HV Monitor | 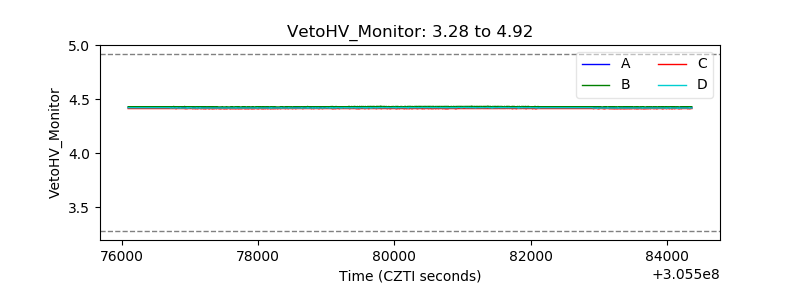 |
| Veto LLD | 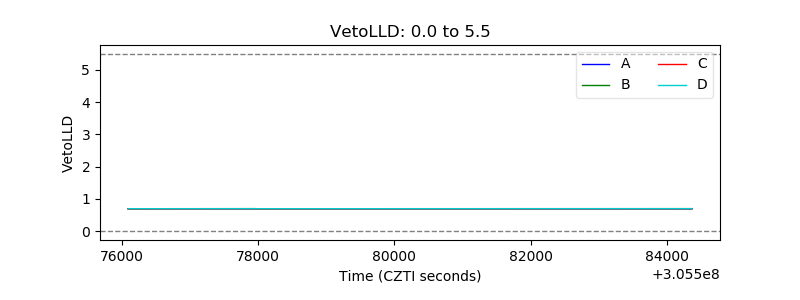 |
| Alpha Counter | 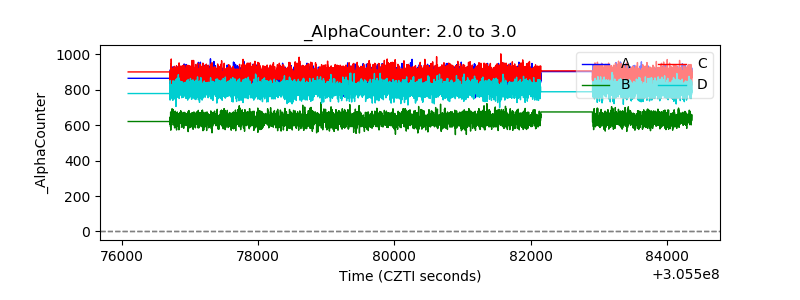 |
| _CPM_Rate | 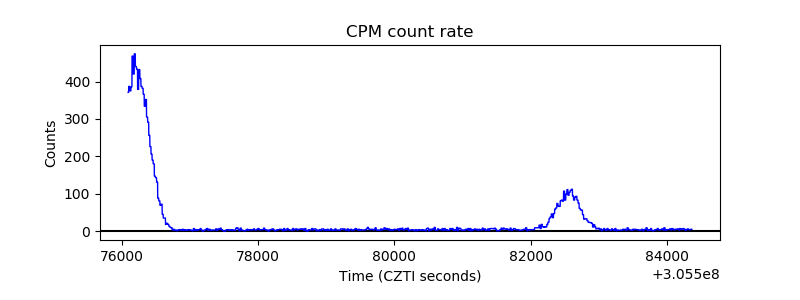 |
| CZT Counter |  |
| +2.5 Volts monitor |  |
| +5 Volts monitor |  |
| _ROLL_ROT | 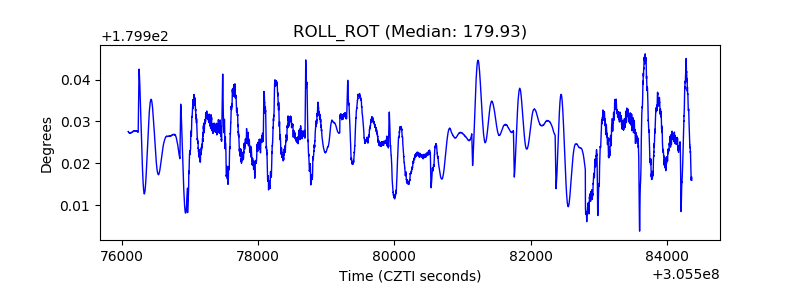 |
| _Roll_DEC | 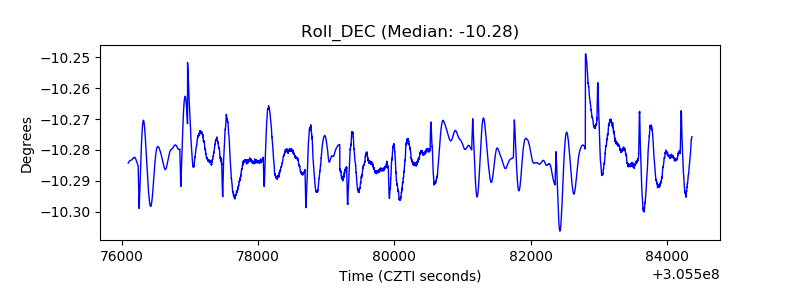 |
| _Roll_RA | 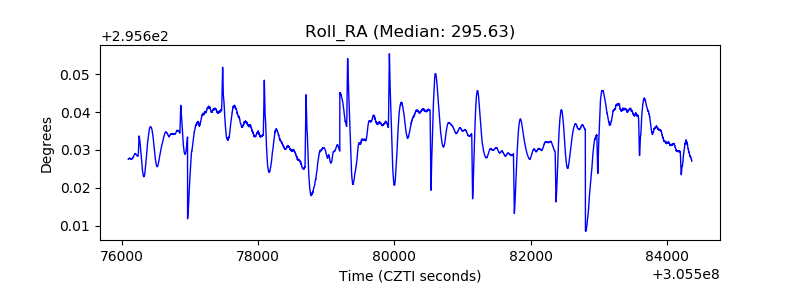 |
| Veto Counter | 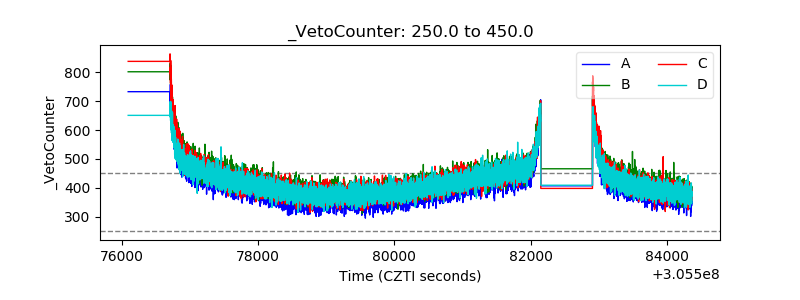 |