| Param | Original file | Final file |
|---|---|---|
| Filename | modeM0/AS1A05_037T01_9000003144_21326cztM0_level2.evt | modeM0/AS1A05_037T01_9000003144_21326cztM0_level2_quad_clean.evt |
| Size (bytes) | 637,692,480 | 118,025,280 |
| Size | 608.2 MB | 112.6 MB |
| Events in quadrant A | 4,039,208 | 761,327 |
| Events in quadrant B | 4,360,287 | 774,950 |
| Events in quadrant C | 3,952,250 | 749,108 |
| Events in quadrant D | 6,401,052 | 714,729 |
| Mode M0 | |||
|---|---|---|---|
| Quadrant | BADHDUFLAG | Total packets | Discarded packets |
| A | 0 | 17391 | 2 |
| B | 0 | 18271 | 2 |
| C | 0 | 17087 | 2 |
| D | 0 | 24736 | 2 |
| Mode SS | |||
|---|---|---|---|
| Quadrant | BADHDUFLAG | Total packets | Discarded packets |
| A | 0 | 170 | 0 |
| B | 0 | 170 | 0 |
| C | 0 | 170 | 0 |
| D | 0 | 170 | 0 |
| Mode M9 | |||
|---|---|---|---|
| Quadrant | BADHDUFLAG | Total packets | Discarded packets |
| A | 0 | 7 | 0 |
| B | 0 | 7 | 0 |
| C | 0 | 7 | 0 |
| D | 0 | 7 | 0 |
| Quadrant | Total seconds | Saturated seconds | Saturation percentage |
|---|---|---|---|
| A | 8263 | 66 | 0.798741% |
| B | 8263 | 155 | 1.875832% |
| C | 8263 | 70 | 0.847150% |
| D | 8263 | 226 | 2.735084% |
Noise dominated data is calculated using 1-second bins in cleaned event files. If a bin has >2000 counts, and if more than 50% of those come from <1% of pixels, then it is considered to be noise-dominated and hence unusable.
| Quadrant | # 1 sec bins | Bins with >0 counts | Bins with >2000 counts | High rate bins dominated by noise | Noise dominated (total time) | Noise dominated (detector-on time) | Marked lightcurve |
|---|---|---|---|---|---|---|---|
| A | 8973 | 8265 | 16 | 16 | 0.18% | 0.19% | 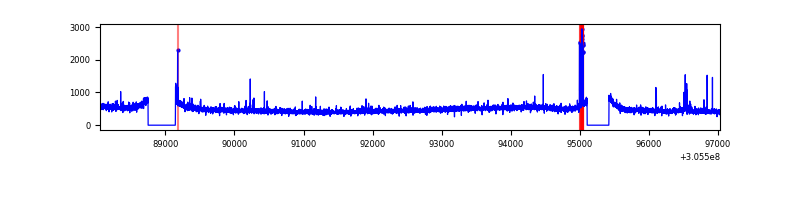 |
| B | 8973 | 8265 | 69 | 69 | 0.77% | 0.83% | 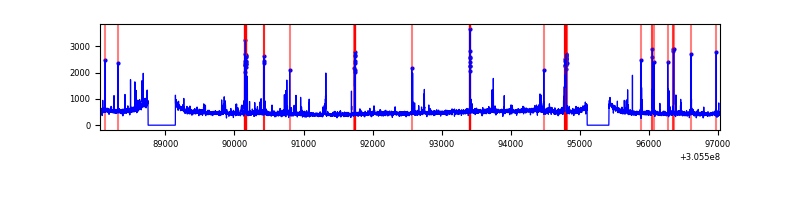 |
| C | 8973 | 8265 | 0 | 0 | 0.00% | 0.00% | 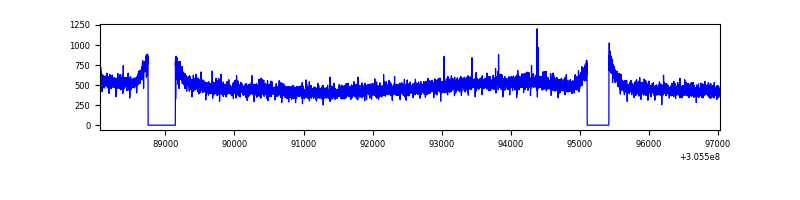 |
| D | 8973 | 8265 | 157 | 157 | 1.75% | 1.90% | 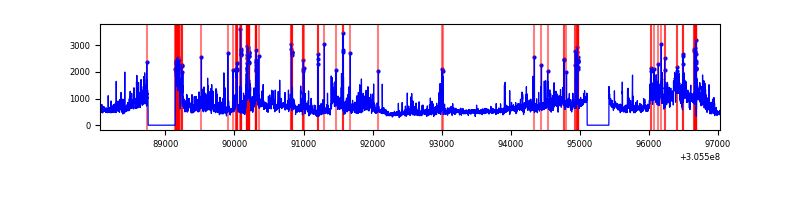 |
Top three noisy pixels from each quadrant. If the there are fewer than three noisy pixels in the level2.evt file, extra rows are filled as -1
| Pixel properties | Quadrant properties | ||||||
|---|---|---|---|---|---|---|---|
| Quadrant | DetID | PixID | Counts | Sigma | Mean | Median | Sigma |
| A | 15 | 174 | 56342 | 270.7 | 1012 | 989 | 204.5 |
| A | 4 | 2 | 26914 | 126.78 | 1012 | 989 | 204.5 |
| A | 12 | 96 | 23592 | 110.54 | 1012 | 989 | 204.5 |
| B | 3 | 64 | 251544 | 1289.79 | 1008 | 982 | 194.3 |
| B | 0 | 230 | 60552 | 306.64 | 1008 | 982 | 194.3 |
| B | 0 | 190 | 51487 | 259.98 | 1008 | 982 | 194.3 |
| C | 14 | 238 | 148627 | 653.22 | 969 | 978 | 226.0 |
| C | 8 | 128 | 12152 | 49.44 | 969 | 978 | 226.0 |
| C | 13 | 61 | 6891 | 26.16 | 969 | 978 | 226.0 |
| D | 13 | 174 | 988694 | 4208.62 | 971 | 945 | 234.7 |
| D | 1 | 20 | 533751 | 2270.19 | 971 | 945 | 234.7 |
| D | 12 | 235 | 433284 | 1842.12 | 971 | 945 | 234.7 |
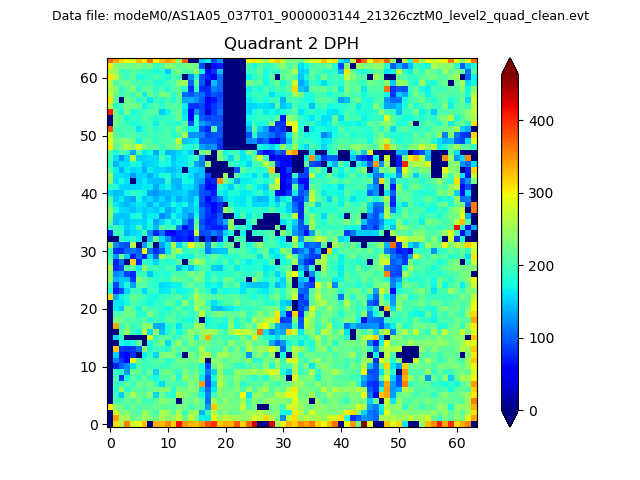
Histogram calculated using DETX and DETY for each event in the final _common_clean file
| Quadrant A | 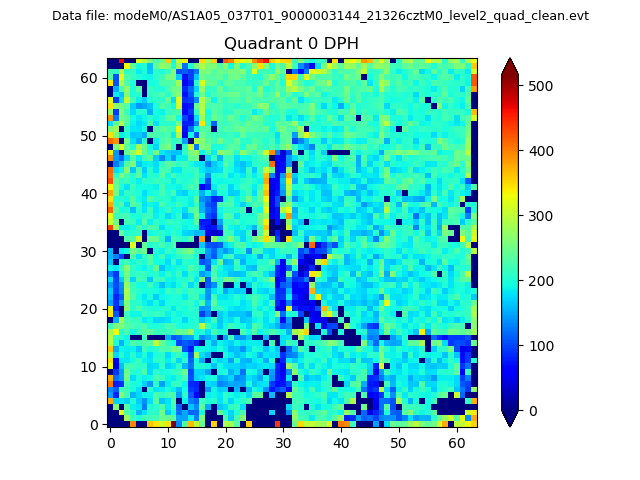 |
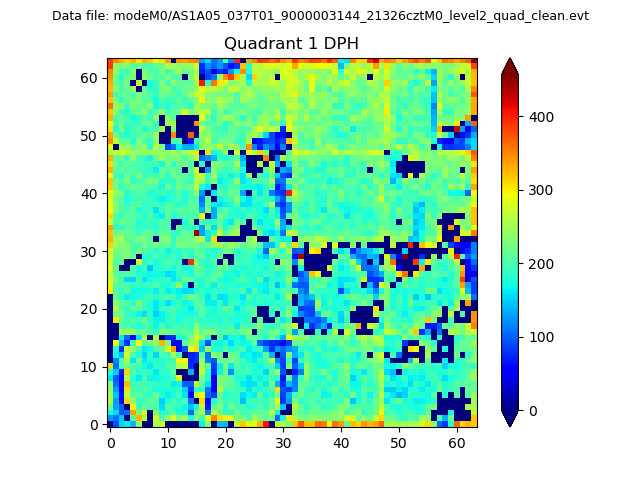 |
Quadrant B |
|---|---|---|---|
| Quadrant D | 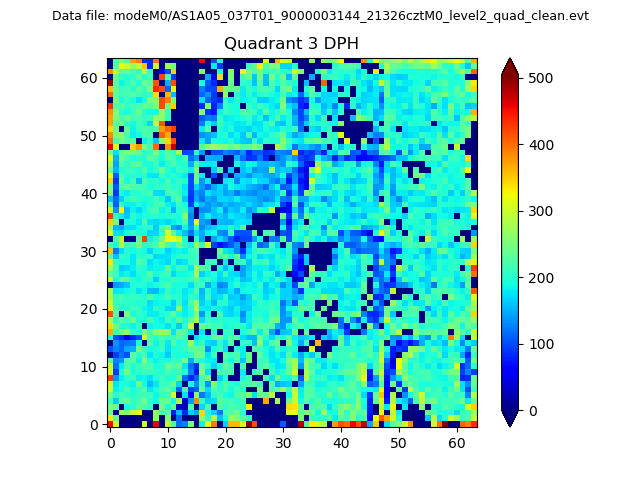 |
 |
Quadrant C |
| Plot type | Count rate plots | Images |
|---|---|---|
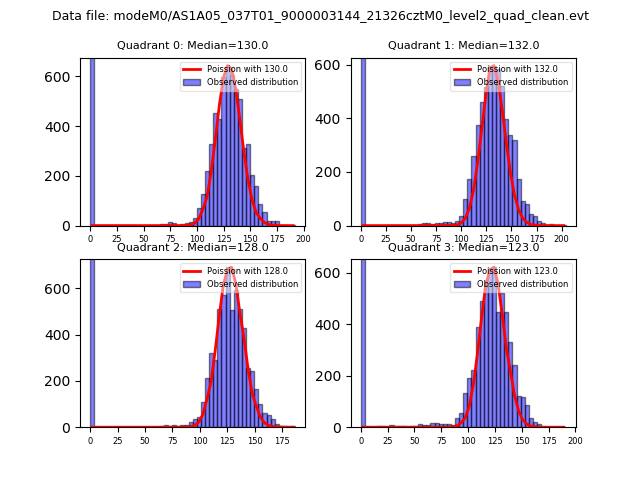
| Comparison with Poisson distribution Blue bars denote a histogram of data divided into 1 sec bins. Red curve is a Poisson curve with rate = median count rate of data. |
 |
 |
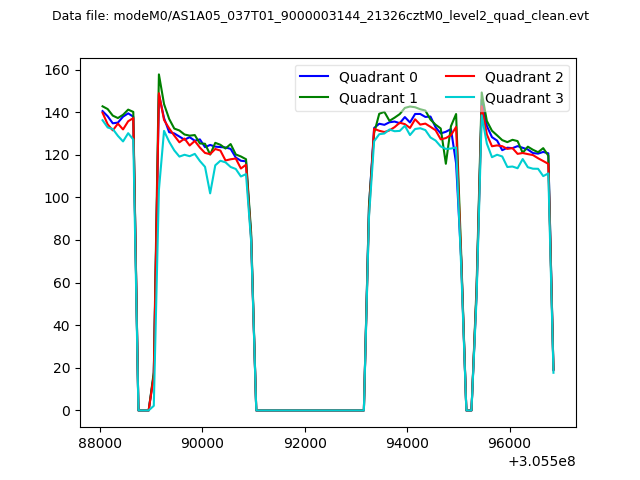
| Quadrant-wise count rates Data is divided into 100 sec bins |
 |
|
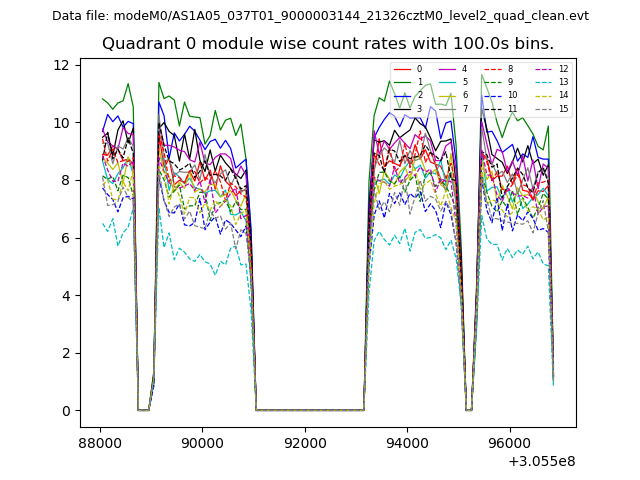
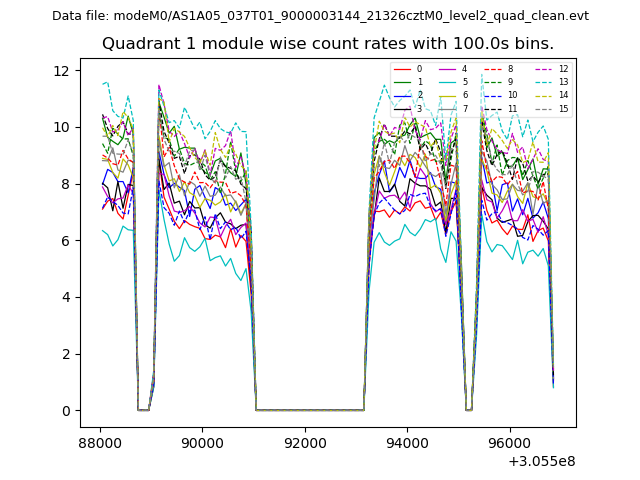
| Module-wise count rates for Quadrant A Data is divided into 100 sec bins |
 |
 |
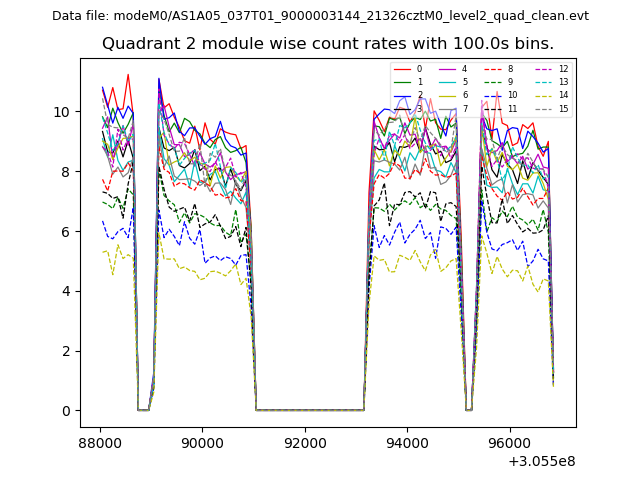
| Module-wise count rates for Quadrant B Data is divided into 100 sec bins |
 |
 |
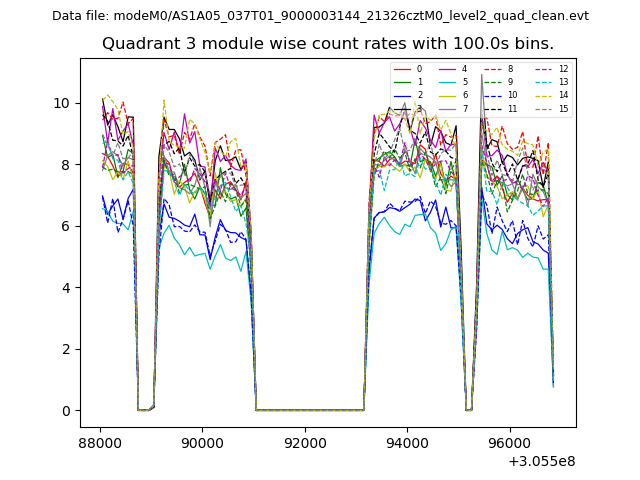
| Module-wise count rates for Quadrant C Data is divided into 100 sec bins |
 |
 |
| Module-wise count rates for Quadrant D Data is divided into 100 sec bins |
 |
 |
| Parameter | Plot |
|---|---|
| CZT HV Monitor | 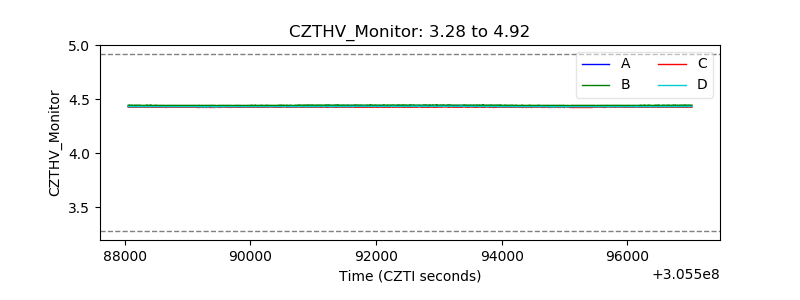 |
| D_VDD | 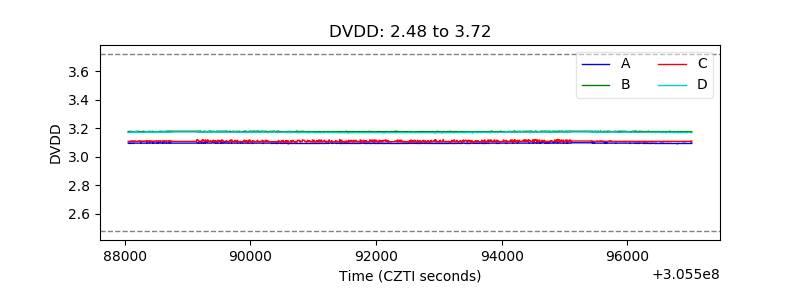 |
| Temperature 1 | 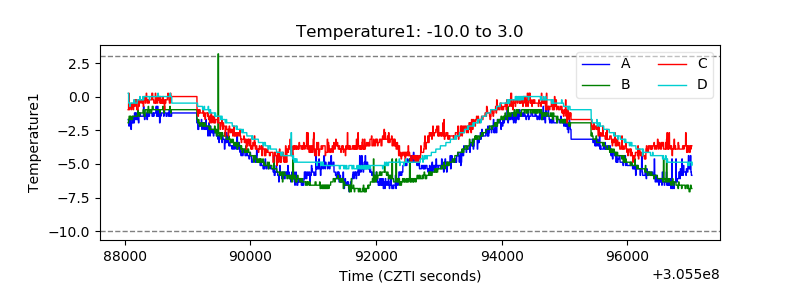 |
| Veto HV Monitor | 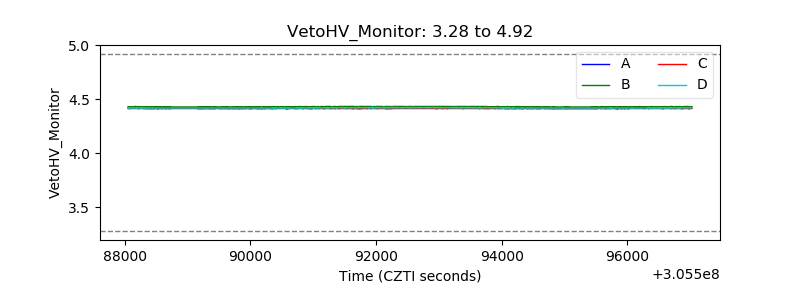 |
| Veto LLD | 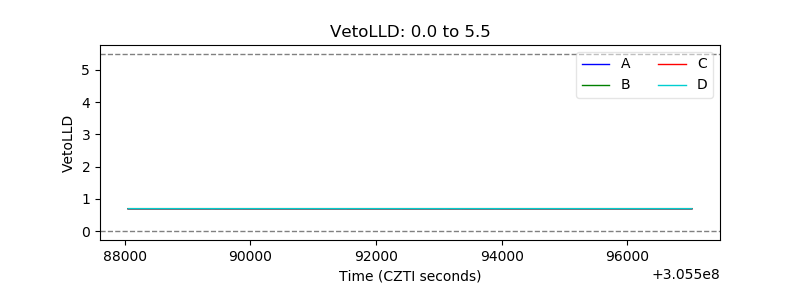 |
| Alpha Counter | 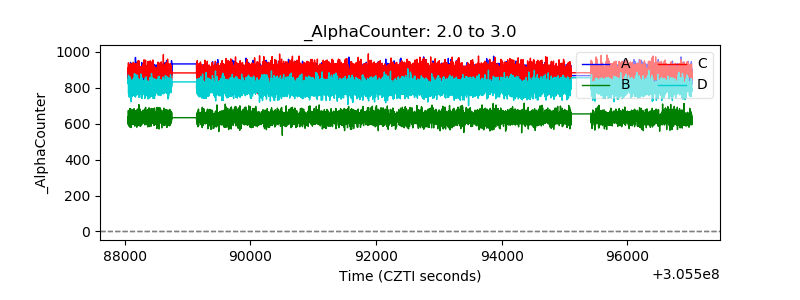 |
| _CPM_Rate | 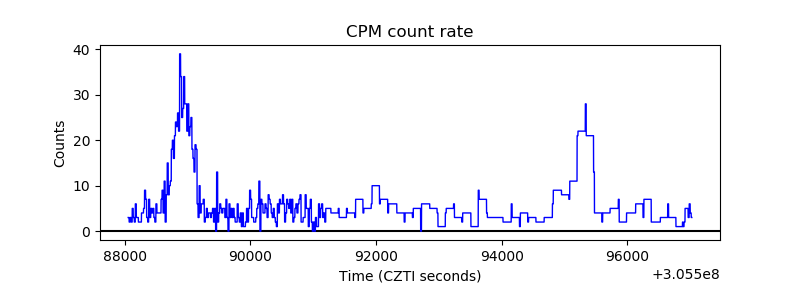 |
| CZT Counter | 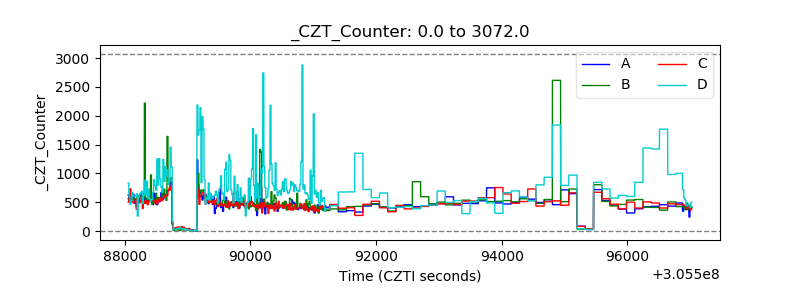 |
| +2.5 Volts monitor |  |
| +5 Volts monitor |  |
| _ROLL_ROT | 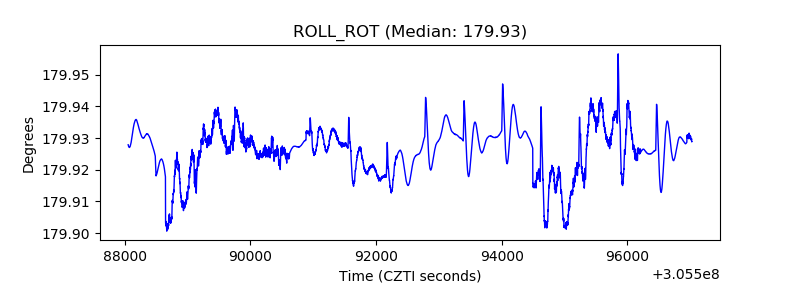 |
| _Roll_DEC | 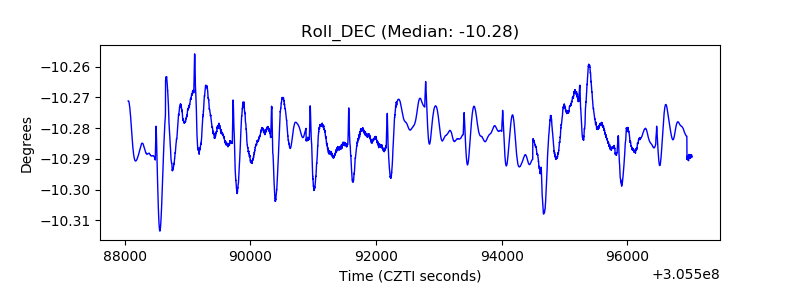 |
| _Roll_RA | 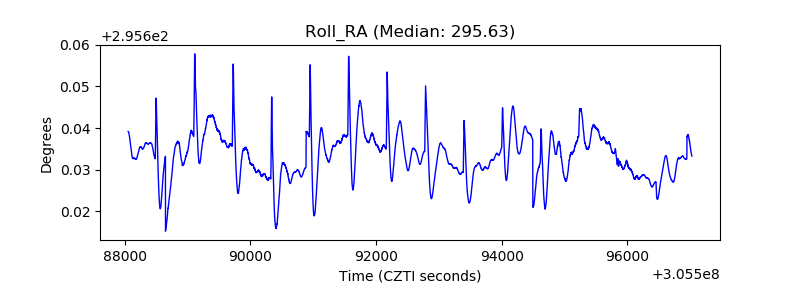 |
| Veto Counter | 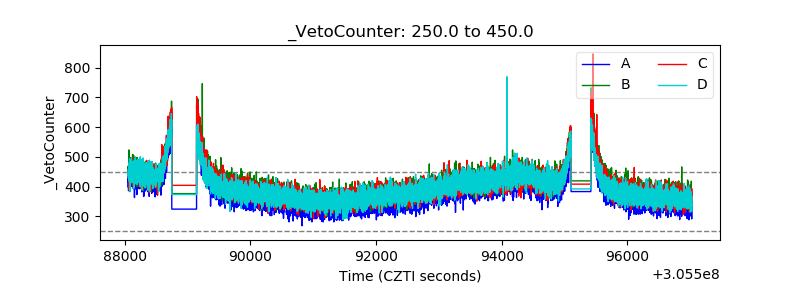 |