| Param | Original file | Final file |
|---|---|---|
| Filename | modeM0/AS1A05_108T01_9000003146cztM0_level2.fits | modeM0/AS1A05_108T01_9000003146cztM0_level2_quad_clean.evt |
| Size (bytes) | 694,327,680 | 608,388,480 |
| Size | 662.2 MB | 580.2 MB |
| Events in quadrant A | 4,287,758 | 3,560,870 |
| Events in quadrant B | 4,156,652 | 3,590,212 |
| Events in quadrant C | 4,186,414 | 3,384,178 |
| Events in quadrant D | 3,626,276 | 3,118,522 |
| Mode M0 | |||
|---|---|---|---|
| Quadrant | BADHDUFLAG | Total packets | Discarded packets |
| A | 0 | 149915 | 0 |
| B | 0 | 149513 | 0 |
| C | 0 | 145580 | 0 |
| D | 0 | 176946 | 0 |
| Mode M9 | |||
|---|---|---|---|
| Quadrant | BADHDUFLAG | Total packets | Discarded packets |
| A | 0 | 114 | 0 |
| B | 0 | 114 | 0 |
| C | 0 | 114 | 0 |
| D | 0 | 114 | 0 |
| Mode SS | |||
|---|---|---|---|
| Quadrant | BADHDUFLAG | Total packets | Discarded packets |
| A | 0 | 1420 | 0 |
| B | 0 | 1420 | 0 |
| C | 0 | 1420 | 0 |
| D | 0 | 1420 | 0 |
| Quadrant | Total seconds | Saturated seconds | Saturation percentage |
|---|---|---|---|
| A | 69560 | 850 | 1.221967% |
| B | 69560 | 984 | 1.414606% |
| C | 69560 | 1073 | 1.542553% |
| D | 69560 | 1759 | 2.528752% |
Noise dominated data is calculated using 1-second bins in cleaned event files. If a bin has >2000 counts, and if more than 50% of those come from <1% of pixels, then it is considered to be noise-dominated and hence unusable.
| Quadrant | # 1 sec bins | Bins with >0 counts | Bins with >2000 counts | High rate bins dominated by noise | Noise dominated (total time) | Noise dominated (detector-on time) | Marked lightcurve |
|---|---|---|---|---|---|---|---|
| A | 80429 | 69552 | 0 | 0 | 0.00% | 0.00% |  |
| B | 80429 | 69548 | 0 | 0 | 0.00% | 0.00% | 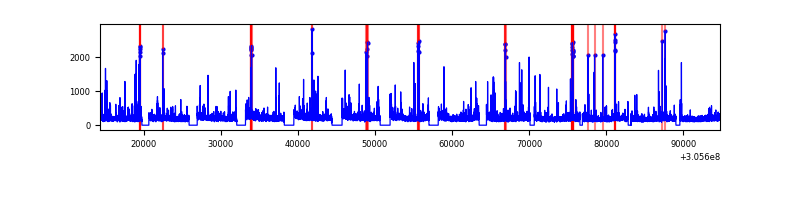 |
| C | 80429 | 69551 | 0 | 0 | 0.00% | 0.00% | 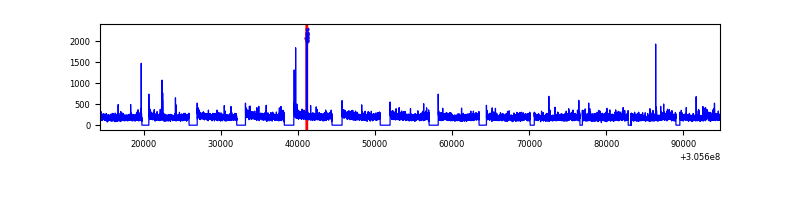 |
| D | 80429 | 69543 | 0 | 0 | 0.00% | 0.00% | 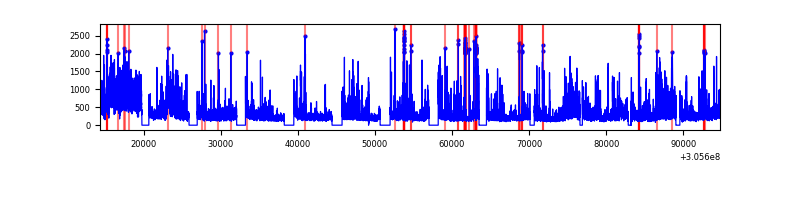 |
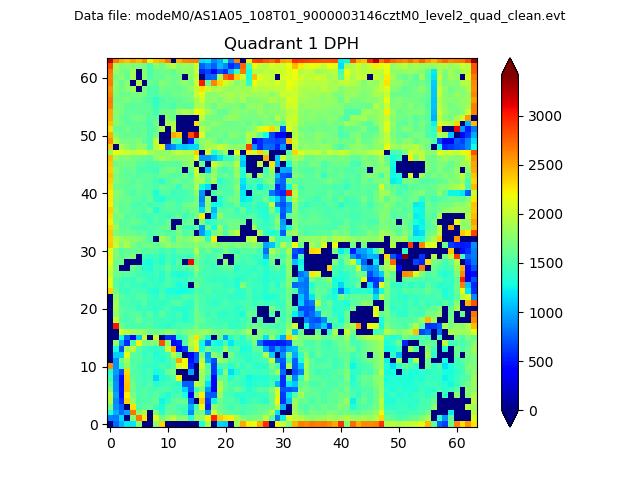
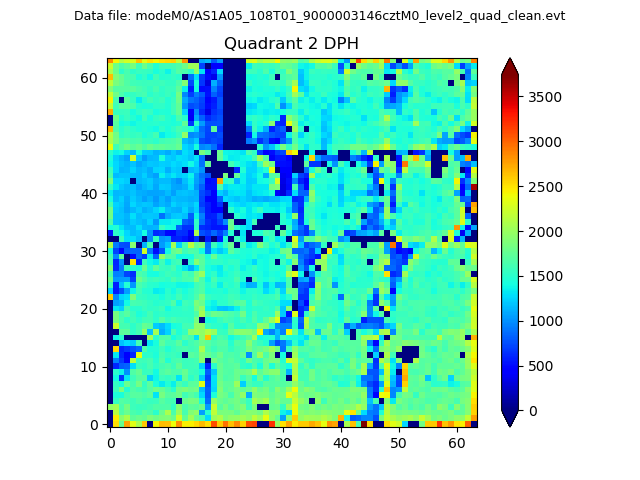
Top three noisy pixels from each quadrant. If the there are fewer than three noisy pixels in the level2.evt file, extra rows are filled as -1
| Pixel properties | Quadrant properties | ||||||
|---|---|---|---|---|---|---|---|
| Quadrant | DetID | PixID | Counts | Sigma | Mean | Median | Sigma |
| A | 0 | 29 | 4084 | 11.1 | 1118 | 1052 | 273.2 |
| A | 7 | 110 | 3592 | 9.3 | 1118 | 1052 | 273.2 |
| A | 0 | 30 | 3262 | 8.09 | 1118 | 1052 | 273.2 |
| B | 2 | 9 | 3256 | 10.27 | 1097 | 1049 | 214.8 |
| B | 3 | 17 | 2711 | 7.74 | 1097 | 1049 | 214.8 |
| B | 5 | 225 | 2696 | 7.67 | 1097 | 1049 | 214.8 |
| C | 1 | 81 | 3147 | 7.46 | 1105 | 1035 | 283.2 |
| C | 1 | 80 | 3137 | 7.42 | 1105 | 1035 | 283.2 |
| C | 12 | 241 | 2927 | 6.68 | 1105 | 1035 | 283.2 |
| D | 3 | 14 | 2605 | 6.03 | 1036 | 945 | 275.0 |
| D | 6 | 231 | 2571 | 5.91 | 1036 | 945 | 275.0 |
| D | 6 | 67 | 2487 | 5.61 | 1036 | 945 | 275.0 |
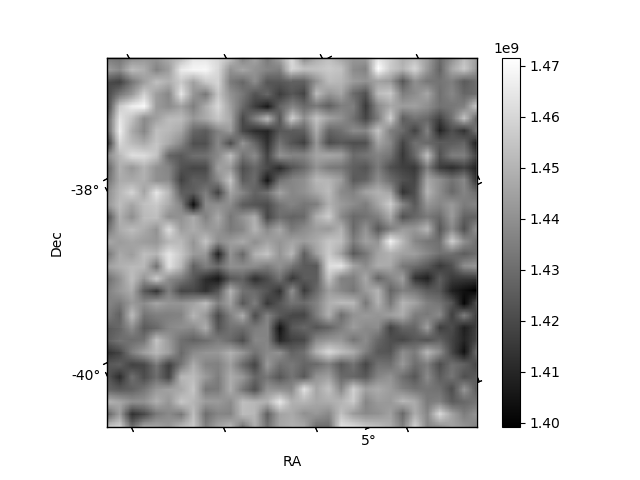
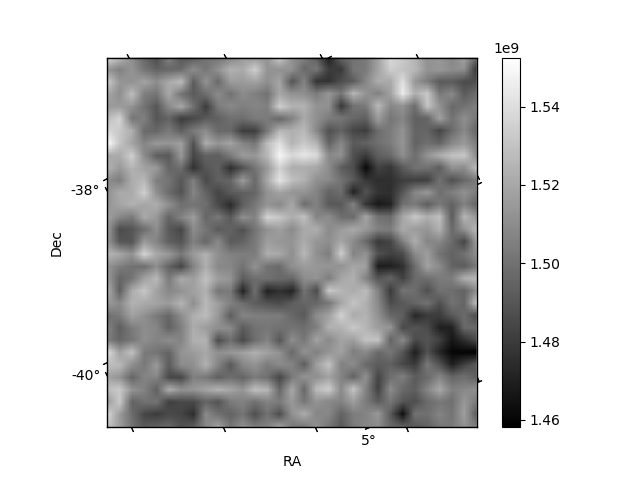
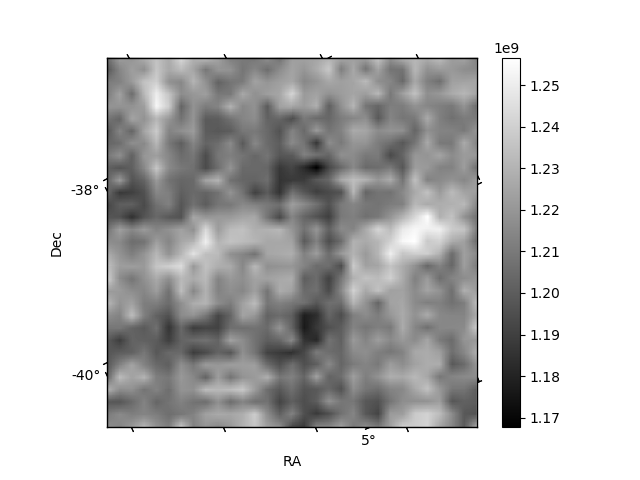
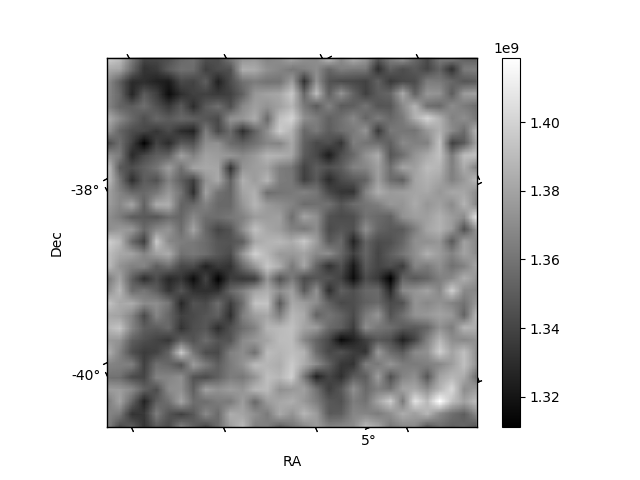
Histogram calculated using DETX and DETY for each event in the final _common_clean file
| Quadrant A | 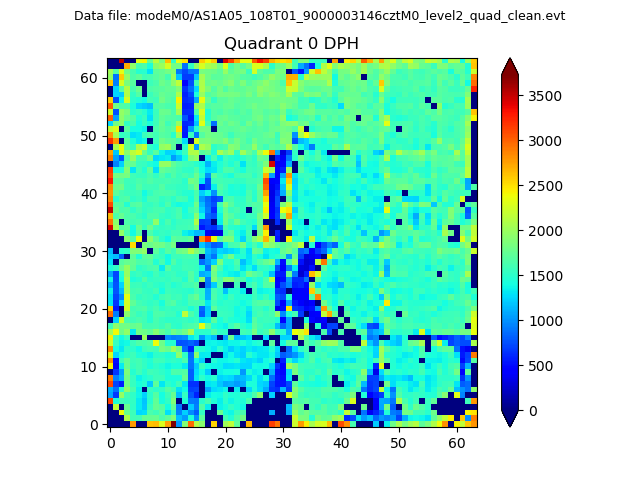 |
 |
Quadrant B |
|---|---|---|---|
| Quadrant D | 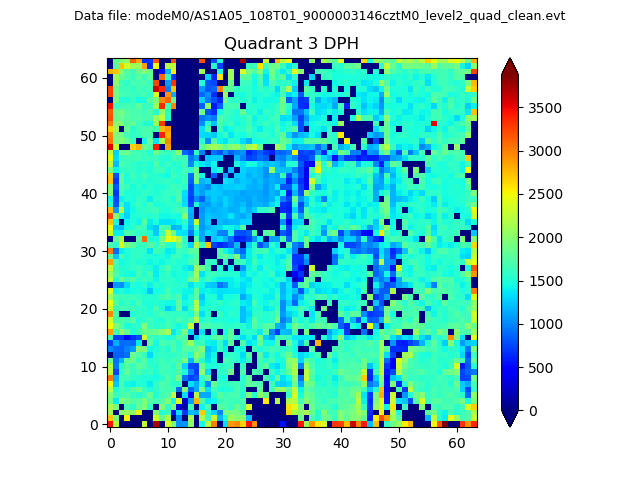 |
 |
Quadrant C |
| Plot type | Count rate plots | Images |
|---|---|---|
| Comparison with Poisson distribution Blue bars denote a histogram of data divided into 1 sec bins. Red curve is a Poisson curve with rate = median count rate of data. |
 |
 |
| Quadrant-wise count rates Data is divided into 100 sec bins |
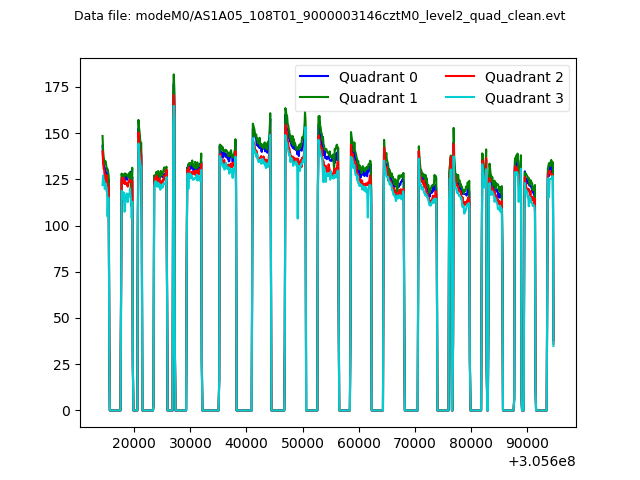 |
|
| Module-wise count rates for Quadrant A Data is divided into 100 sec bins |
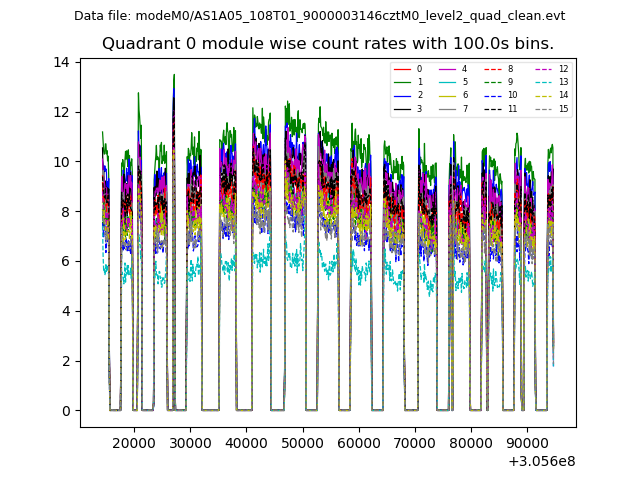 |
 |
| Module-wise count rates for Quadrant B Data is divided into 100 sec bins |
 |
 |
| Module-wise count rates for Quadrant C Data is divided into 100 sec bins |
 |
 |
| Module-wise count rates for Quadrant D Data is divided into 100 sec bins |
 |
 |
| Parameter | Plot |
|---|---|
| CZT HV Monitor | 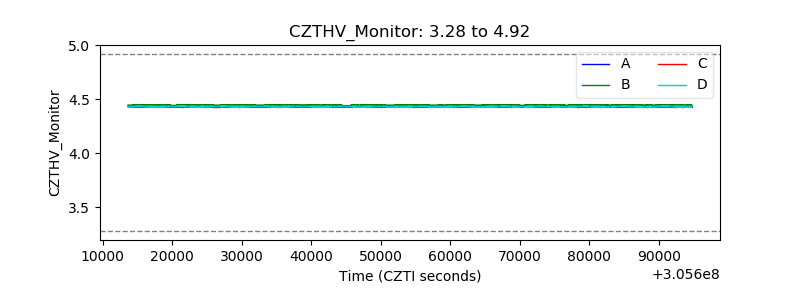 |
| D_VDD | 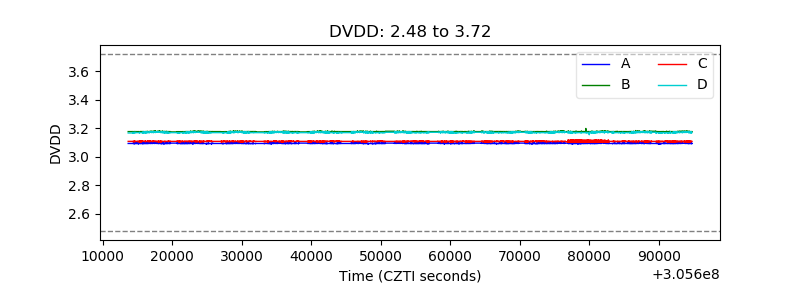 |
| Temperature 1 | 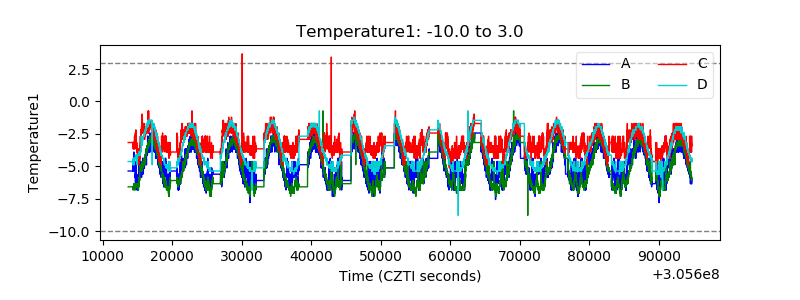 |
| Veto HV Monitor |  |
| Veto LLD | 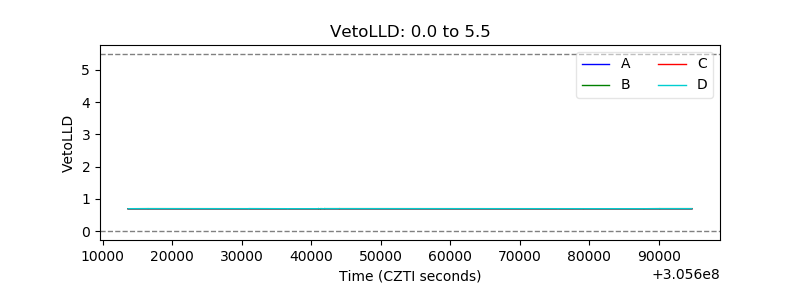 |
| Alpha Counter | 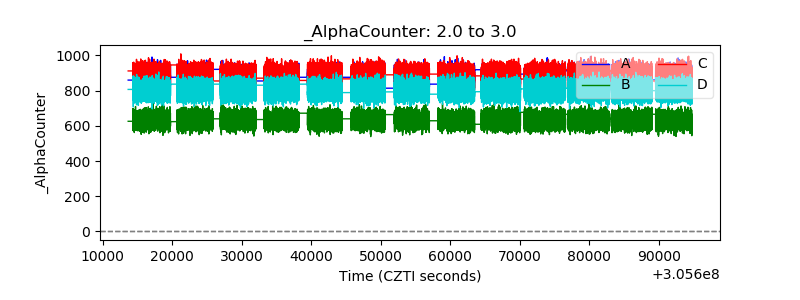 |
| _CPM_Rate | 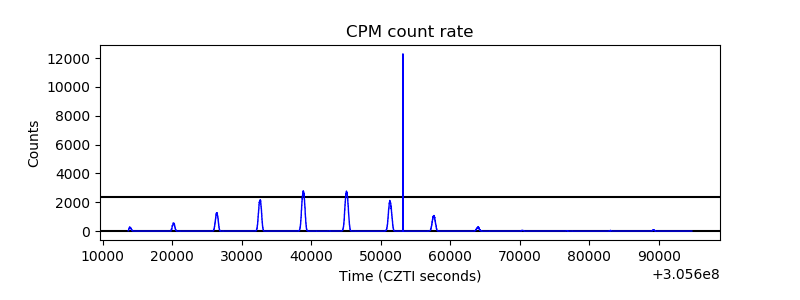 |
| CZT Counter |  |
| +2.5 Volts monitor |  |
| +5 Volts monitor | 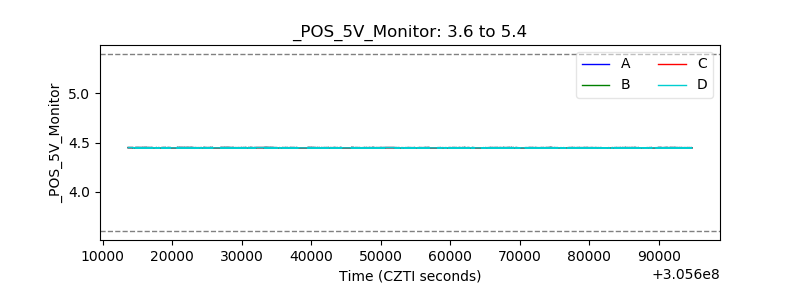 |
| _ROLL_ROT | 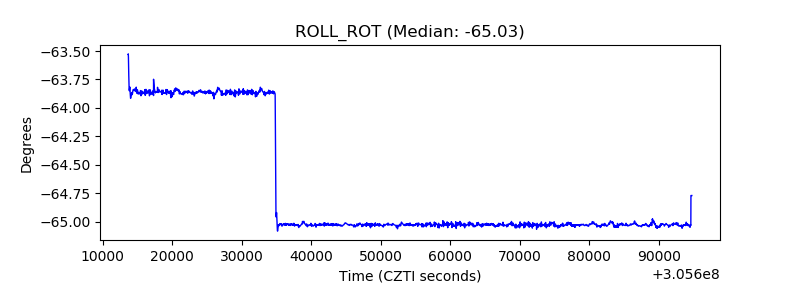 |
| _Roll_DEC | 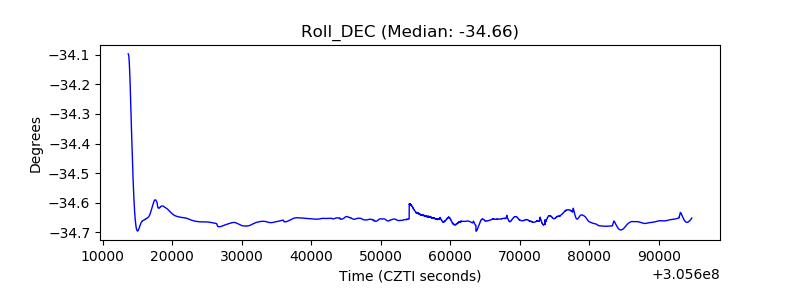 |
| _Roll_RA | 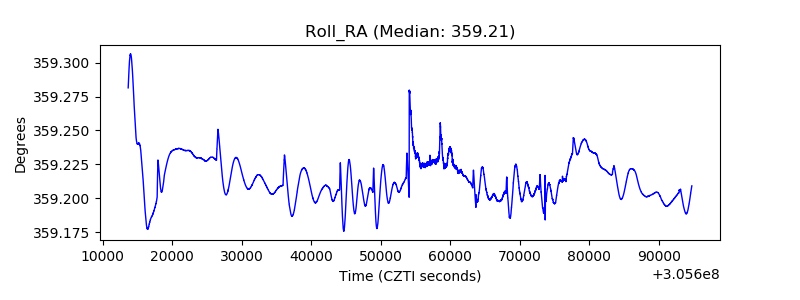 |
| Veto Counter | 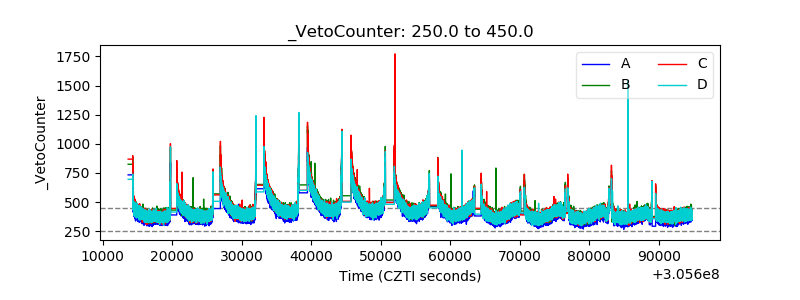 |