| Param | Original file | Final file |
|---|---|---|
| Filename | modeM0/AS1A05_108T01_9000003146_21329cztM0_level2.evt | modeM0/AS1A05_108T01_9000003146_21329cztM0_level2_quad_clean.evt |
| Size (bytes) | 139,602,240 | 24,531,840 |
| Size | 133.1 MB | 23.4 MB |
| Events in quadrant A | 767,115 | 160,767 |
| Events in quadrant B | 788,650 | 164,276 |
| Events in quadrant C | 766,006 | 156,557 |
| Events in quadrant D | 1,799,661 | 147,417 |
| Mode M0 | |||
|---|---|---|---|
| Quadrant | BADHDUFLAG | Total packets | Discarded packets |
| A | 0 | 3207 | 1 |
| B | 0 | 3262 | 1 |
| C | 0 | 3166 | 1 |
| D | 0 | 6417 | 1 |
| Mode M9 | |||
|---|---|---|---|
| Quadrant | BADHDUFLAG | Total packets | Discarded packets |
| A | 0 | 7 | 0 |
| B | 0 | 7 | 0 |
| C | 0 | 7 | 0 |
| D | 0 | 7 | 0 |
| Mode SS | |||
|---|---|---|---|
| Quadrant | BADHDUFLAG | Total packets | Discarded packets |
| A | 0 | 32 | 0 |
| B | 0 | 32 | 0 |
| C | 0 | 32 | 0 |
| D | 0 | 32 | 0 |
| Quadrant | Total seconds | Saturated seconds | Saturation percentage |
|---|---|---|---|
| A | 1534 | 21 | 1.368970% |
| B | 1533 | 24 | 1.565558% |
| C | 1533 | 28 | 1.826484% |
| D | 1533 | 126 | 8.219178% |
Noise dominated data is calculated using 1-second bins in cleaned event files. If a bin has >2000 counts, and if more than 50% of those come from <1% of pixels, then it is considered to be noise-dominated and hence unusable.
| Quadrant | # 1 sec bins | Bins with >0 counts | Bins with >2000 counts | High rate bins dominated by noise | Noise dominated (total time) | Noise dominated (detector-on time) | Marked lightcurve |
|---|---|---|---|---|---|---|---|
| A | 1534 | 1534 | 0 | 0 | 0.00% | 0.00% | 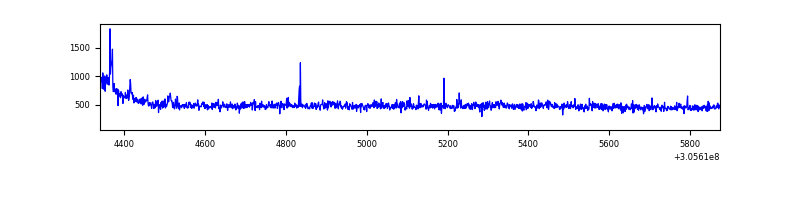 |
| B | 1533 | 1533 | 1 | 1 | 0.07% | 0.07% | 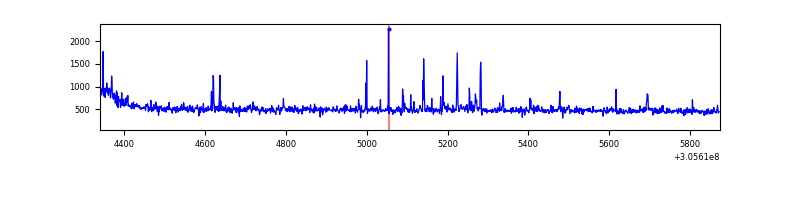 |
| C | 1533 | 1533 | 0 | 0 | 0.00% | 0.00% | 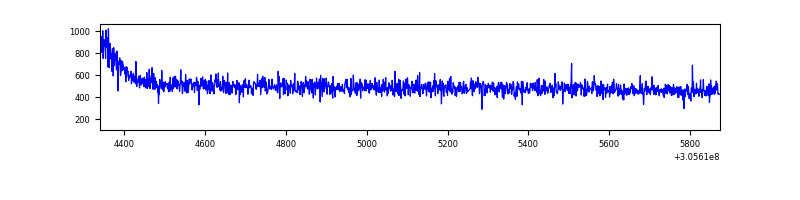 |
| D | 1533 | 1533 | 79 | 79 | 5.15% | 5.15% |  |
Top three noisy pixels from each quadrant. If the there are fewer than three noisy pixels in the level2.evt file, extra rows are filled as -1
| Pixel properties | Quadrant properties | ||||||
|---|---|---|---|---|---|---|---|
| Quadrant | DetID | PixID | Counts | Sigma | Mean | Median | Sigma |
| A | 5 | 168 | 18953 | 466.15 | 191 | 186 | 40.3 |
| A | 9 | 143 | 10048 | 244.96 | 191 | 186 | 40.3 |
| A | 5 | 16 | 2162 | 49.08 | 191 | 186 | 40.3 |
| B | 6 | 36 | 15815 | 403.13 | 190 | 185 | 38.8 |
| B | 3 | 64 | 9775 | 247.34 | 190 | 185 | 38.8 |
| B | 4 | 173 | 6313 | 158.05 | 190 | 185 | 38.8 |
| C | 14 | 238 | 28915 | 620.12 | 189 | 189 | 46.3 |
| C | 13 | 61 | 1249 | 22.88 | 189 | 189 | 46.3 |
| C | 7 | 247 | 481 | 6.3 | 189 | 189 | 46.3 |
| D | 13 | 174 | 1002576 | 21654.11 | 184 | 179 | 46.3 |
| D | 9 | 68 | 62878 | 1354.44 | 184 | 179 | 46.3 |
| D | 1 | 52 | 32853 | 705.83 | 184 | 179 | 46.3 |
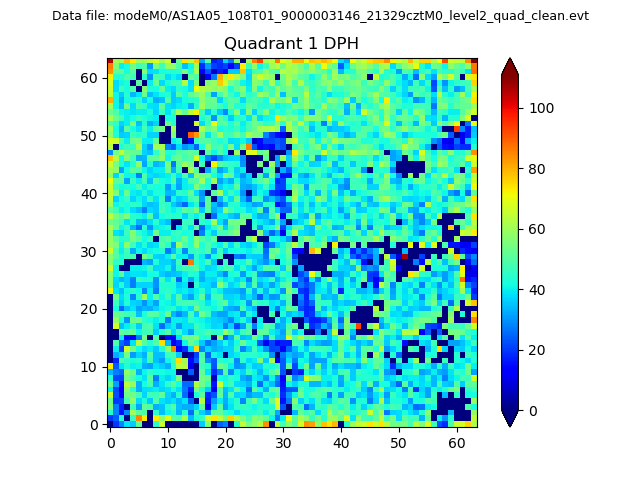
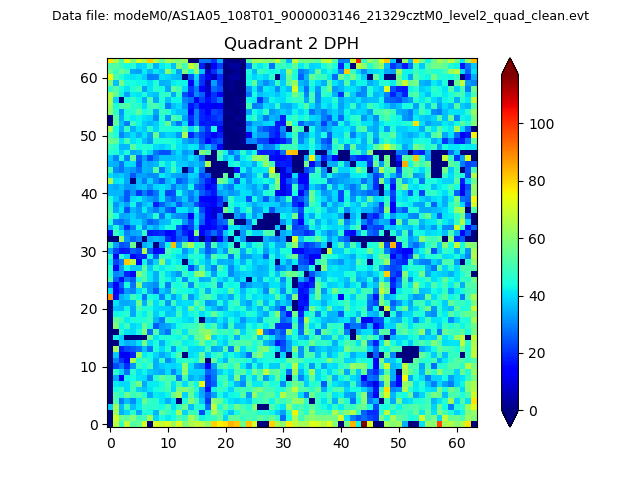
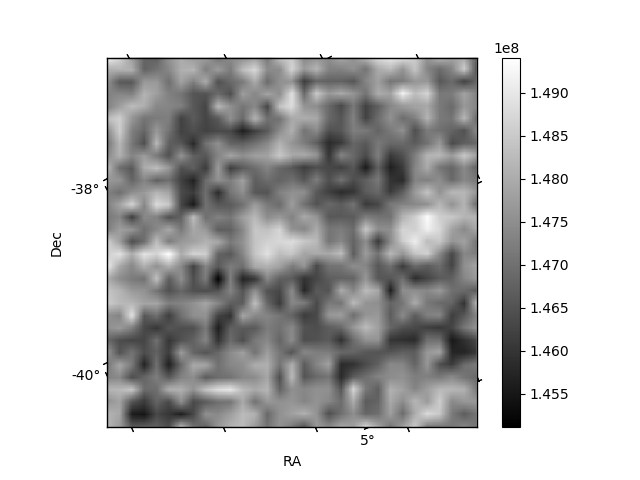
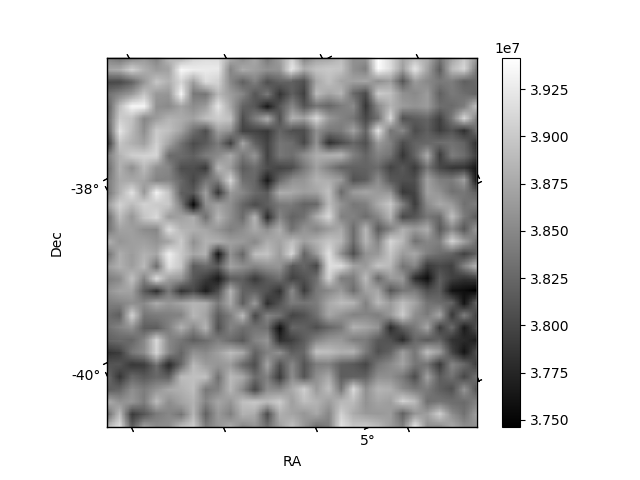
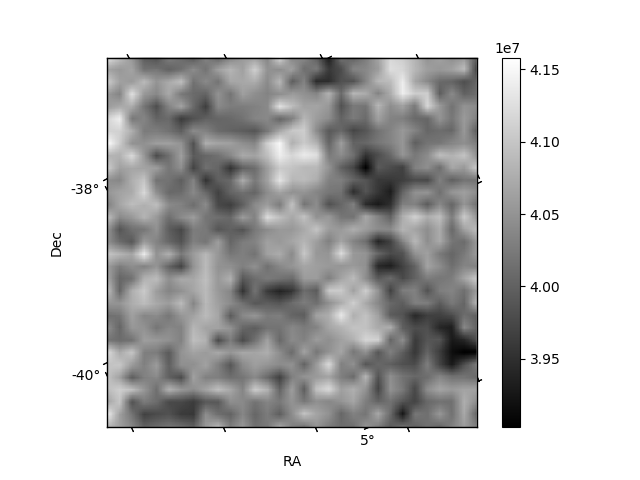
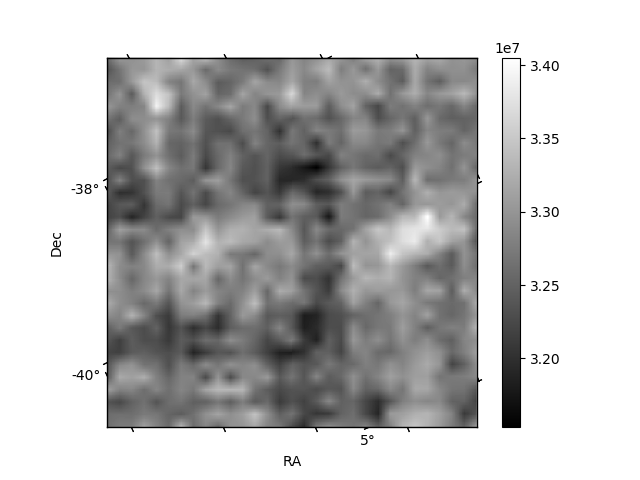
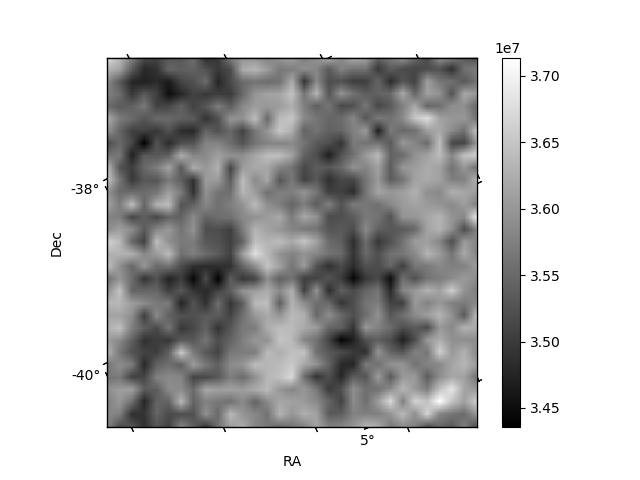
Histogram calculated using DETX and DETY for each event in the final _common_clean file
| Quadrant A | 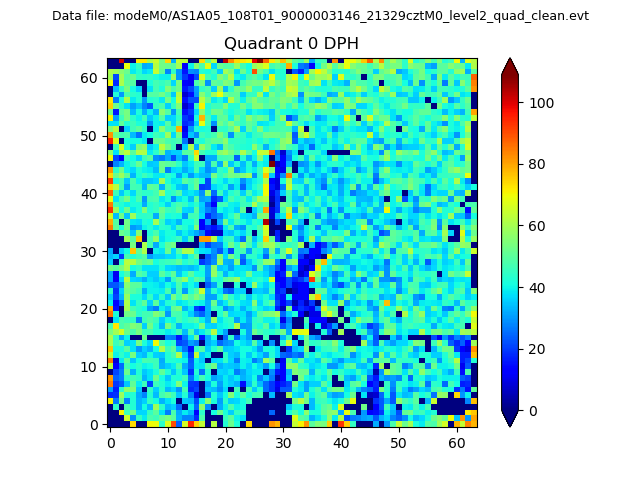 |
 |
Quadrant B |
|---|---|---|---|
| Quadrant D | 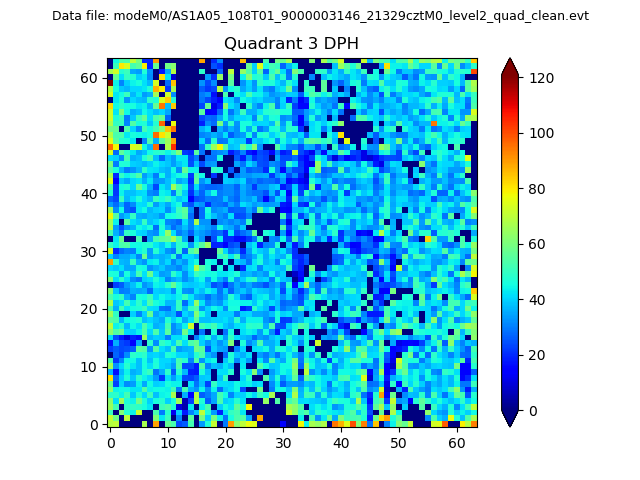 |
 |
Quadrant C |
| Plot type | Count rate plots | Images |
|---|---|---|
| Comparison with Poisson distribution Blue bars denote a histogram of data divided into 1 sec bins. Red curve is a Poisson curve with rate = median count rate of data. |
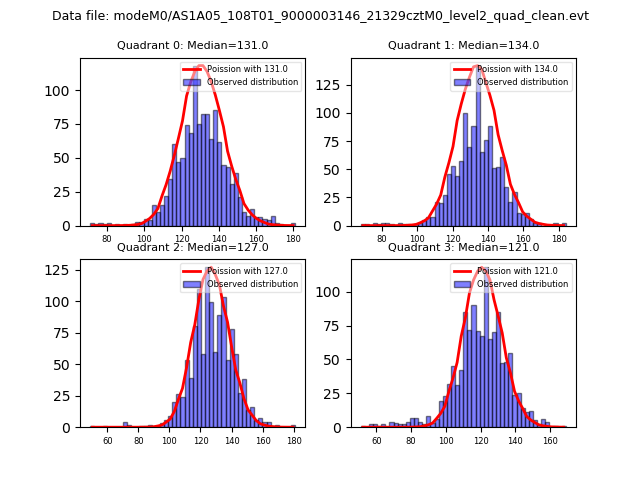 |
 |
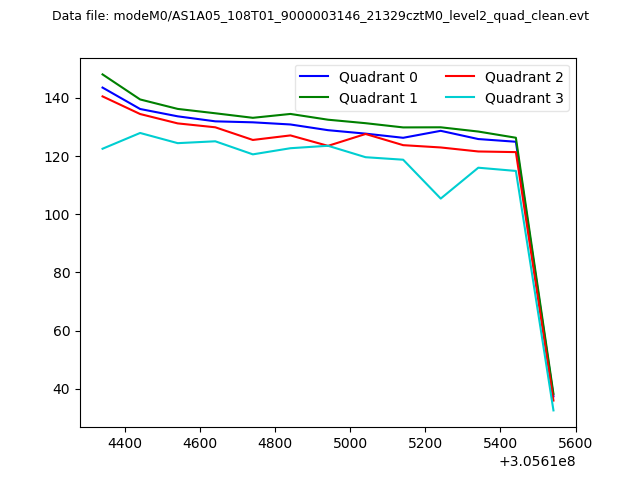
| Quadrant-wise count rates Data is divided into 100 sec bins |
 |
|
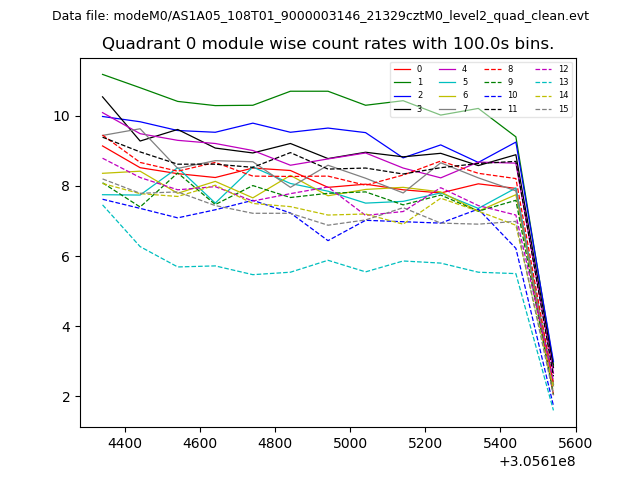
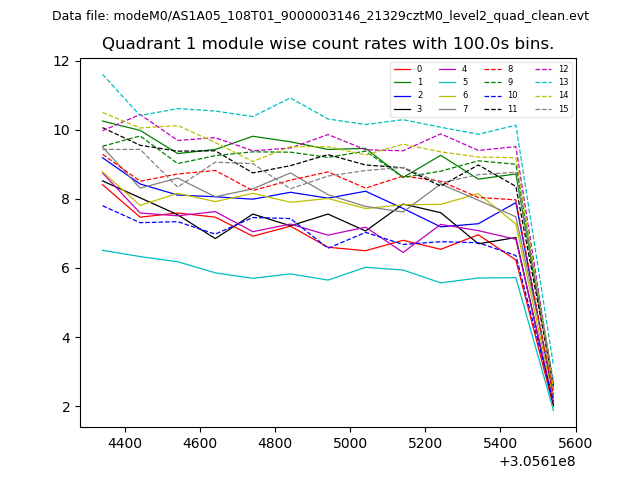
| Module-wise count rates for Quadrant A Data is divided into 100 sec bins |
 |
 |
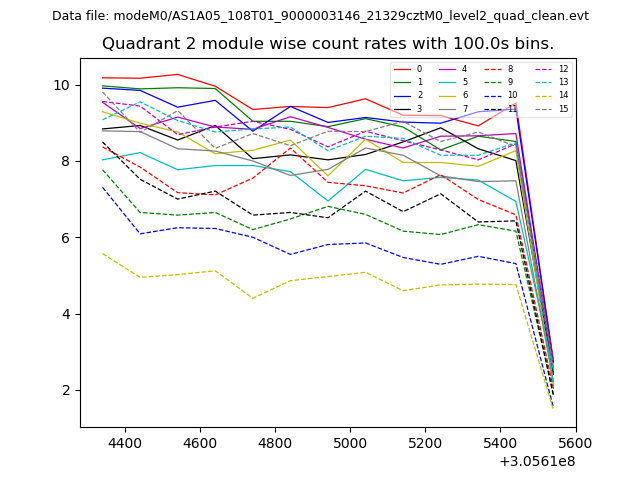
| Module-wise count rates for Quadrant B Data is divided into 100 sec bins |
 |
 |
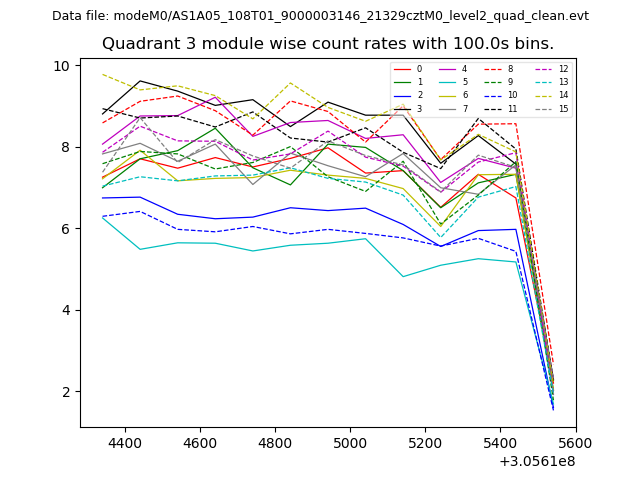
| Module-wise count rates for Quadrant C Data is divided into 100 sec bins |
 |
 |
| Module-wise count rates for Quadrant D Data is divided into 100 sec bins |
 |
 |
| Parameter | Plot |
|---|---|
| CZT HV Monitor | 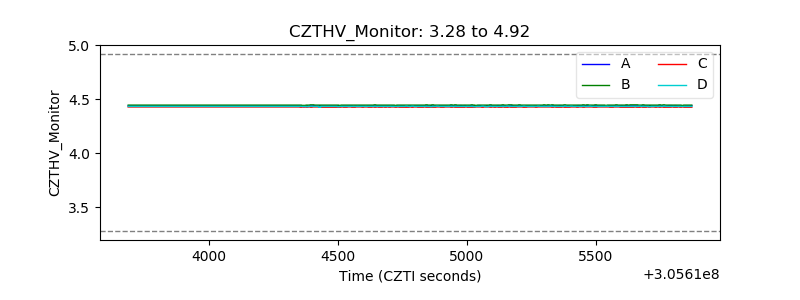 |
| D_VDD |  |
| Temperature 1 | 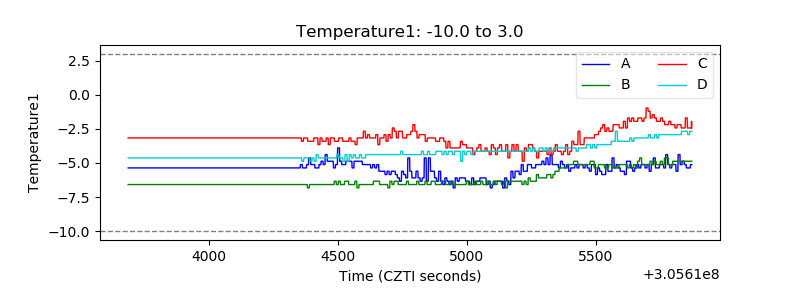 |
| Veto HV Monitor | 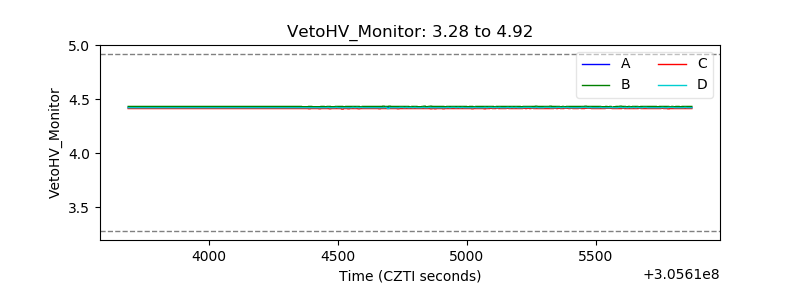 |
| Veto LLD | 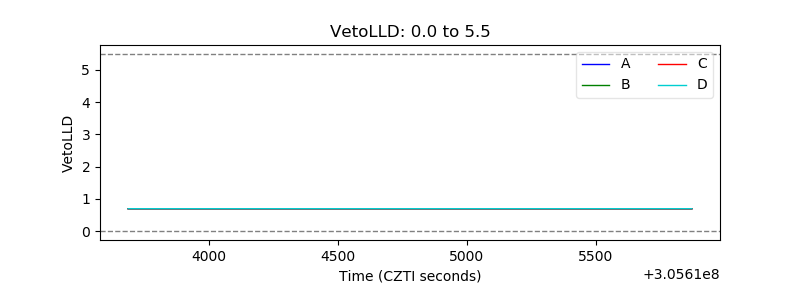 |
| Alpha Counter | 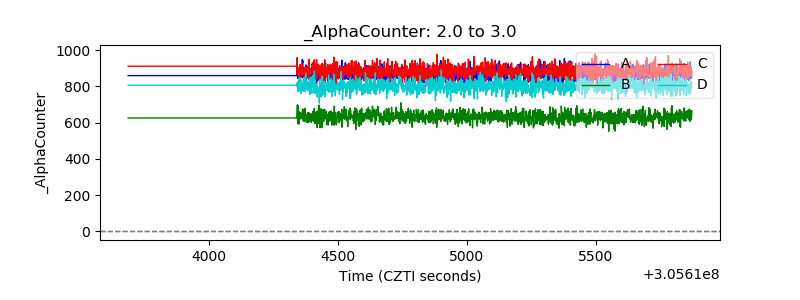 |
| _CPM_Rate | 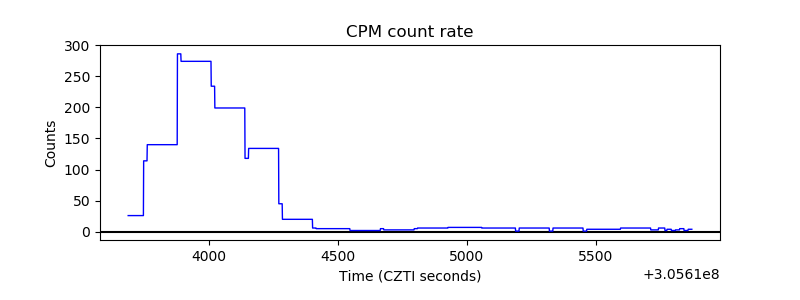 |
| CZT Counter | 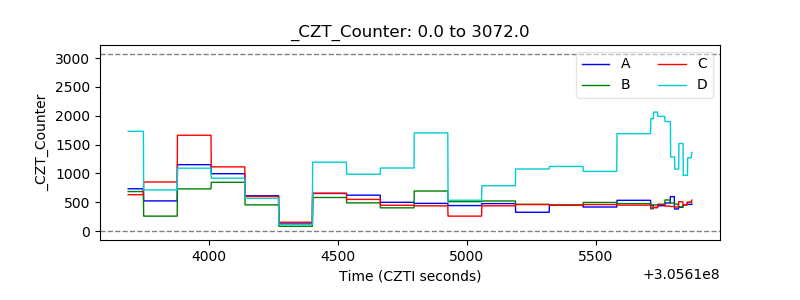 |
| +2.5 Volts monitor |  |
| +5 Volts monitor |  |
| _ROLL_ROT | 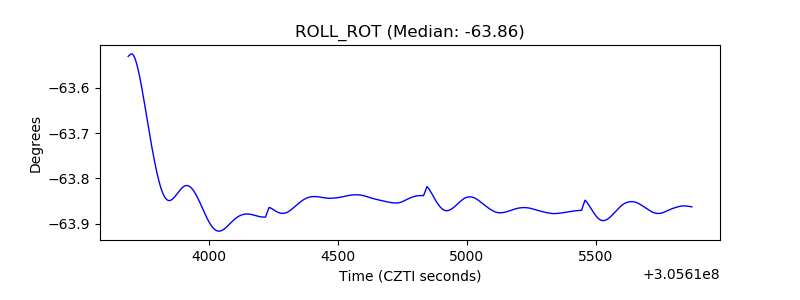 |
| _Roll_DEC | 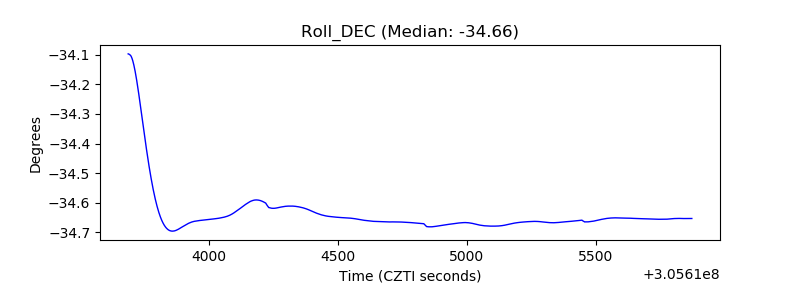 |
| _Roll_RA | 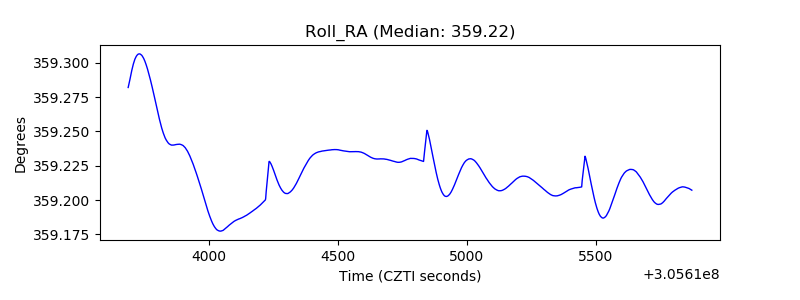 |
| Veto Counter | 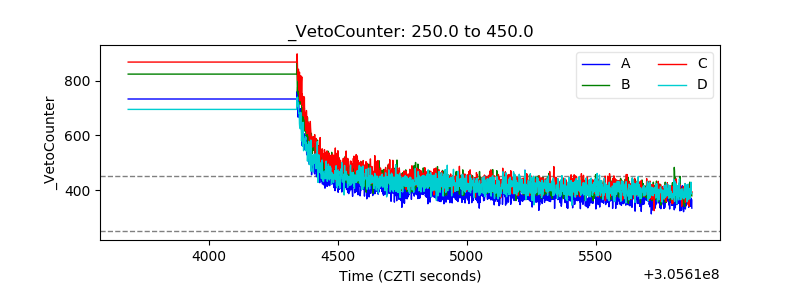 |