| Param | Original file | Final file |
|---|---|---|
| Filename | modeM0/AS1A05_108T01_9000003146_21331cztM0_level2.evt | modeM0/AS1A05_108T01_9000003146_21331cztM0_level2_quad_clean.evt |
| Size (bytes) | 478,411,200 | 71,902,080 |
| Size | 456.2 MB | 68.6 MB |
| Events in quadrant A | 3,189,375 | 435,372 |
| Events in quadrant B | 3,253,383 | 443,694 |
| Events in quadrant C | 3,207,458 | 428,819 |
| Events in quadrant D | 4,400,165 | 418,782 |
| Mode M0 | |||
|---|---|---|---|
| Quadrant | BADHDUFLAG | Total packets | Discarded packets |
| A | 0 | 13514 | 1 |
| B | 0 | 13708 | 1 |
| C | 0 | 13555 | 1 |
| D | 0 | 17437 | 1 |
| Mode M9 | |||
|---|---|---|---|
| Quadrant | BADHDUFLAG | Total packets | Discarded packets |
| A | 0 | 10 | 0 |
| B | 0 | 10 | 0 |
| C | 0 | 10 | 0 |
| D | 0 | 10 | 0 |
| Mode SS | |||
|---|---|---|---|
| Quadrant | BADHDUFLAG | Total packets | Discarded packets |
| A | 0 | 132 | 0 |
| B | 0 | 132 | 0 |
| C | 0 | 132 | 0 |
| D | 0 | 132 | 0 |
| Quadrant | Total seconds | Saturated seconds | Saturation percentage |
|---|---|---|---|
| A | 6455 | 39 | 0.604183% |
| B | 6455 | 43 | 0.666150% |
| C | 6456 | 73 | 1.130731% |
| D | 6456 | 83 | 1.285626% |
Noise dominated data is calculated using 1-second bins in cleaned event files. If a bin has >2000 counts, and if more than 50% of those come from <1% of pixels, then it is considered to be noise-dominated and hence unusable.
| Quadrant | # 1 sec bins | Bins with >0 counts | Bins with >2000 counts | High rate bins dominated by noise | Noise dominated (total time) | Noise dominated (detector-on time) | Marked lightcurve |
|---|---|---|---|---|---|---|---|
| A | 7515 | 6455 | 0 | 0 | 0.00% | 0.00% | 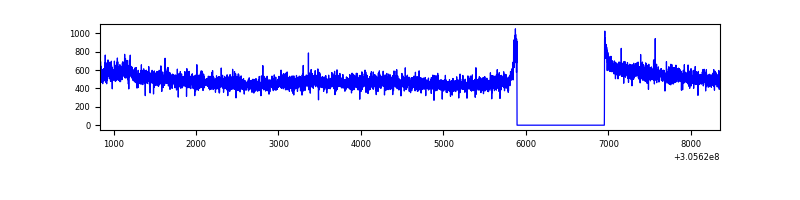 |
| B | 7515 | 6455 | 4 | 4 | 0.05% | 0.06% | 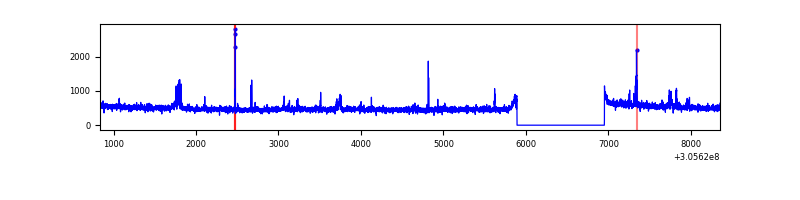 |
| C | 7516 | 6456 | 0 | 0 | 0.00% | 0.00% | 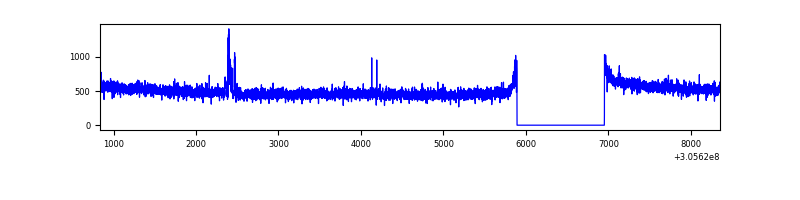 |
| D | 7516 | 6456 | 41 | 41 | 0.55% | 0.64% |  |
Top three noisy pixels from each quadrant. If the there are fewer than three noisy pixels in the level2.evt file, extra rows are filled as -1
| Pixel properties | Quadrant properties | ||||||
|---|---|---|---|---|---|---|---|
| Quadrant | DetID | PixID | Counts | Sigma | Mean | Median | Sigma |
| A | 5 | 168 | 45818 | 280.95 | 803 | 787 | 160.3 |
| A | 15 | 236 | 25329 | 153.12 | 803 | 787 | 160.3 |
| A | 11 | 47 | 18800 | 112.38 | 803 | 787 | 160.3 |
| B | 0 | 230 | 61291 | 399.99 | 801 | 780 | 151.3 |
| B | 3 | 64 | 22482 | 143.46 | 801 | 780 | 151.3 |
| B | 4 | 173 | 21805 | 138.98 | 801 | 780 | 151.3 |
| C | 14 | 238 | 122947 | 674.41 | 781 | 788 | 181.1 |
| C | 7 | 220 | 34351 | 185.29 | 781 | 788 | 181.1 |
| C | 13 | 61 | 5492 | 25.97 | 781 | 788 | 181.1 |
| D | 13 | 174 | 1109293 | 5884.19 | 786 | 765 | 188.4 |
| D | 1 | 52 | 139083 | 734.21 | 786 | 765 | 188.4 |
| D | 1 | 20 | 113575 | 598.81 | 786 | 765 | 188.4 |
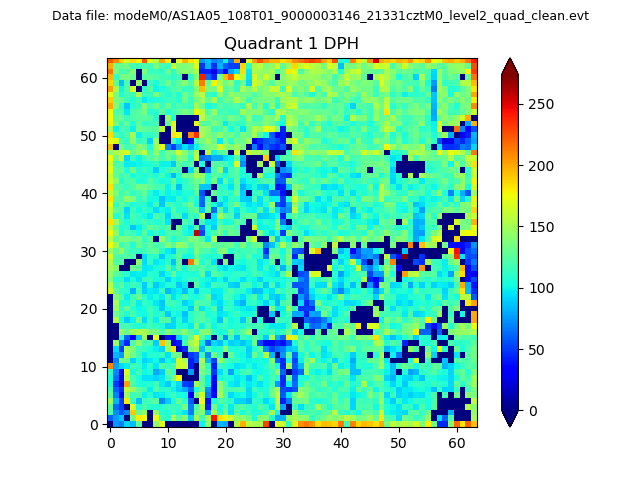
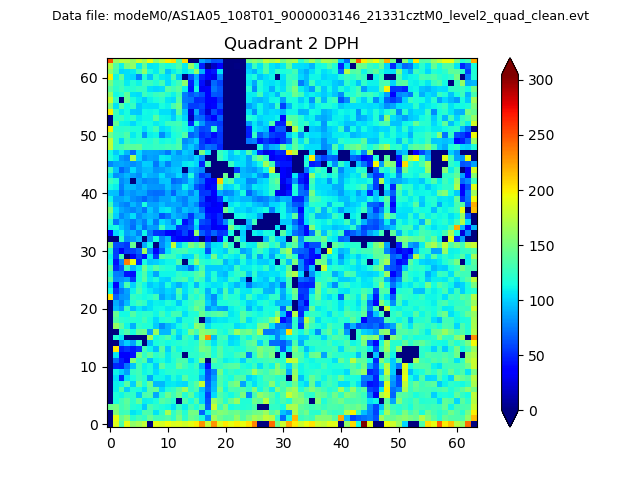
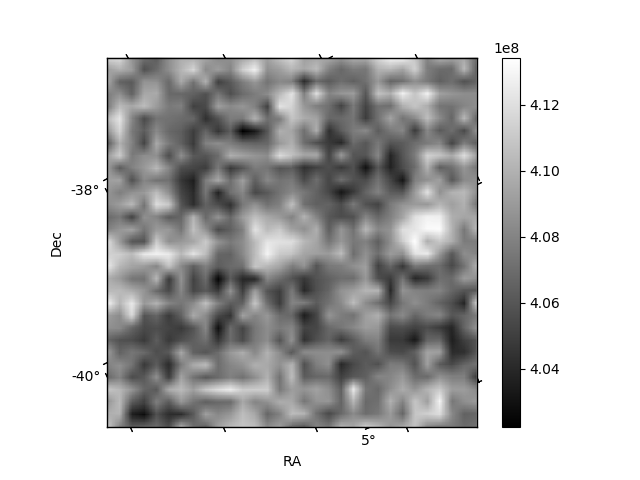
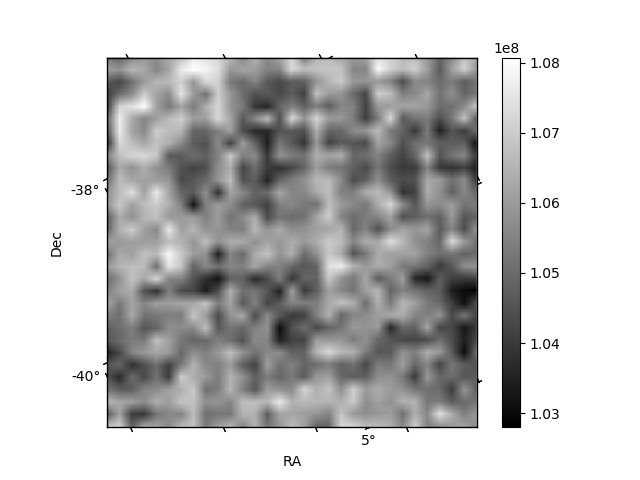
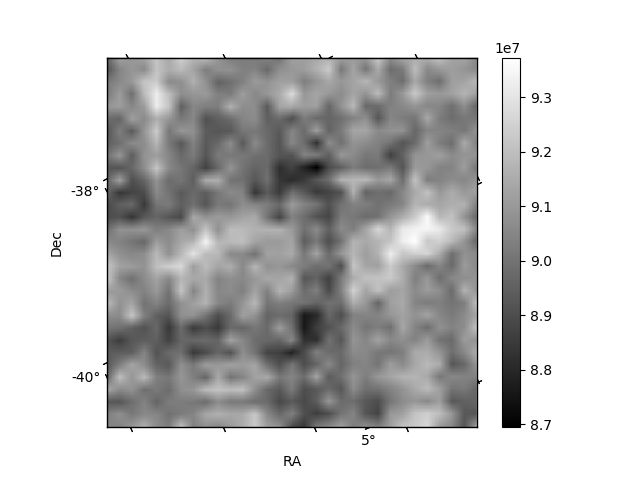
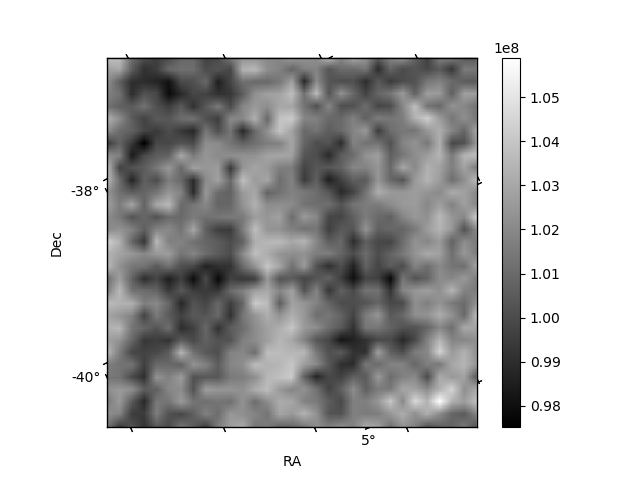
Histogram calculated using DETX and DETY for each event in the final _common_clean file
| Quadrant A | 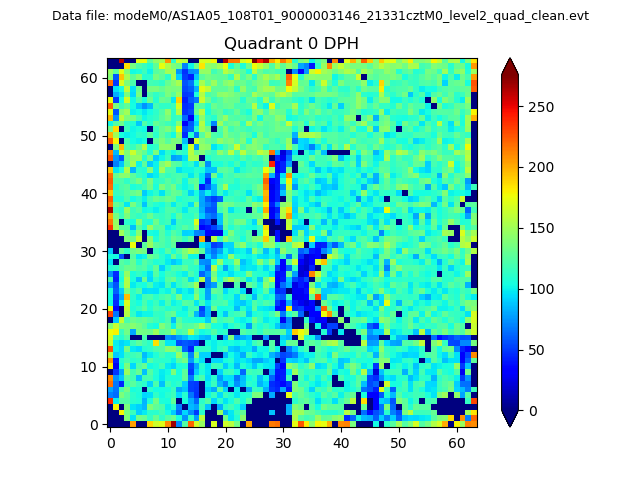 |
 |
Quadrant B |
|---|---|---|---|
| Quadrant D | 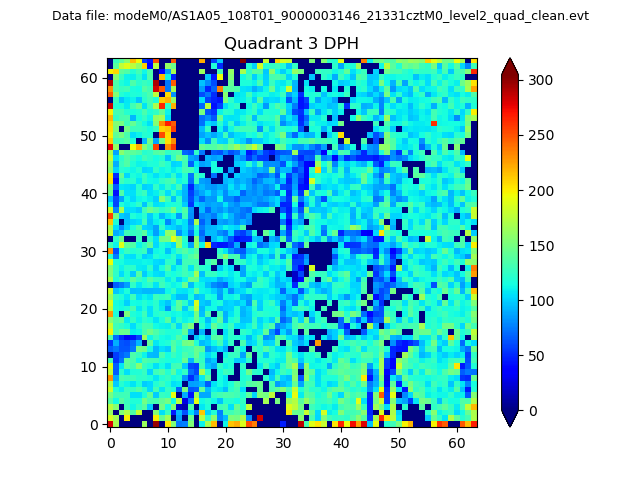 |
 |
Quadrant C |
| Plot type | Count rate plots | Images |
|---|---|---|
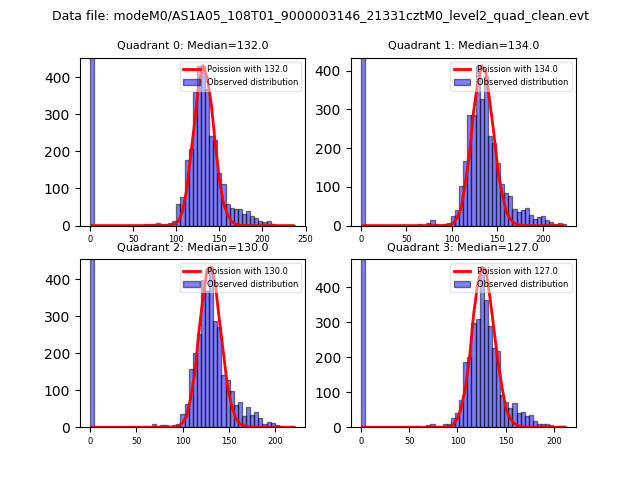
| Comparison with Poisson distribution Blue bars denote a histogram of data divided into 1 sec bins. Red curve is a Poisson curve with rate = median count rate of data. |
 |
 |
| Quadrant-wise count rates Data is divided into 100 sec bins |
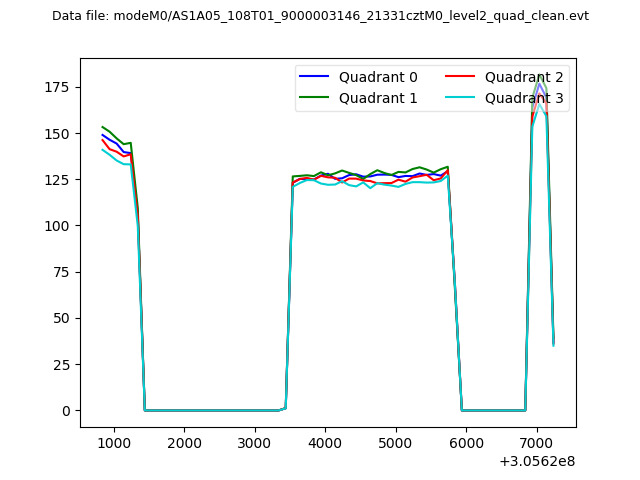 |
|
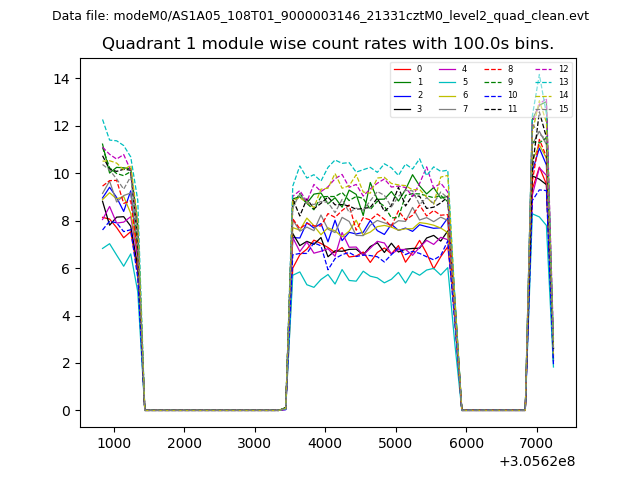
| Module-wise count rates for Quadrant A Data is divided into 100 sec bins |
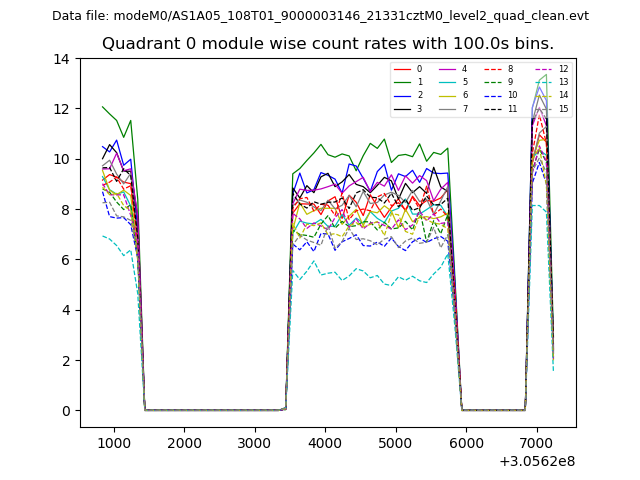 |
 |
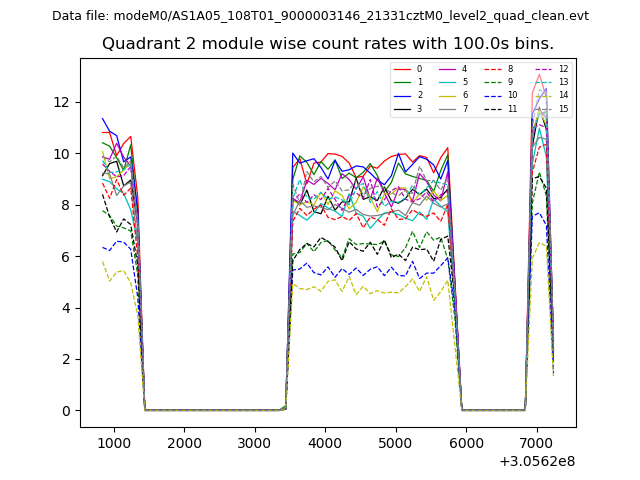
| Module-wise count rates for Quadrant B Data is divided into 100 sec bins |
 |
 |
| Module-wise count rates for Quadrant C Data is divided into 100 sec bins |
 |
 |
| Module-wise count rates for Quadrant D Data is divided into 100 sec bins |
 |
 |
| Parameter | Plot |
|---|---|
| CZT HV Monitor | 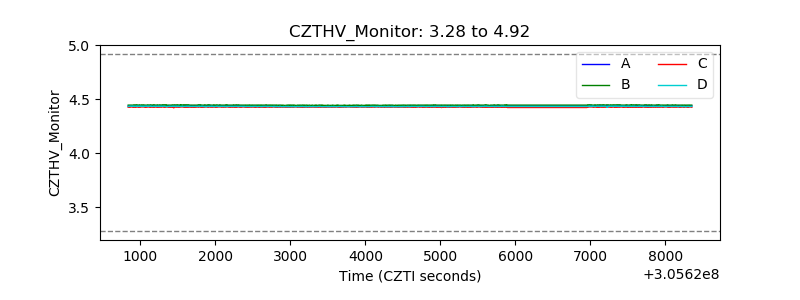 |
| D_VDD |  |
| Temperature 1 | 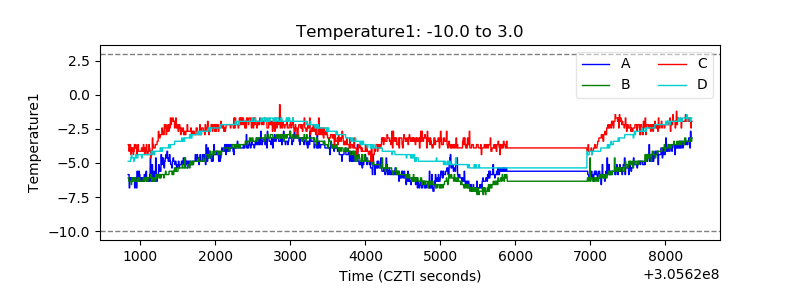 |
| Veto HV Monitor | 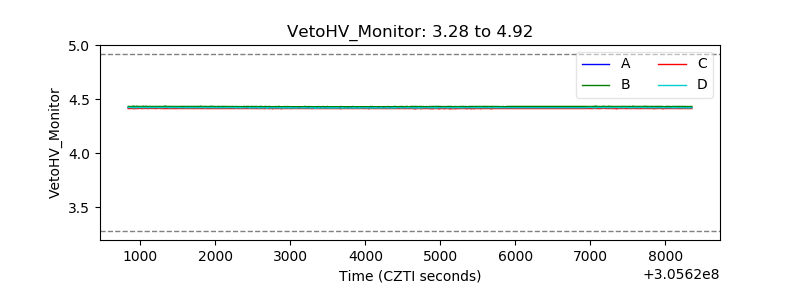 |
| Veto LLD | 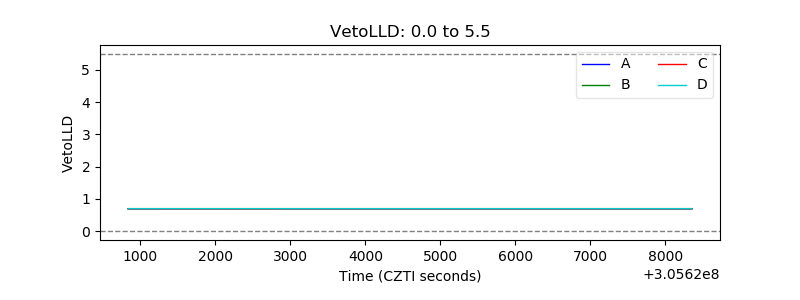 |
| Alpha Counter | 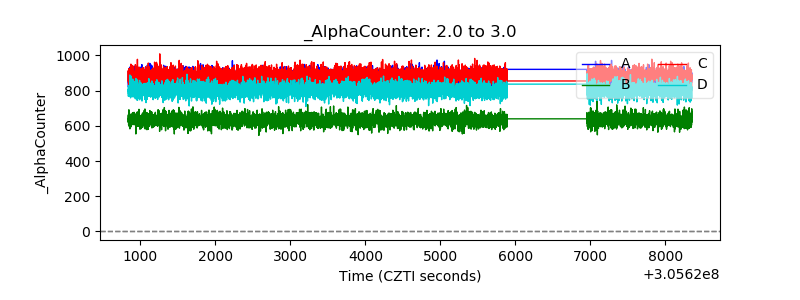 |
| _CPM_Rate | 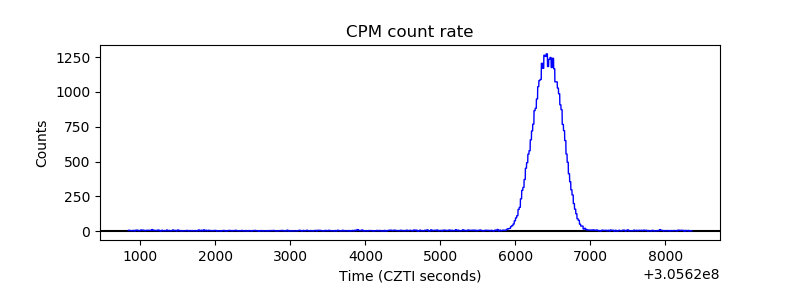 |
| CZT Counter | 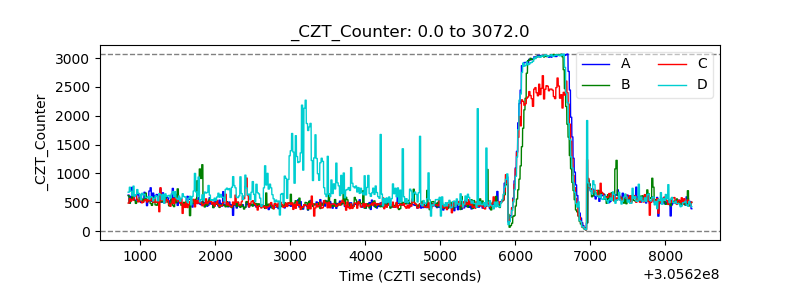 |
| +2.5 Volts monitor |  |
| +5 Volts monitor |  |
| _ROLL_ROT | 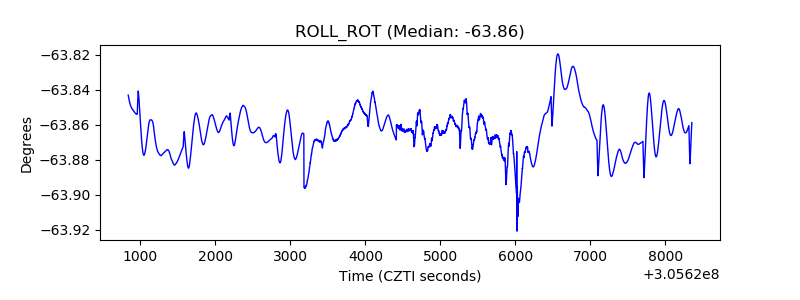 |
| _Roll_DEC | 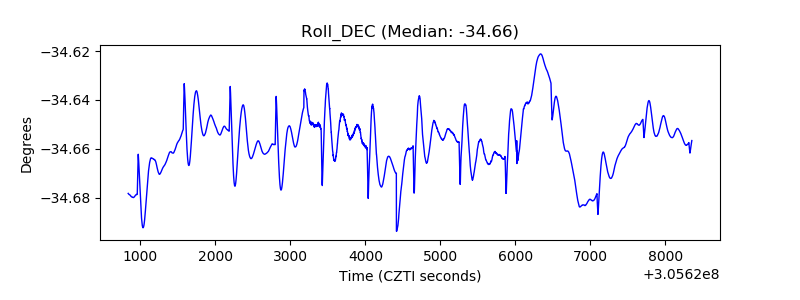 |
| _Roll_RA | 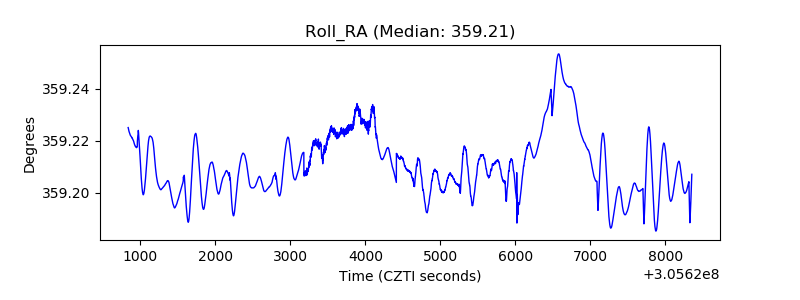 |
| Veto Counter | 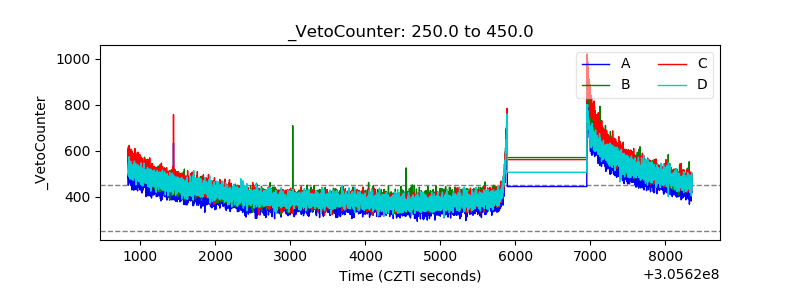 |