| Param | Original file | Final file |
|---|---|---|
| Filename | modeM0/AS1A05_108T01_9000003146_21333cztM0_level2.evt | modeM0/AS1A05_108T01_9000003146_21333cztM0_level2_quad_clean.evt |
| Size (bytes) | 467,801,280 | 67,993,920 |
| Size | 446.1 MB | 64.8 MB |
| Events in quadrant A | 3,361,640 | 406,928 |
| Events in quadrant B | 3,461,340 | 412,657 |
| Events in quadrant C | 3,364,056 | 399,269 |
| Events in quadrant D | 3,540,990 | 388,625 |
| Mode M0 | |||
|---|---|---|---|
| Quadrant | BADHDUFLAG | Total packets | Discarded packets |
| A | 0 | 14107 | 2 |
| B | 0 | 14433 | 2 |
| C | 0 | 14140 | 3 |
| D | 0 | 14712 | 2 |
| Mode M9 | |||
|---|---|---|---|
| Quadrant | BADHDUFLAG | Total packets | Discarded packets |
| A | 0 | 18 | 0 |
| B | 0 | 19 | 0 |
| C | 0 | 19 | 0 |
| D | 0 | 19 | 0 |
| Mode SS | |||
|---|---|---|---|
| Quadrant | BADHDUFLAG | Total packets | Discarded packets |
| A | 0 | 130 | 0 |
| B | 0 | 130 | 0 |
| C | 0 | 130 | 0 |
| D | 0 | 130 | 0 |
| Quadrant | Total seconds | Saturated seconds | Saturation percentage |
|---|---|---|---|
| A | 6475 | 84 | 1.297297% |
| B | 6475 | 101 | 1.559846% |
| C | 6474 | 116 | 1.791783% |
| D | 6474 | 94 | 1.451962% |
Noise dominated data is calculated using 1-second bins in cleaned event files. If a bin has >2000 counts, and if more than 50% of those come from <1% of pixels, then it is considered to be noise-dominated and hence unusable.
| Quadrant | # 1 sec bins | Bins with >0 counts | Bins with >2000 counts | High rate bins dominated by noise | Noise dominated (total time) | Noise dominated (detector-on time) | Marked lightcurve |
|---|---|---|---|---|---|---|---|
| A | 7615 | 6475 | 0 | 0 | 0.00% | 0.00% | 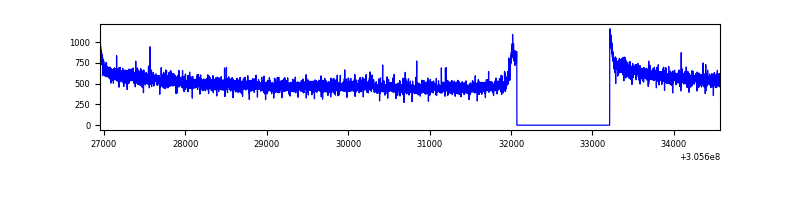 |
| B | 7615 | 6475 | 12 | 12 | 0.16% | 0.19% |  |
| C | 7614 | 6474 | 0 | 0 | 0.00% | 0.00% | 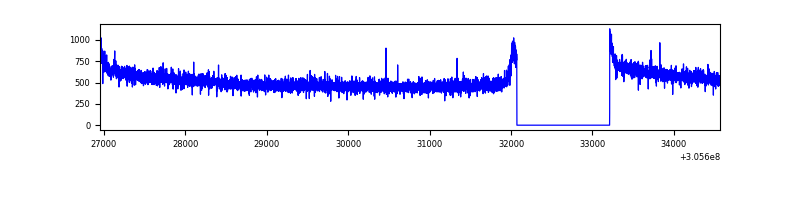 |
| D | 7614 | 6474 | 22 | 22 | 0.29% | 0.34% | 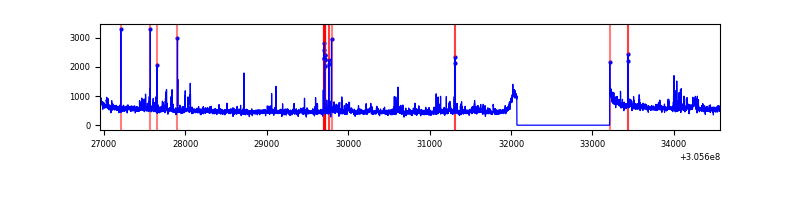 |
Top three noisy pixels from each quadrant. If the there are fewer than three noisy pixels in the level2.evt file, extra rows are filled as -1
| Pixel properties | Quadrant properties | ||||||
|---|---|---|---|---|---|---|---|
| Quadrant | DetID | PixID | Counts | Sigma | Mean | Median | Sigma |
| A | 5 | 168 | 32455 | 184.86 | 859 | 843 | 171.0 |
| A | 11 | 47 | 20814 | 116.78 | 859 | 843 | 171.0 |
| A | 13 | 254 | 9067 | 48.09 | 859 | 843 | 171.0 |
| B | 3 | 64 | 45629 | 281.17 | 852 | 831 | 159.3 |
| B | 4 | 173 | 30827 | 188.27 | 852 | 831 | 159.3 |
| B | 0 | 230 | 29451 | 179.63 | 852 | 831 | 159.3 |
| C | 14 | 238 | 130131 | 679.98 | 827 | 834 | 190.1 |
| C | 13 | 61 | 5816 | 26.2 | 827 | 834 | 190.1 |
| C | 7 | 220 | 4090 | 17.12 | 827 | 834 | 190.1 |
| D | 1 | 52 | 193718 | 961.36 | 836 | 812 | 200.7 |
| D | 13 | 174 | 94993 | 469.36 | 836 | 812 | 200.7 |
| D | 12 | 235 | 43728 | 213.88 | 836 | 812 | 200.7 |
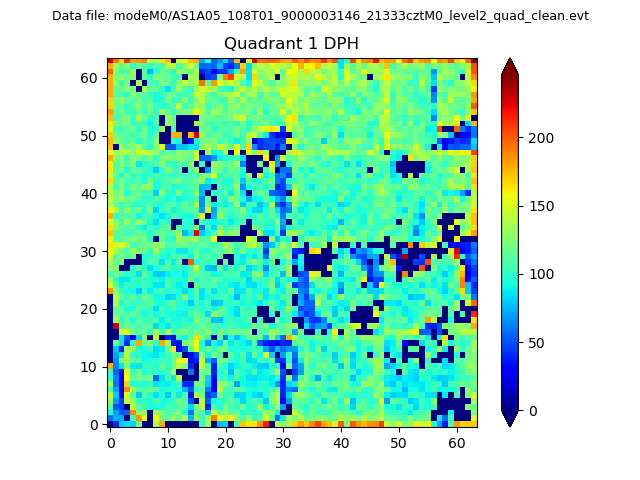
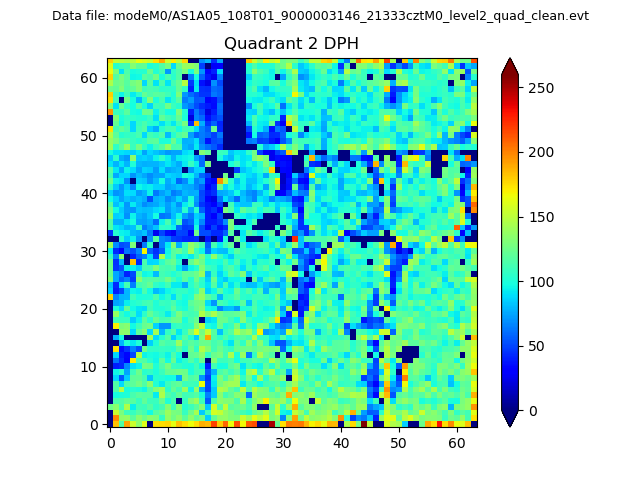
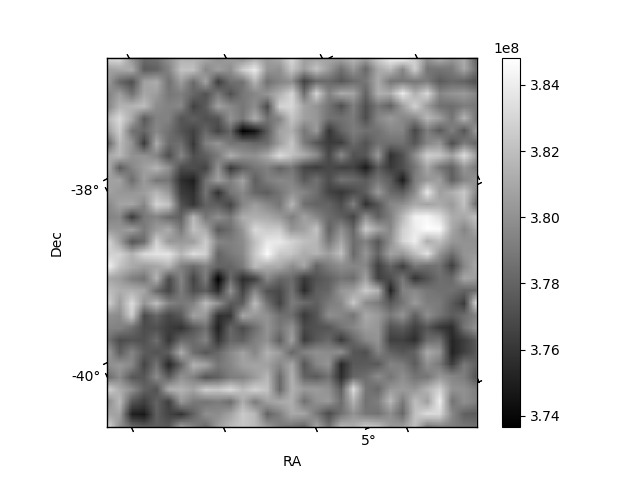
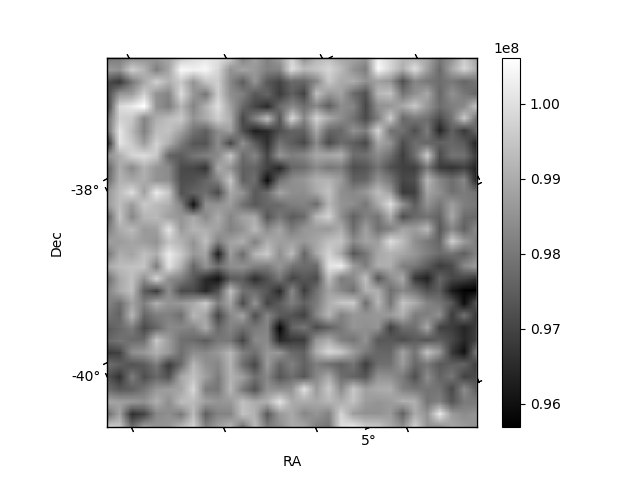
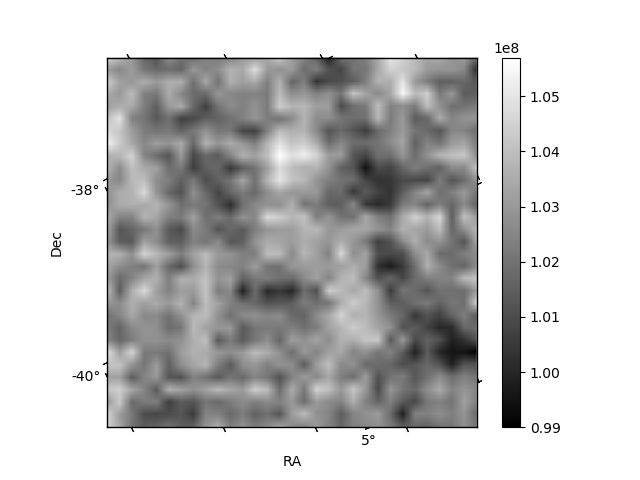
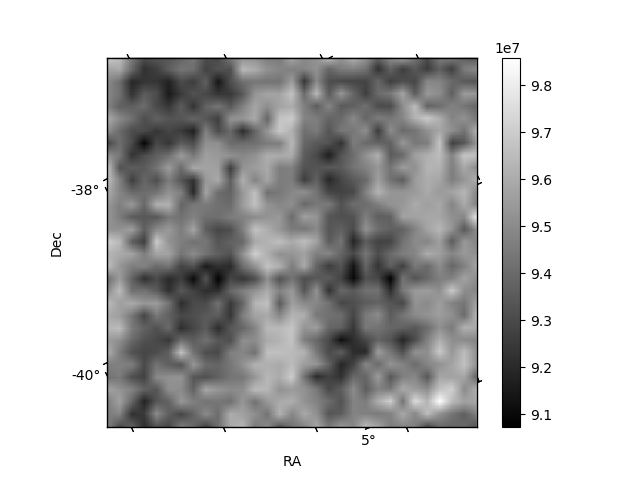
Histogram calculated using DETX and DETY for each event in the final _common_clean file
| Quadrant A | 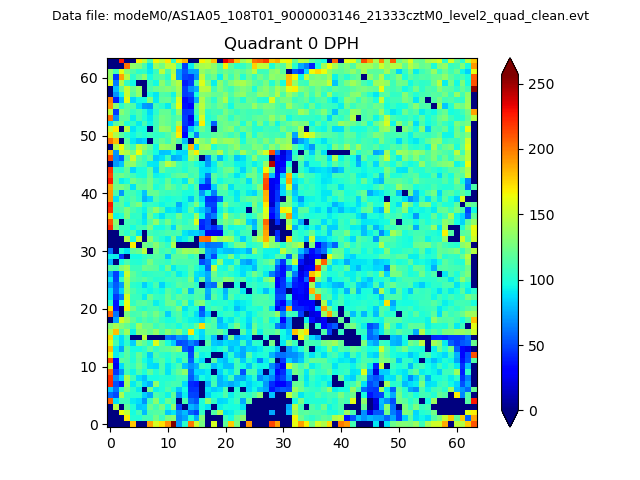 |
 |
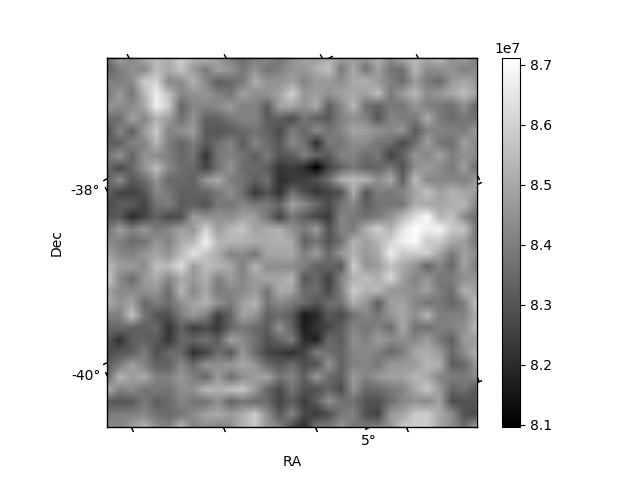
Quadrant B |
|---|---|---|---|
| Quadrant D | 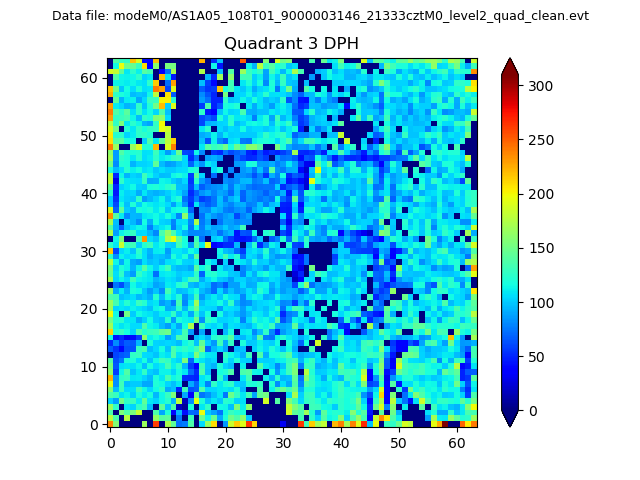 |
 |
Quadrant C |
| Plot type | Count rate plots | Images |
|---|---|---|
| Comparison with Poisson distribution Blue bars denote a histogram of data divided into 1 sec bins. Red curve is a Poisson curve with rate = median count rate of data. |
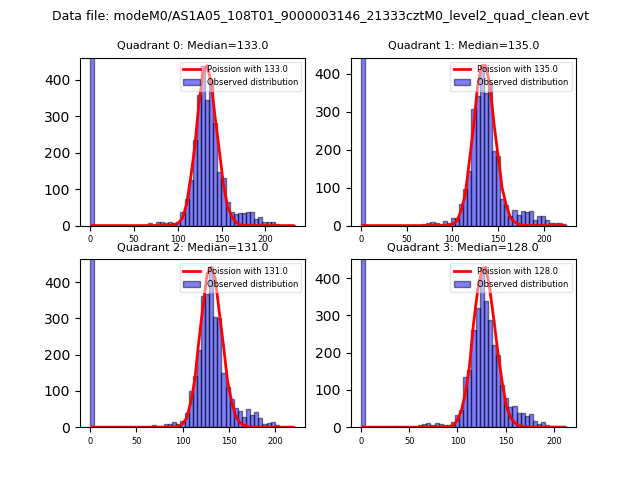 |
 |
| Quadrant-wise count rates Data is divided into 100 sec bins |
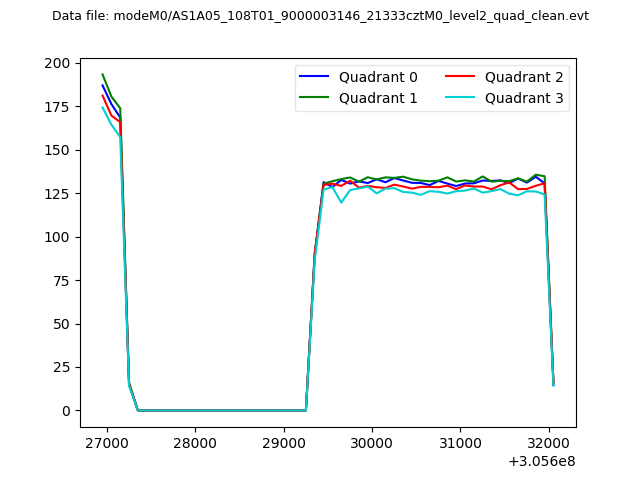 |
|
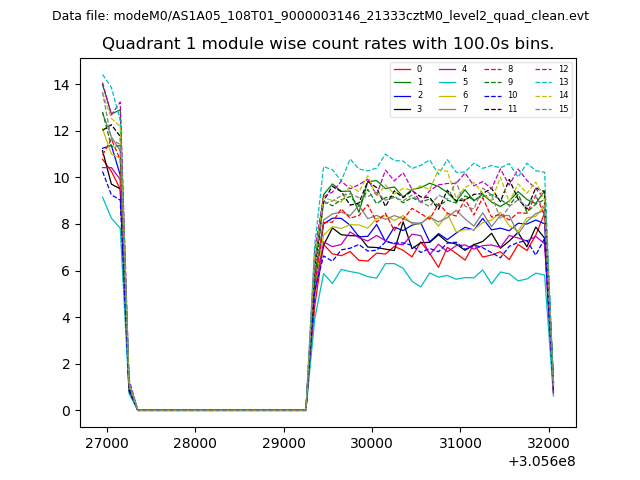
| Module-wise count rates for Quadrant A Data is divided into 100 sec bins |
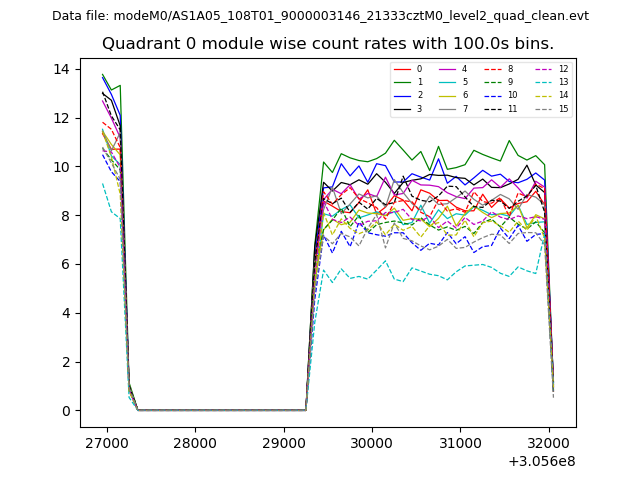 |
 |
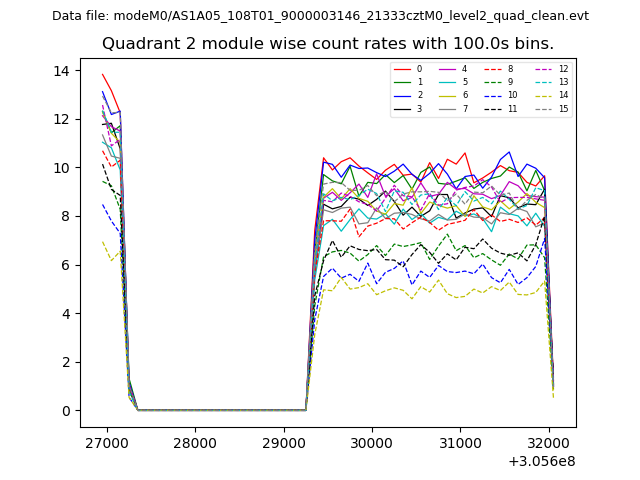
| Module-wise count rates for Quadrant B Data is divided into 100 sec bins |
 |
 |
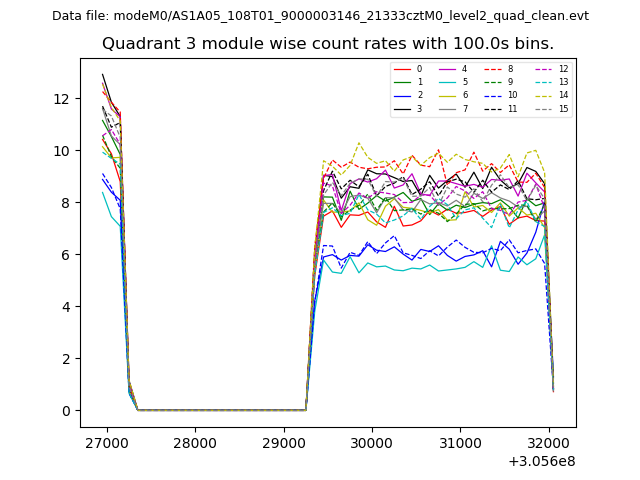
| Module-wise count rates for Quadrant C Data is divided into 100 sec bins |
 |
 |
| Module-wise count rates for Quadrant D Data is divided into 100 sec bins |
 |
 |
| Parameter | Plot |
|---|---|
| CZT HV Monitor | 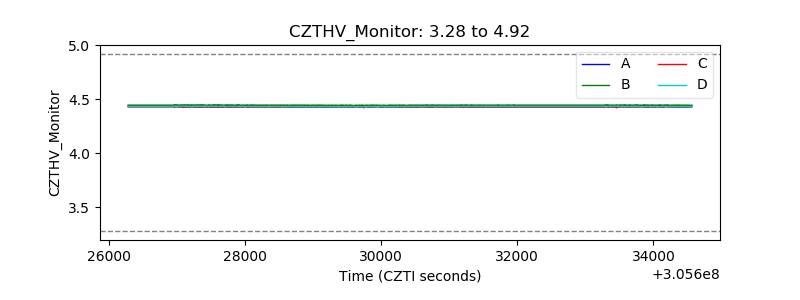 |
| D_VDD | 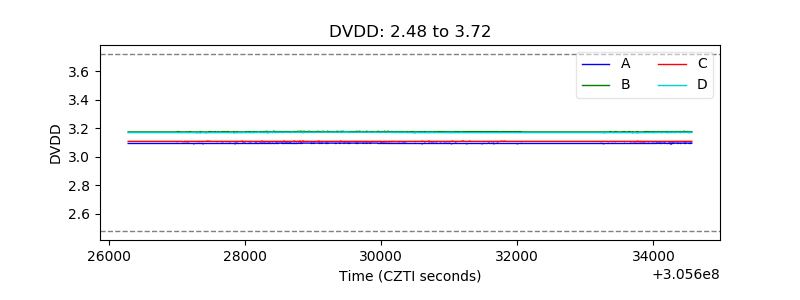 |
| Temperature 1 | 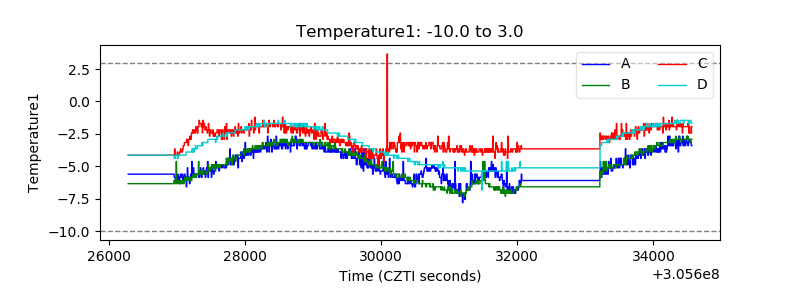 |
| Veto HV Monitor |  |
| Veto LLD | 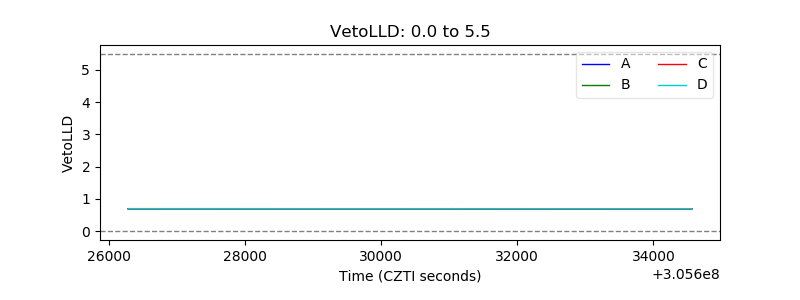 |
| Alpha Counter | 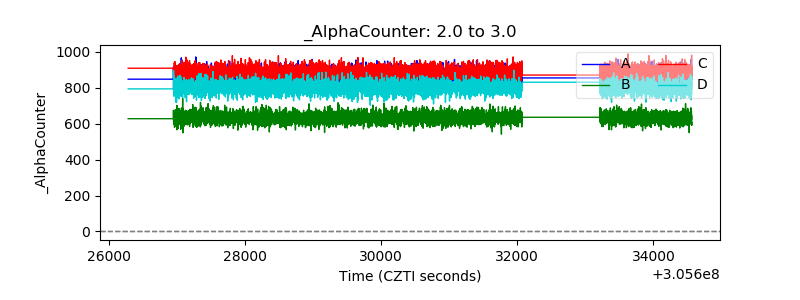 |
| _CPM_Rate | 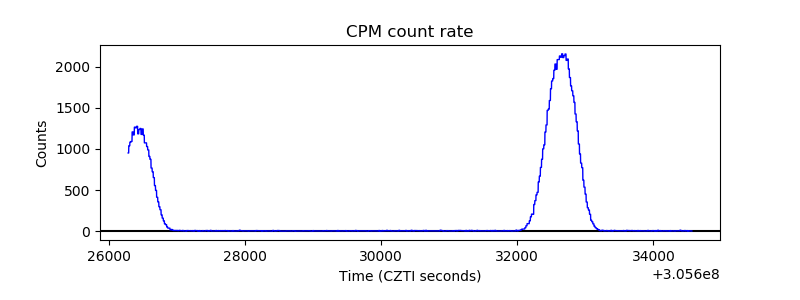 |
| CZT Counter | 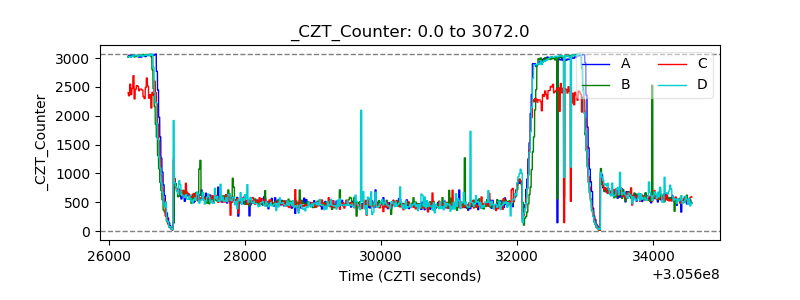 |
| +2.5 Volts monitor |  |
| +5 Volts monitor |  |
| _ROLL_ROT | 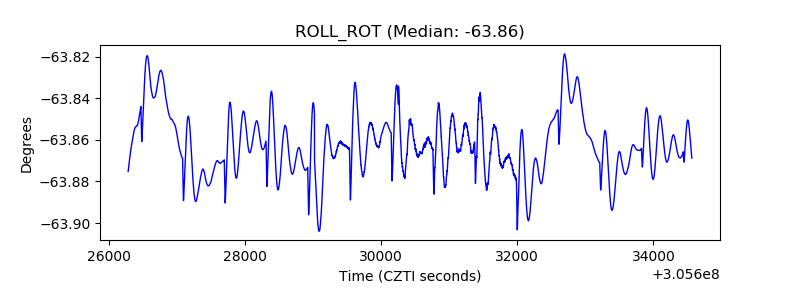 |
| _Roll_DEC | 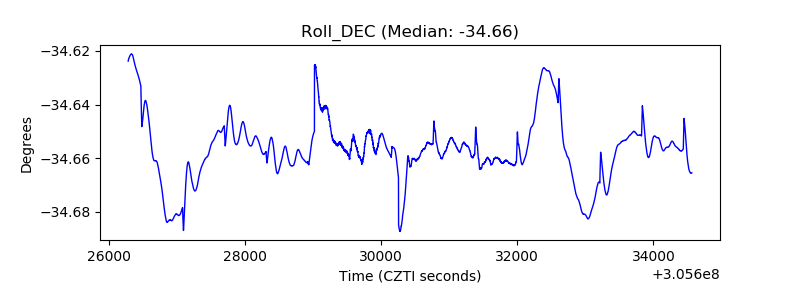 |
| _Roll_RA | 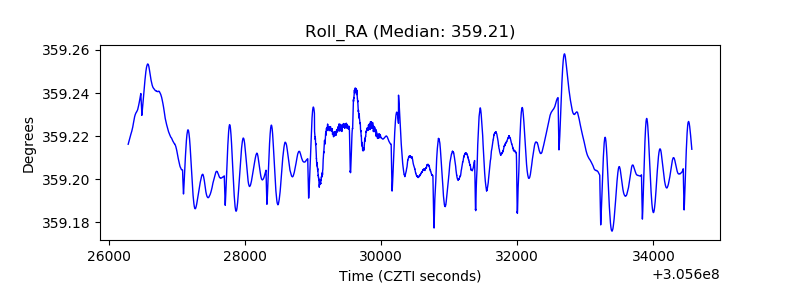 |
| Veto Counter | 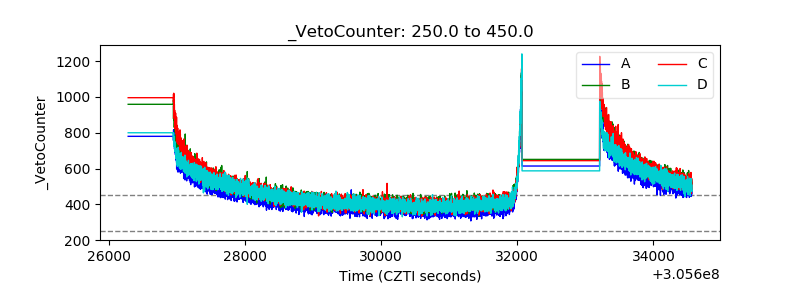 |