| Param | Original file | Final file |
|---|---|---|
| Filename | modeM0/AS1A05_108T01_9000003146_21335cztM0_level2.evt | modeM0/AS1A05_108T01_9000003146_21335cztM0_level2_quad_clean.evt |
| Size (bytes) | 503,231,040 | 86,748,480 |
| Size | 479.9 MB | 82.7 MB |
| Events in quadrant A | 3,667,225 | 553,133 |
| Events in quadrant B | 3,748,003 | 562,665 |
| Events in quadrant C | 3,639,495 | 530,002 |
| Events in quadrant D | 3,739,784 | 523,090 |
| Mode M0 | |||
|---|---|---|---|
| Quadrant | BADHDUFLAG | Total packets | Discarded packets |
| A | 0 | 15186 | 2 |
| B | 0 | 15494 | 2 |
| C | 0 | 15090 | 2 |
| D | 0 | 15539 | 2 |
| Mode M9 | |||
|---|---|---|---|
| Quadrant | BADHDUFLAG | Total packets | Discarded packets |
| A | 0 | 18 | 0 |
| B | 0 | 19 | 0 |
| C | 0 | 19 | 0 |
| D | 0 | 19 | 0 |
| Mode SS | |||
|---|---|---|---|
| Quadrant | BADHDUFLAG | Total packets | Discarded packets |
| A | 0 | 134 | 0 |
| B | 0 | 134 | 0 |
| C | 0 | 134 | 0 |
| D | 0 | 134 | 0 |
| Quadrant | Total seconds | Saturated seconds | Saturation percentage |
|---|---|---|---|
| A | 6568 | 116 | 1.766139% |
| B | 6568 | 127 | 1.933618% |
| C | 6568 | 185 | 2.816687% |
| D | 6568 | 135 | 2.055420% |
Noise dominated data is calculated using 1-second bins in cleaned event files. If a bin has >2000 counts, and if more than 50% of those come from <1% of pixels, then it is considered to be noise-dominated and hence unusable.
| Quadrant | # 1 sec bins | Bins with >0 counts | Bins with >2000 counts | High rate bins dominated by noise | Noise dominated (total time) | Noise dominated (detector-on time) | Marked lightcurve |
|---|---|---|---|---|---|---|---|
| A | 7878 | 6568 | 3 | 3 | 0.04% | 0.05% | 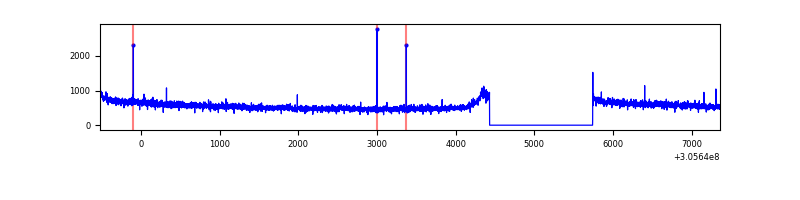 |
| B | 7878 | 6568 | 5 | 5 | 0.06% | 0.08% | 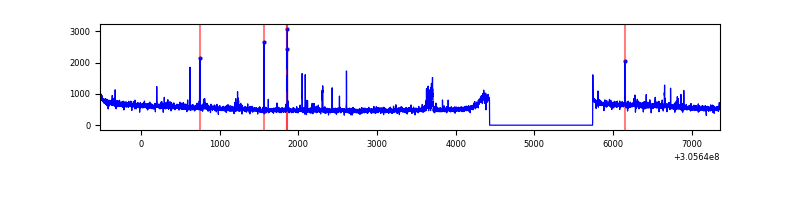 |
| C | 7878 | 6568 | 23 | 23 | 0.29% | 0.35% |  |
| D | 7878 | 6568 | 16 | 16 | 0.20% | 0.24% | 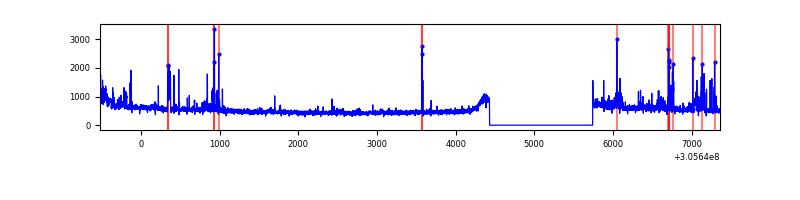 |
Top three noisy pixels from each quadrant. If the there are fewer than three noisy pixels in the level2.evt file, extra rows are filled as -1
| Pixel properties | Quadrant properties | ||||||
|---|---|---|---|---|---|---|---|
| Quadrant | DetID | PixID | Counts | Sigma | Mean | Median | Sigma |
| A | 5 | 168 | 75137 | 405.5 | 928 | 913 | 183.0 |
| A | 13 | 254 | 10007 | 49.68 | 928 | 913 | 183.0 |
| A | 0 | 226 | 8133 | 39.44 | 928 | 913 | 183.0 |
| B | 0 | 230 | 57829 | 332.2 | 921 | 903 | 171.4 |
| B | 3 | 64 | 43554 | 248.89 | 921 | 903 | 171.4 |
| B | 12 | 111 | 19674 | 109.54 | 921 | 903 | 171.4 |
| C | 14 | 238 | 142127 | 706.62 | 875 | 884 | 199.9 |
| C | 10 | 23 | 76293 | 377.26 | 875 | 884 | 199.9 |
| C | 13 | 61 | 6081 | 26.0 | 875 | 884 | 199.9 |
| D | 1 | 52 | 171422 | 801.91 | 888 | 865 | 212.7 |
| D | 13 | 174 | 111929 | 522.19 | 888 | 865 | 212.7 |
| D | 13 | 172 | 42460 | 195.57 | 888 | 865 | 212.7 |
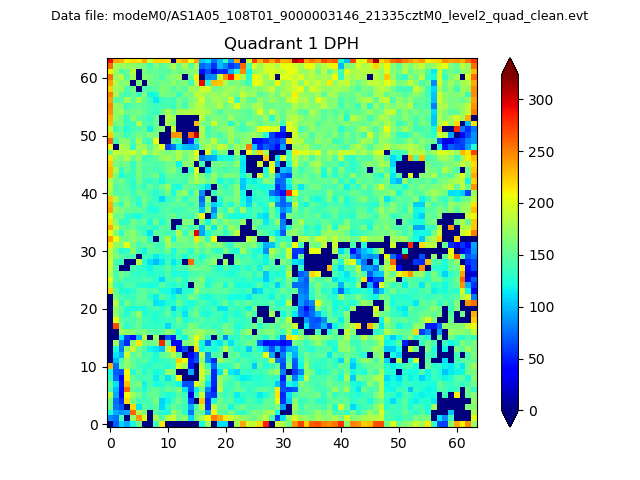
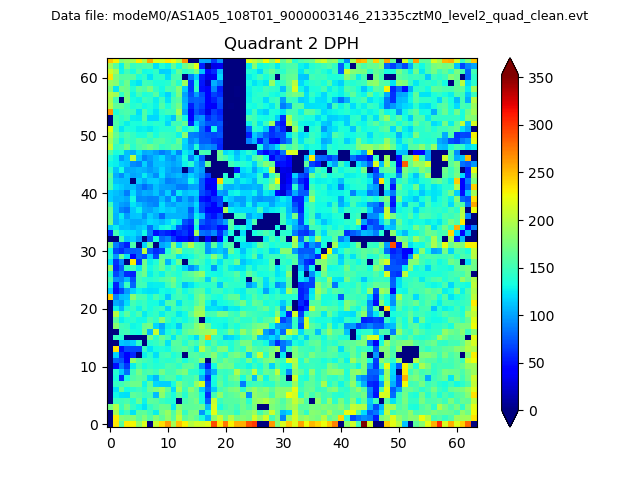
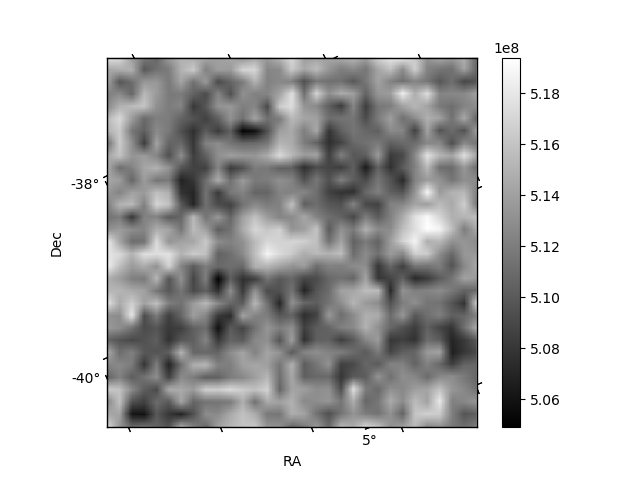
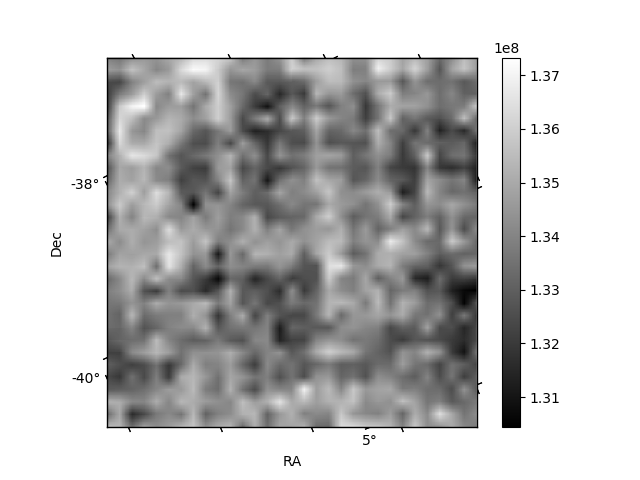
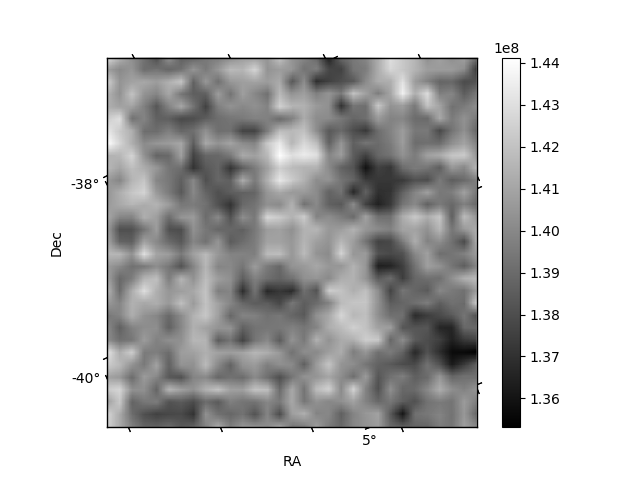
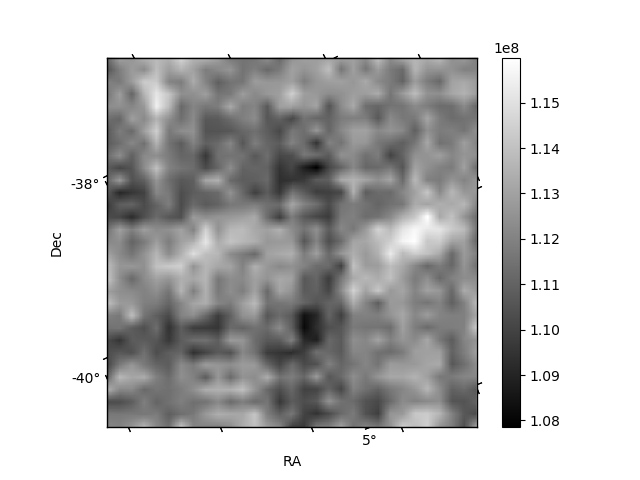
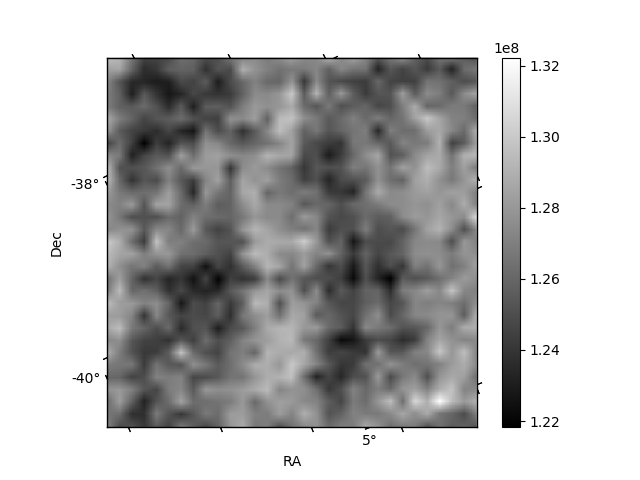
Histogram calculated using DETX and DETY for each event in the final _common_clean file
| Quadrant A | 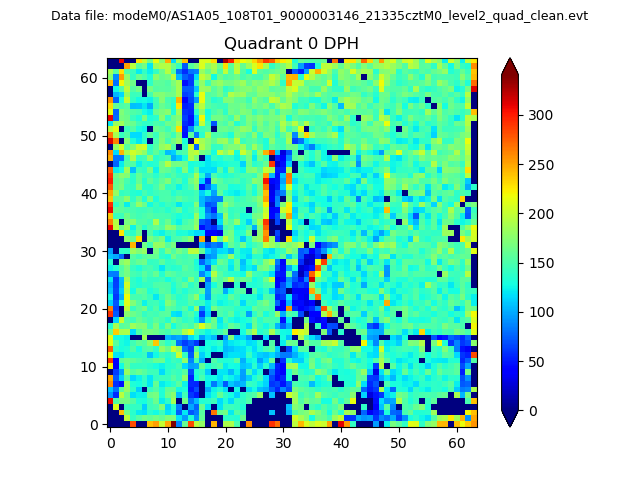 |
 |
Quadrant B |
|---|---|---|---|
| Quadrant D | 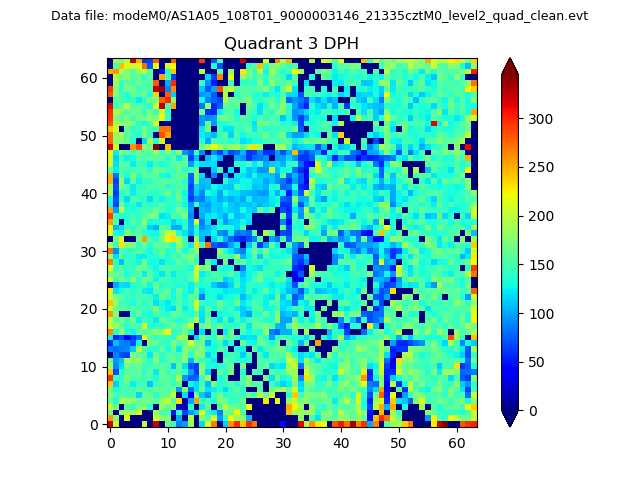 |
 |
Quadrant C |
| Plot type | Count rate plots | Images |
|---|---|---|
| Comparison with Poisson distribution Blue bars denote a histogram of data divided into 1 sec bins. Red curve is a Poisson curve with rate = median count rate of data. |
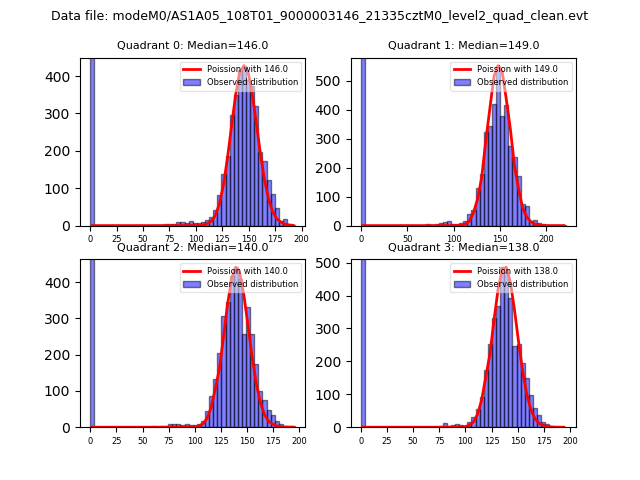 |
 |
| Quadrant-wise count rates Data is divided into 100 sec bins |
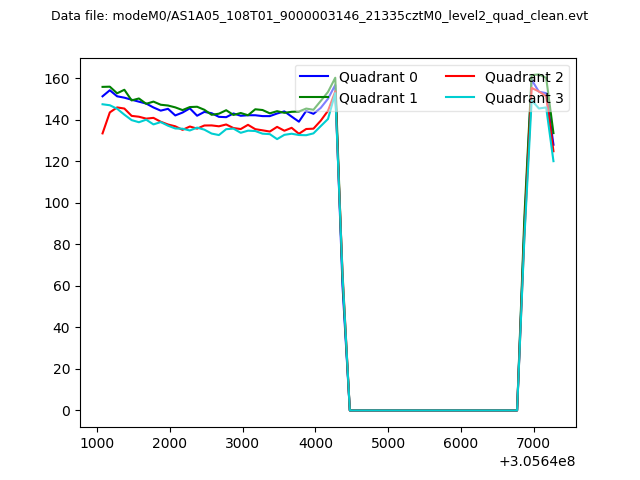 |
|
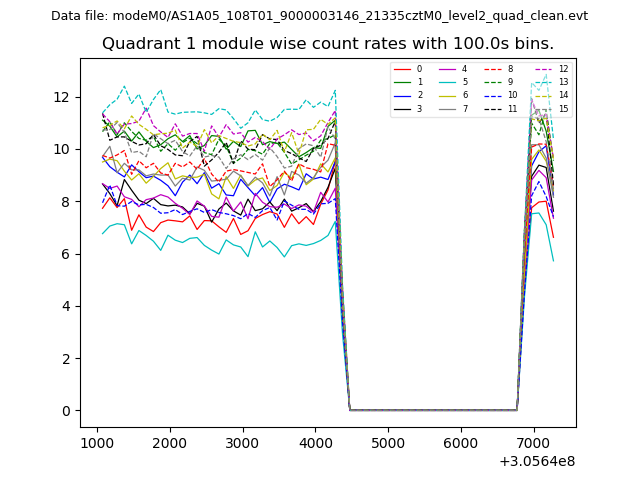
| Module-wise count rates for Quadrant A Data is divided into 100 sec bins |
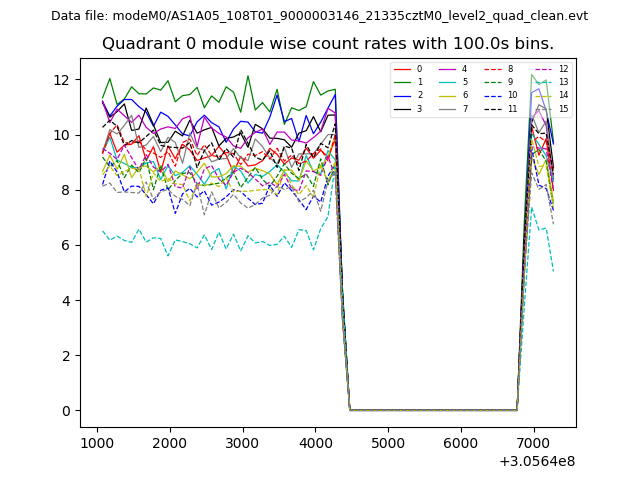 |
 |
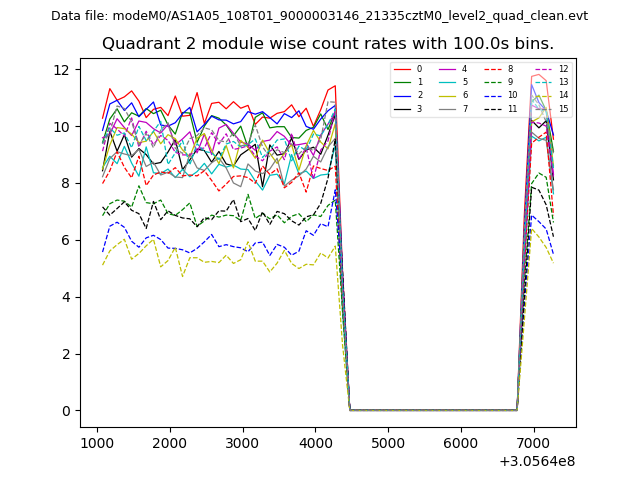
| Module-wise count rates for Quadrant B Data is divided into 100 sec bins |
 |
 |
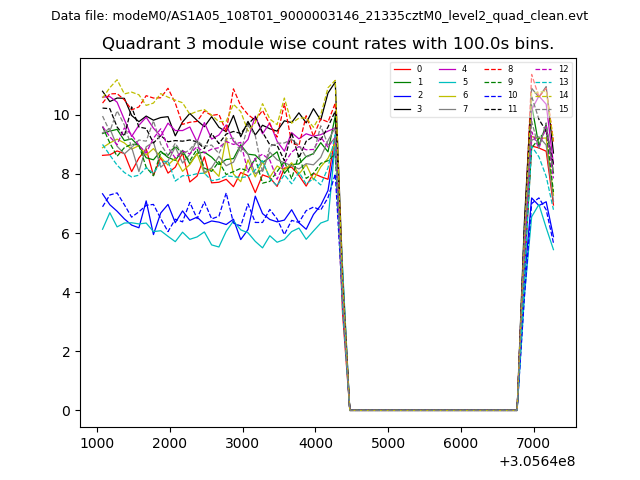
| Module-wise count rates for Quadrant C Data is divided into 100 sec bins |
 |
 |
| Module-wise count rates for Quadrant D Data is divided into 100 sec bins |
 |
 |
| Parameter | Plot |
|---|---|
| CZT HV Monitor | 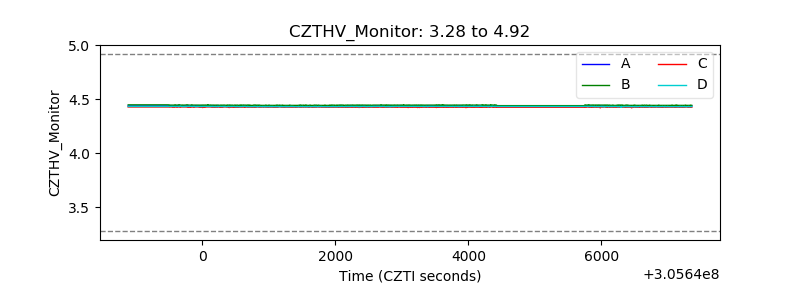 |
| D_VDD | 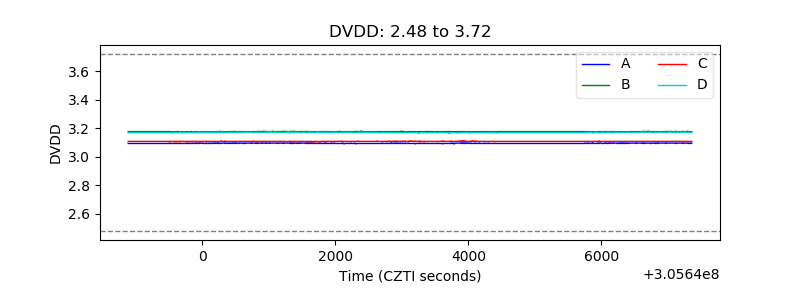 |
| Temperature 1 | 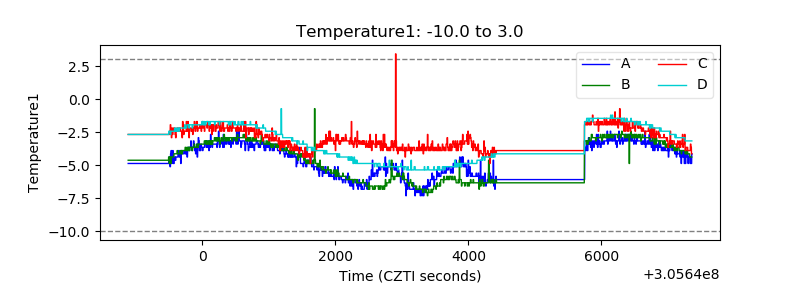 |
| Veto HV Monitor |  |
| Veto LLD | 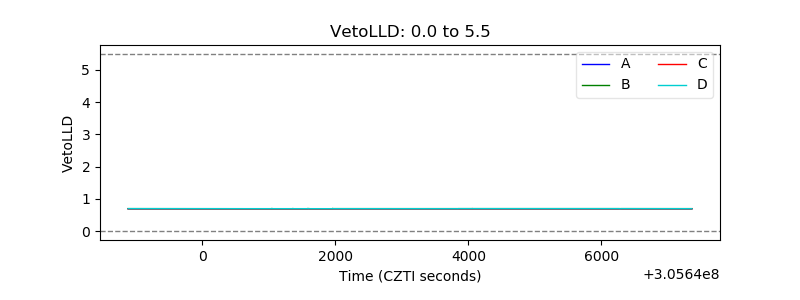 |
| Alpha Counter | 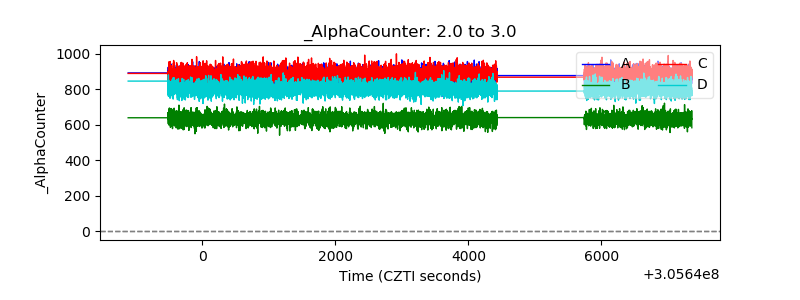 |
| _CPM_Rate | 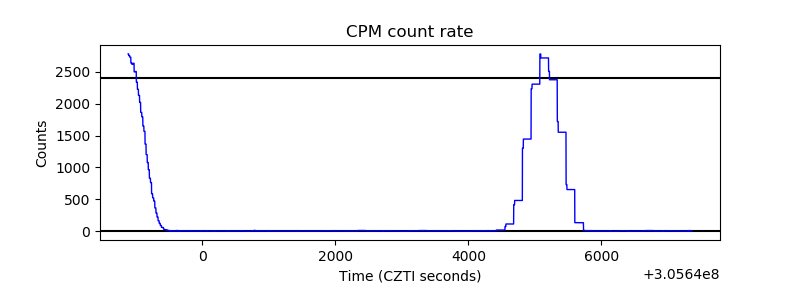 |
| CZT Counter | 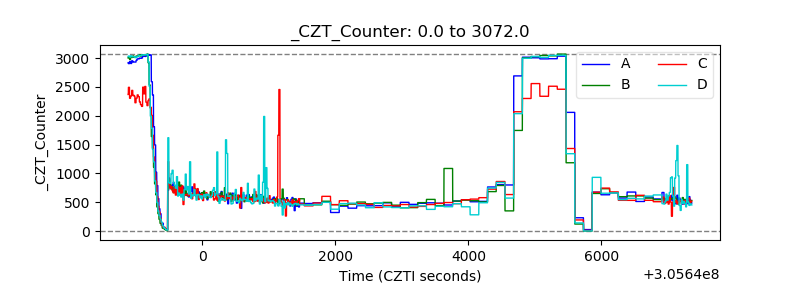 |
| +2.5 Volts monitor |  |
| +5 Volts monitor |  |
| _ROLL_ROT | 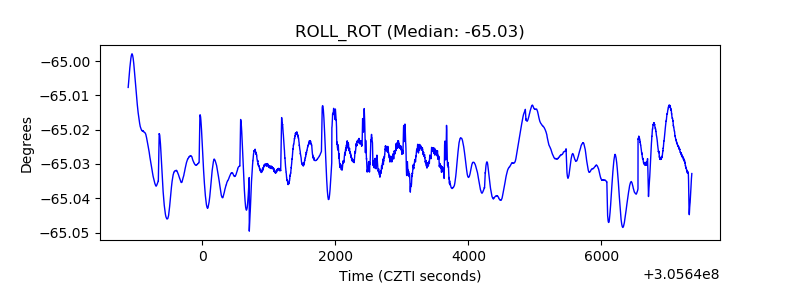 |
| _Roll_DEC | 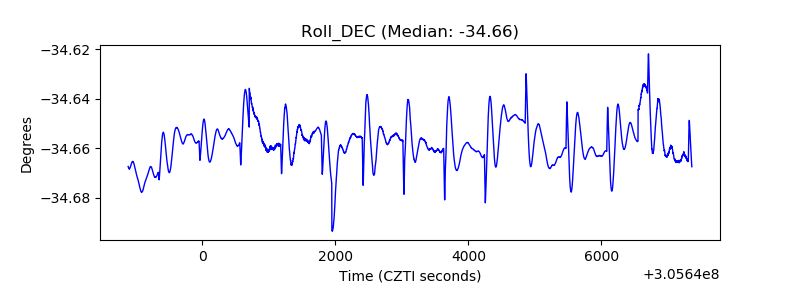 |
| _Roll_RA | 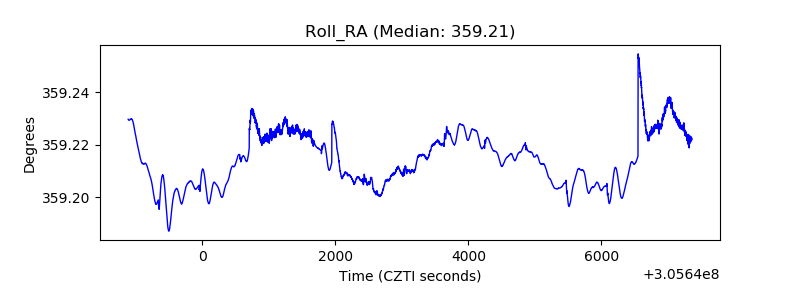 |
| Veto Counter | 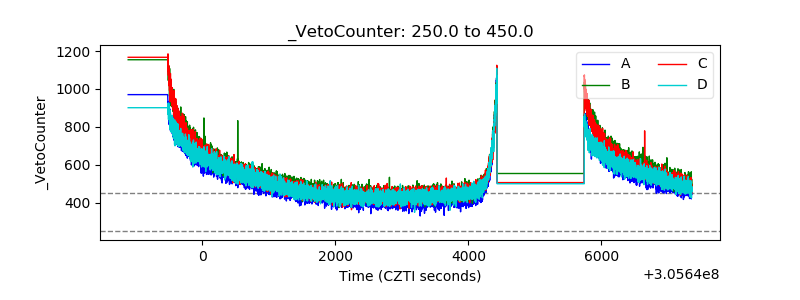 |