| Param | Original file | Final file |
|---|---|---|
| Filename | modeM0/AS1A05_108T01_9000003146_21336cztM0_level2.evt | modeM0/AS1A05_108T01_9000003146_21336cztM0_level2_quad_clean.evt |
| Size (bytes) | 494,830,080 | 102,162,240 |
| Size | 471.9 MB | 97.4 MB |
| Events in quadrant A | 3,625,908 | 670,795 |
| Events in quadrant B | 3,708,684 | 686,940 |
| Events in quadrant C | 3,483,887 | 644,544 |
| Events in quadrant D | 3,719,309 | 631,505 |
| Mode M0 | |||
|---|---|---|---|
| Quadrant | BADHDUFLAG | Total packets | Discarded packets |
| A | 0 | 14991 | 2 |
| B | 0 | 15302 | 2 |
| C | 0 | 14565 | 2 |
| D | 0 | 15427 | 2 |
| Mode M9 | |||
|---|---|---|---|
| Quadrant | BADHDUFLAG | Total packets | Discarded packets |
| A | 0 | 24 | 0 |
| B | 0 | 25 | 0 |
| C | 0 | 25 | 0 |
| D | 0 | 25 | 0 |
| Mode SS | |||
|---|---|---|---|
| Quadrant | BADHDUFLAG | Total packets | Discarded packets |
| A | 0 | 134 | 0 |
| B | 0 | 134 | 0 |
| C | 0 | 134 | 0 |
| D | 0 | 134 | 0 |
| Quadrant | Total seconds | Saturated seconds | Saturation percentage |
|---|---|---|---|
| A | 6601 | 133 | 2.014846% |
| B | 6600 | 144 | 2.181818% |
| C | 6600 | 156 | 2.363636% |
| D | 6600 | 133 | 2.015152% |
Noise dominated data is calculated using 1-second bins in cleaned event files. If a bin has >2000 counts, and if more than 50% of those come from <1% of pixels, then it is considered to be noise-dominated and hence unusable.
| Quadrant | # 1 sec bins | Bins with >0 counts | Bins with >2000 counts | High rate bins dominated by noise | Noise dominated (total time) | Noise dominated (detector-on time) | Marked lightcurve |
|---|---|---|---|---|---|---|---|
| A | 7891 | 6601 | 3 | 3 | 0.04% | 0.05% | 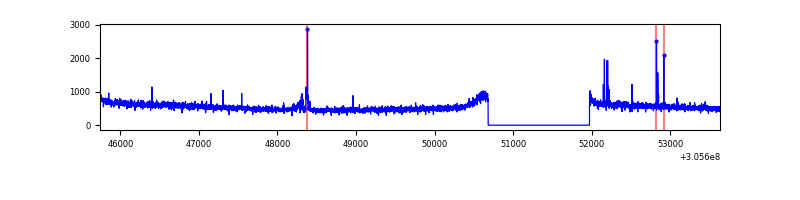 |
| B | 7890 | 6600 | 11 | 11 | 0.14% | 0.17% | 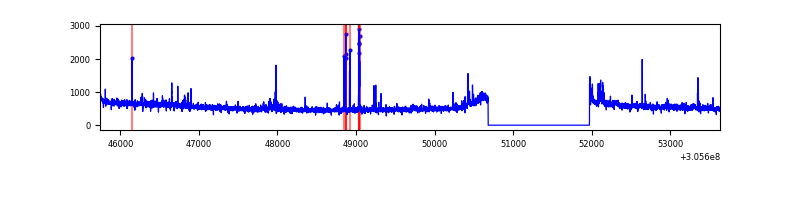 |
| C | 7890 | 6600 | 0 | 0 | 0.00% | 0.00% |  |
| D | 7890 | 6600 | 38 | 38 | 0.48% | 0.58% | 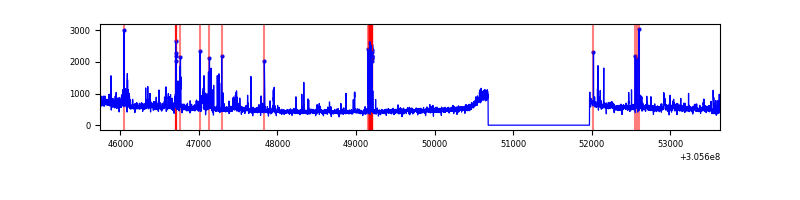 |
Top three noisy pixels from each quadrant. If the there are fewer than three noisy pixels in the level2.evt file, extra rows are filled as -1
| Pixel properties | Quadrant properties | ||||||
|---|---|---|---|---|---|---|---|
| Quadrant | DetID | PixID | Counts | Sigma | Mean | Median | Sigma |
| A | 5 | 168 | 68284 | 377.29 | 907 | 893 | 178.6 |
| A | 15 | 174 | 34760 | 189.61 | 907 | 893 | 178.6 |
| A | 15 | 236 | 16682 | 88.4 | 907 | 893 | 178.6 |
| B | 3 | 64 | 68434 | 401.2 | 903 | 883 | 168.4 |
| B | 0 | 244 | 56246 | 328.82 | 903 | 883 | 168.4 |
| B | 0 | 230 | 26967 | 154.92 | 903 | 883 | 168.4 |
| C | 14 | 238 | 138795 | 699.95 | 856 | 863 | 197.1 |
| C | 13 | 61 | 6036 | 26.25 | 856 | 863 | 197.1 |
| C | 8 | 49 | 3782 | 14.81 | 856 | 863 | 197.1 |
| D | 1 | 52 | 194324 | 937.82 | 863 | 842 | 206.3 |
| D | 13 | 153 | 108898 | 523.75 | 863 | 842 | 206.3 |
| D | 13 | 174 | 84276 | 404.41 | 863 | 842 | 206.3 |
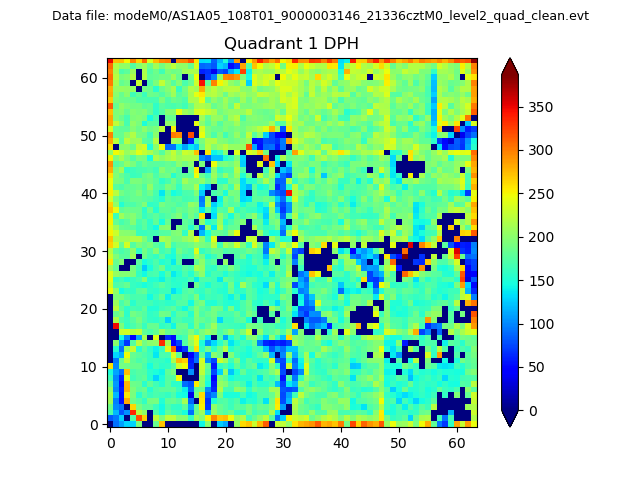
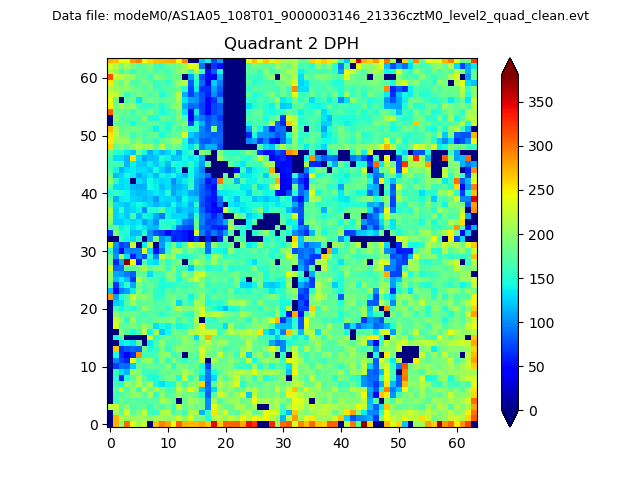
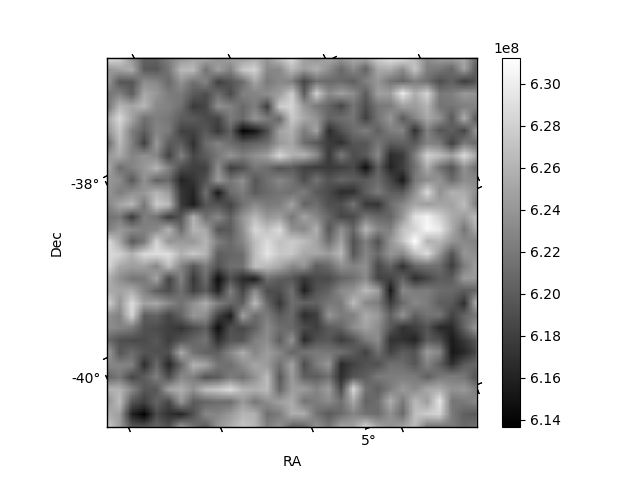
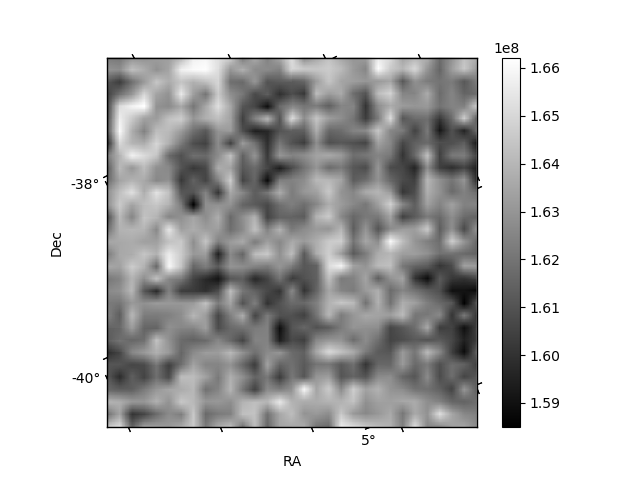
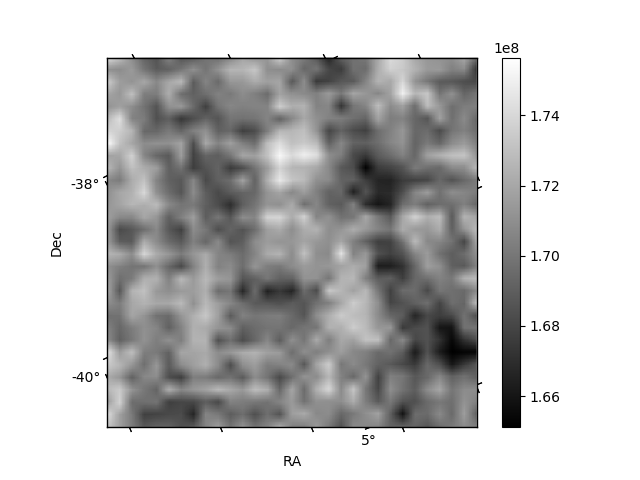
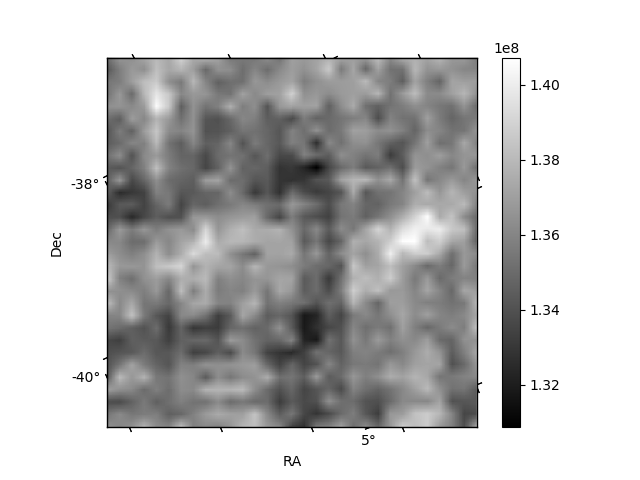
Histogram calculated using DETX and DETY for each event in the final _common_clean file
| Quadrant A | 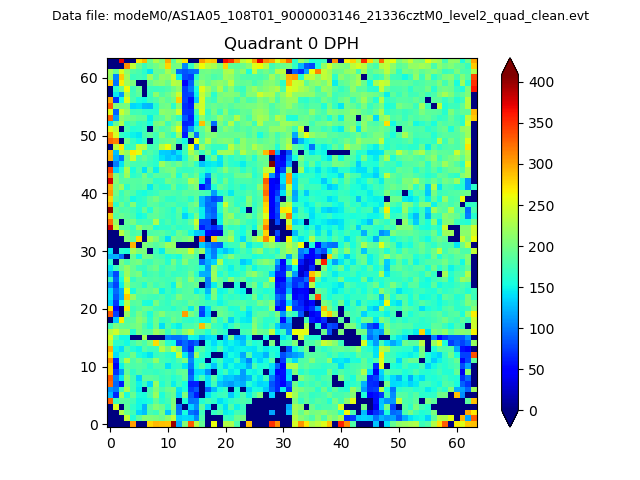 |
 |
Quadrant B |
|---|---|---|---|
| Quadrant D | 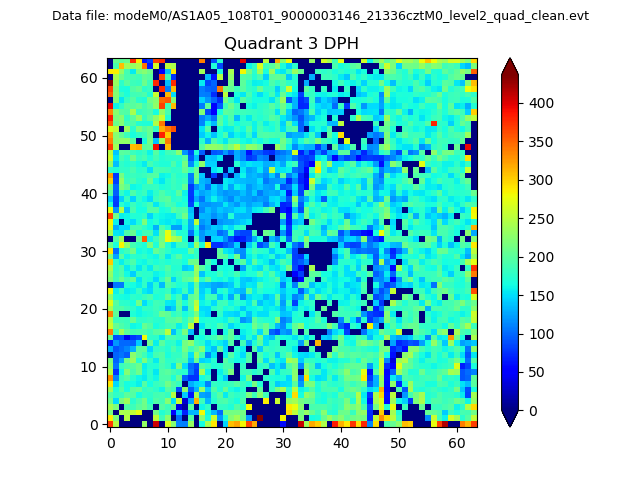 |
 |
Quadrant C |
| Plot type | Count rate plots | Images |
|---|---|---|
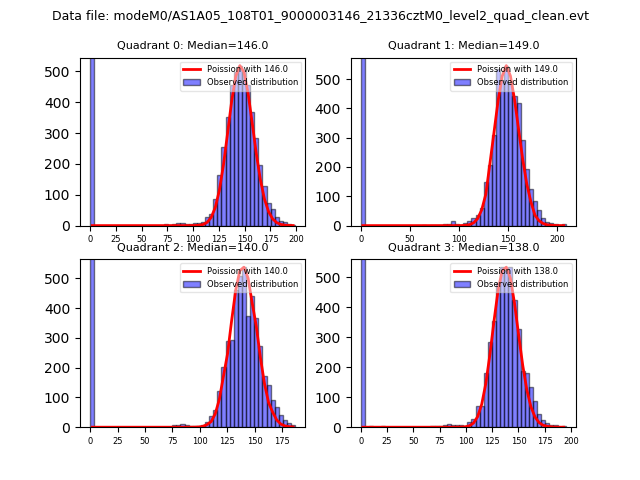
| Comparison with Poisson distribution Blue bars denote a histogram of data divided into 1 sec bins. Red curve is a Poisson curve with rate = median count rate of data. |
 |
 |
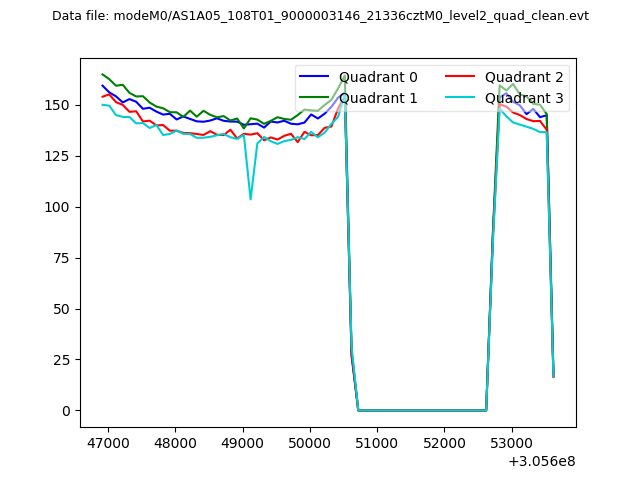
| Quadrant-wise count rates Data is divided into 100 sec bins |
 |
|
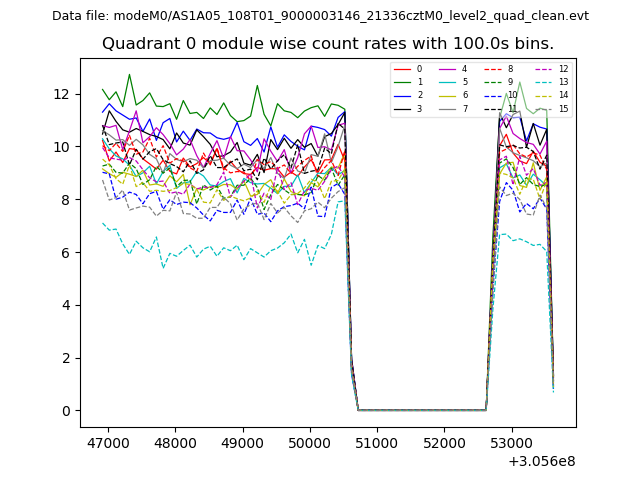
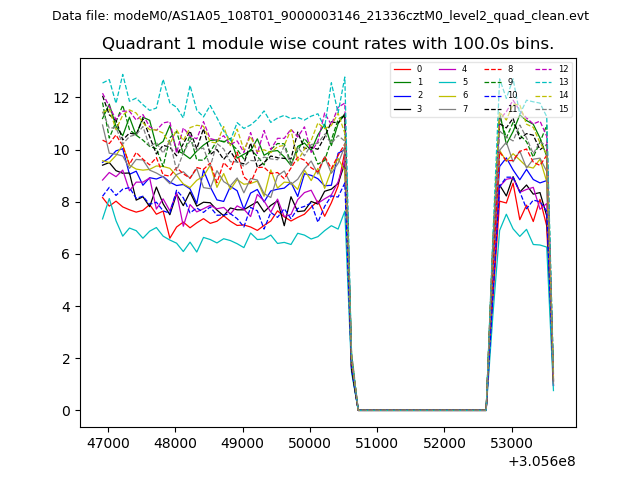
| Module-wise count rates for Quadrant A Data is divided into 100 sec bins |
 |
 |
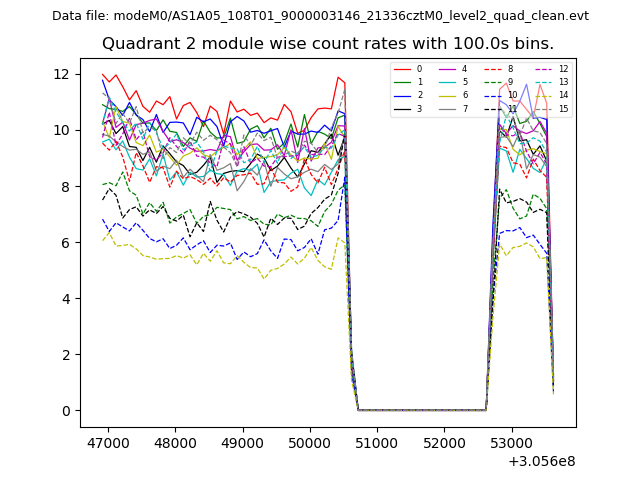
| Module-wise count rates for Quadrant B Data is divided into 100 sec bins |
 |
 |
| Module-wise count rates for Quadrant C Data is divided into 100 sec bins |
 |
 |
| Module-wise count rates for Quadrant D Data is divided into 100 sec bins |
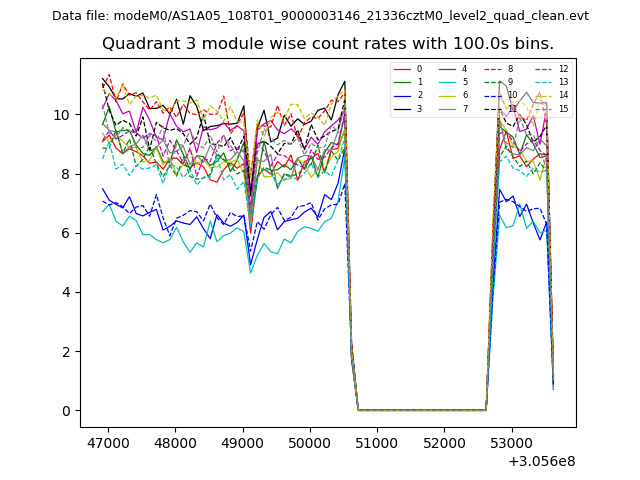 |
 |
| Parameter | Plot |
|---|---|
| CZT HV Monitor | 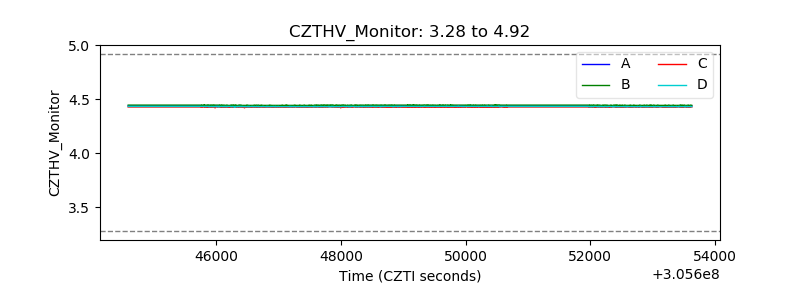 |
| D_VDD | 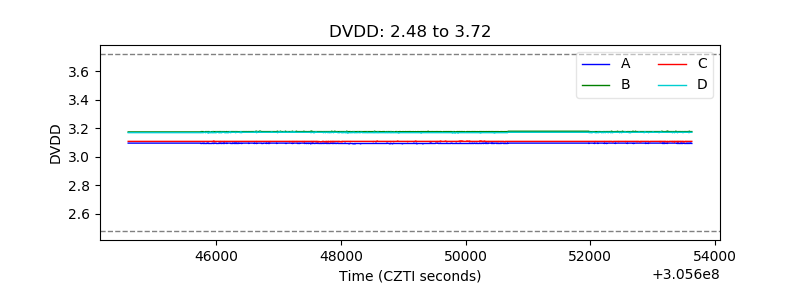 |
| Temperature 1 | 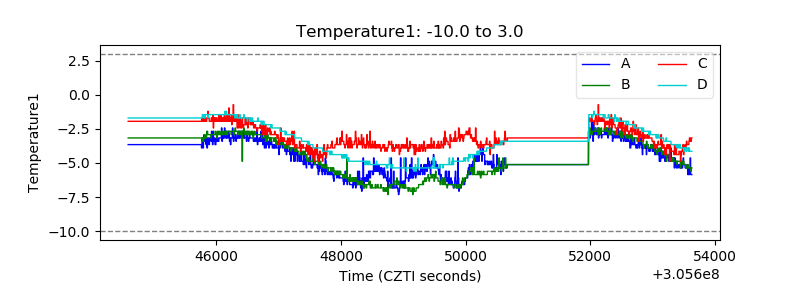 |
| Veto HV Monitor |  |
| Veto LLD | 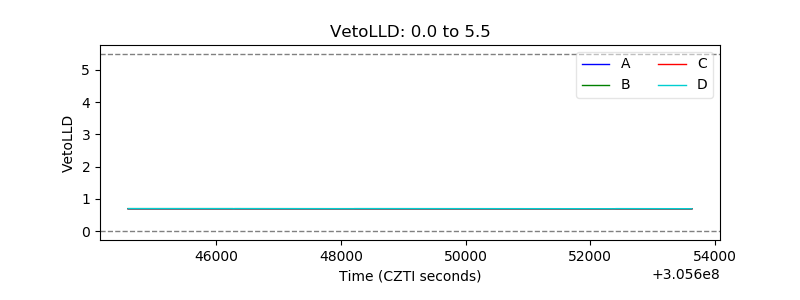 |
| Alpha Counter | 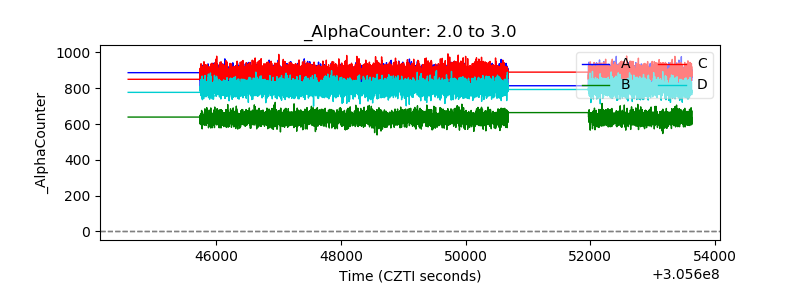 |
| _CPM_Rate | 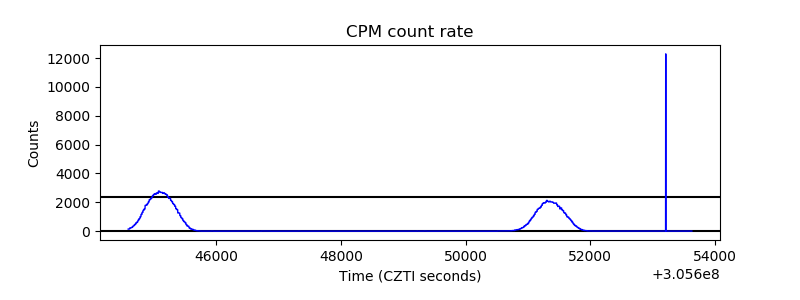 |
| CZT Counter | 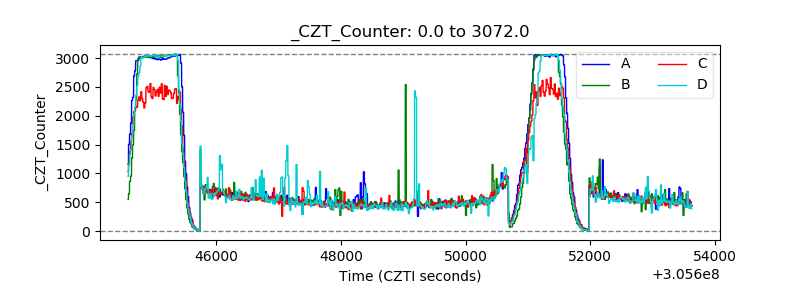 |
| +2.5 Volts monitor |  |
| +5 Volts monitor |  |
| _ROLL_ROT | 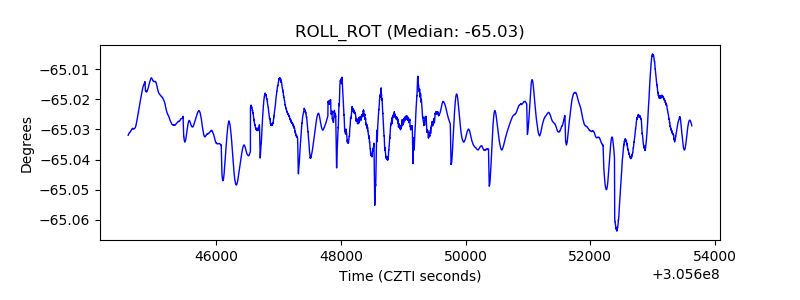 |
| _Roll_DEC | 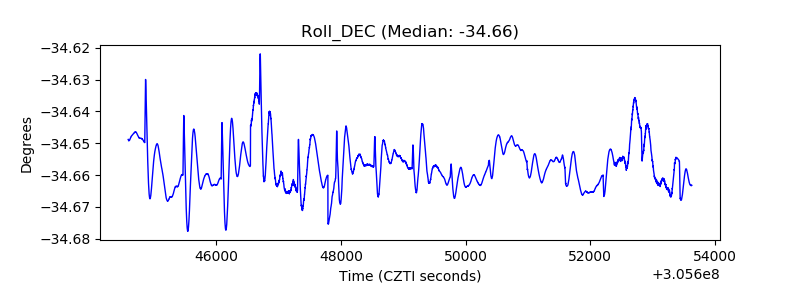 |
| _Roll_RA | 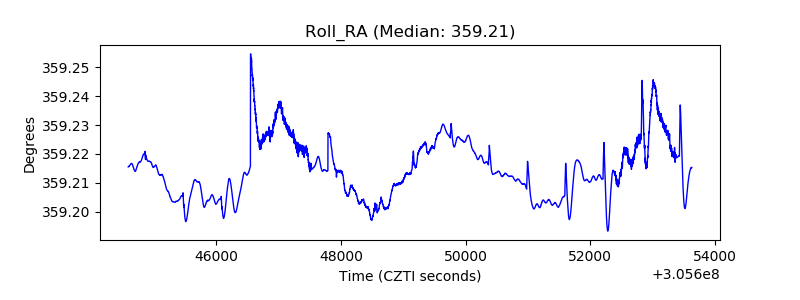 |
| Veto Counter | 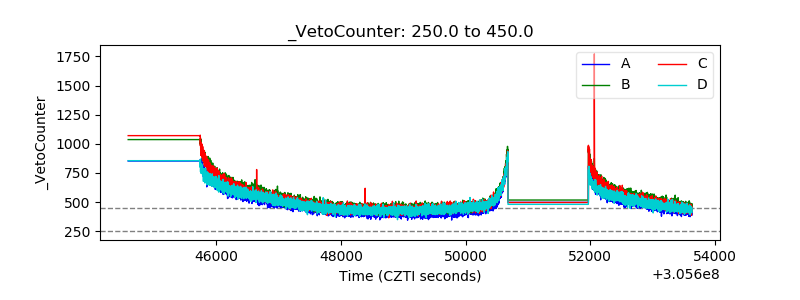 |