| Param | Original file | Final file |
|---|---|---|
| Filename | modeM0/AS1A05_108T01_9000003146_21337cztM0_level2.evt | modeM0/AS1A05_108T01_9000003146_21337cztM0_level2_quad_clean.evt |
| Size (bytes) | 528,920,640 | 111,709,440 |
| Size | 504.4 MB | 106.5 MB |
| Events in quadrant A | 4,102,659 | 734,417 |
| Events in quadrant B | 3,786,370 | 754,848 |
| Events in quadrant C | 3,584,937 | 709,770 |
| Events in quadrant D | 4,067,761 | 695,140 |
| Mode M0 | |||
|---|---|---|---|
| Quadrant | BADHDUFLAG | Total packets | Discarded packets |
| A | 0 | 16633 | 2 |
| B | 0 | 15733 | 2 |
| C | 0 | 15119 | 3 |
| D | 0 | 16787 | 2 |
| Mode M9 | |||
|---|---|---|---|
| Quadrant | BADHDUFLAG | Total packets | Discarded packets |
| A | 0 | 25 | 0 |
| B | 0 | 25 | 0 |
| C | 0 | 25 | 0 |
| D | 0 | 25 | 0 |
| Mode SS | |||
|---|---|---|---|
| Quadrant | BADHDUFLAG | Total packets | Discarded packets |
| A | 0 | 144 | 0 |
| B | 0 | 144 | 0 |
| C | 0 | 144 | 0 |
| D | 0 | 144 | 0 |
| Quadrant | Total seconds | Saturated seconds | Saturation percentage |
|---|---|---|---|
| A | 7024 | 338 | 4.812073% |
| B | 7025 | 229 | 3.259786% |
| C | 7024 | 220 | 3.132118% |
| D | 7024 | 249 | 3.544989% |
Noise dominated data is calculated using 1-second bins in cleaned event files. If a bin has >2000 counts, and if more than 50% of those come from <1% of pixels, then it is considered to be noise-dominated and hence unusable.
| Quadrant | # 1 sec bins | Bins with >0 counts | Bins with >2000 counts | High rate bins dominated by noise | Noise dominated (total time) | Noise dominated (detector-on time) | Marked lightcurve |
|---|---|---|---|---|---|---|---|
| A | 9514 | 7025 | 62 | 62 | 0.65% | 0.88% | 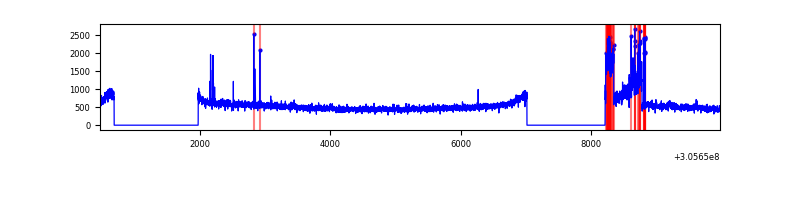 |
| B | 9515 | 7025 | 21 | 21 | 0.22% | 0.30% | 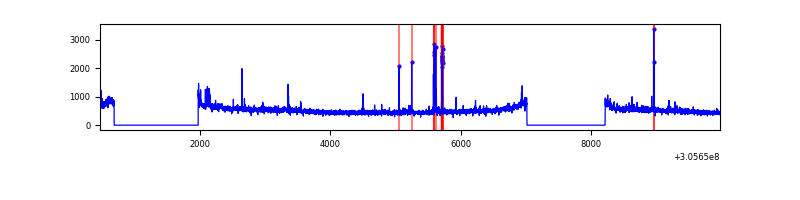 |
| C | 9514 | 7024 | 0 | 0 | 0.00% | 0.00% | 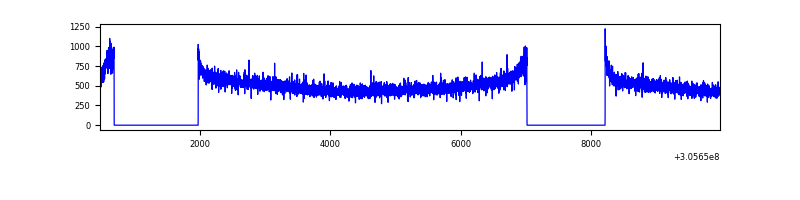 |
| D | 9514 | 7025 | 87 | 87 | 0.91% | 1.24% | 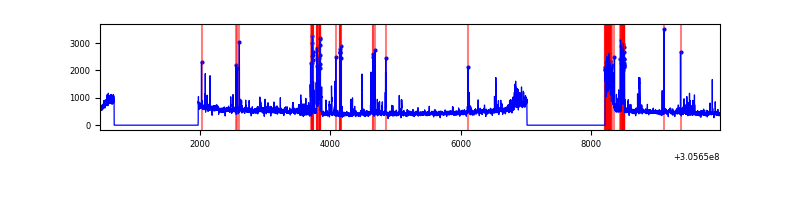 |
Top three noisy pixels from each quadrant. If the there are fewer than three noisy pixels in the level2.evt file, extra rows are filled as -1
| Pixel properties | Quadrant properties | ||||||
|---|---|---|---|---|---|---|---|
| Quadrant | DetID | PixID | Counts | Sigma | Mean | Median | Sigma |
| A | 15 | 236 | 418391 | 2277.7 | 923 | 907 | 183.3 |
| A | 5 | 168 | 112482 | 608.73 | 923 | 907 | 183.3 |
| A | 13 | 254 | 11193 | 56.12 | 923 | 907 | 183.3 |
| B | 3 | 64 | 80854 | 458.1 | 926 | 905 | 174.5 |
| B | 0 | 244 | 25458 | 140.69 | 926 | 905 | 174.5 |
| B | 0 | 230 | 23632 | 130.22 | 926 | 905 | 174.5 |
| C | 14 | 238 | 141619 | 689.02 | 882 | 887 | 204.2 |
| C | 13 | 61 | 6251 | 26.26 | 882 | 887 | 204.2 |
| C | 0 | 10 | 5076 | 20.51 | 882 | 887 | 204.2 |
| D | 1 | 52 | 393779 | 1838.63 | 886 | 861 | 213.7 |
| D | 13 | 174 | 209734 | 977.41 | 886 | 861 | 213.7 |
| D | 1 | 20 | 39744 | 181.95 | 886 | 861 | 213.7 |
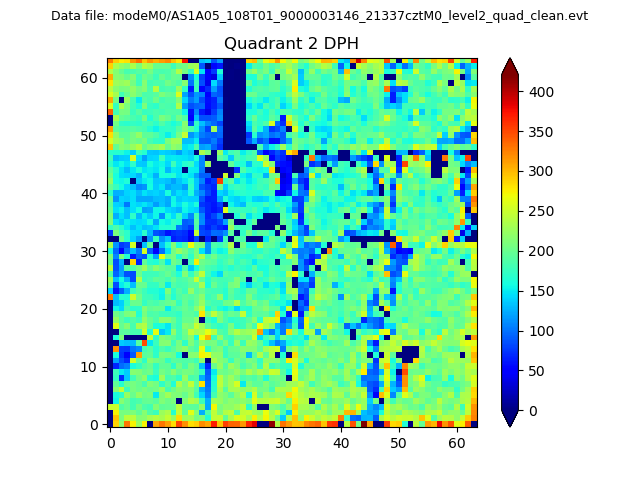
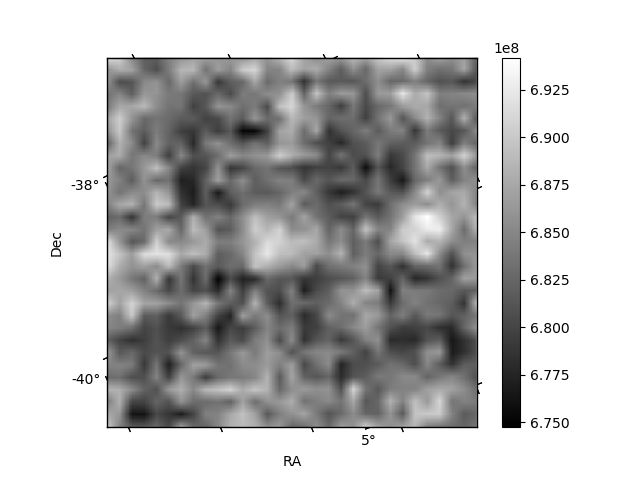
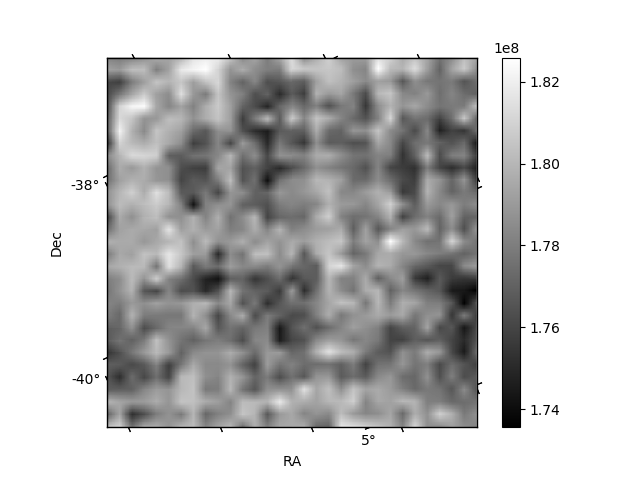
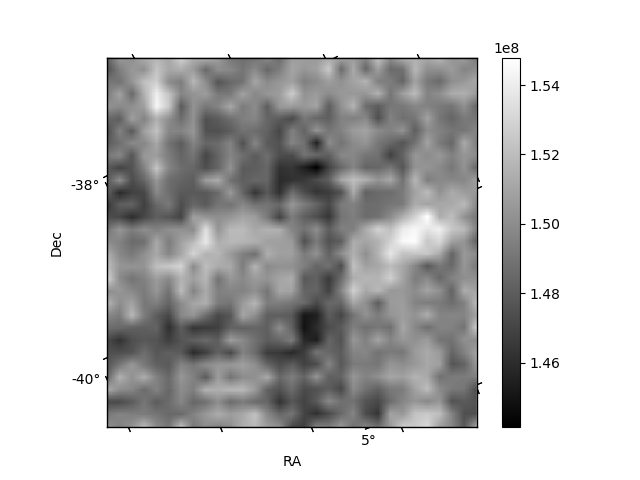
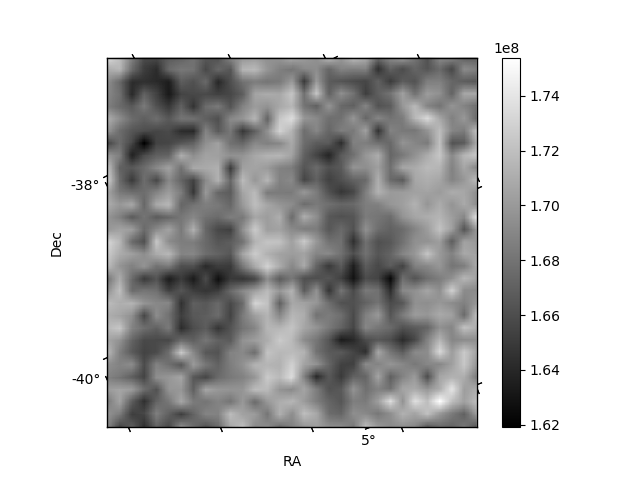
Histogram calculated using DETX and DETY for each event in the final _common_clean file
| Quadrant A | 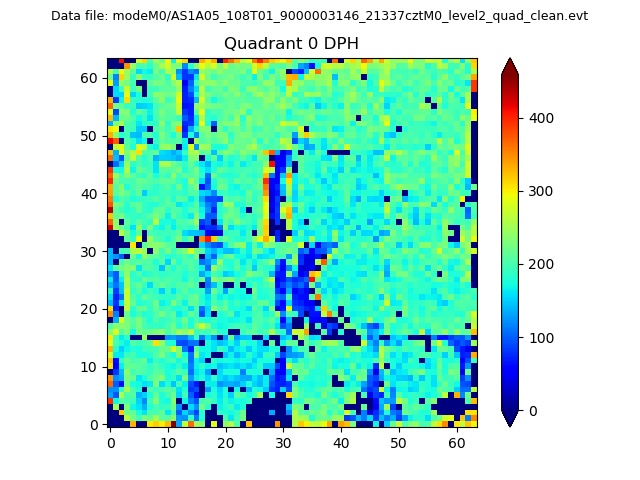 |
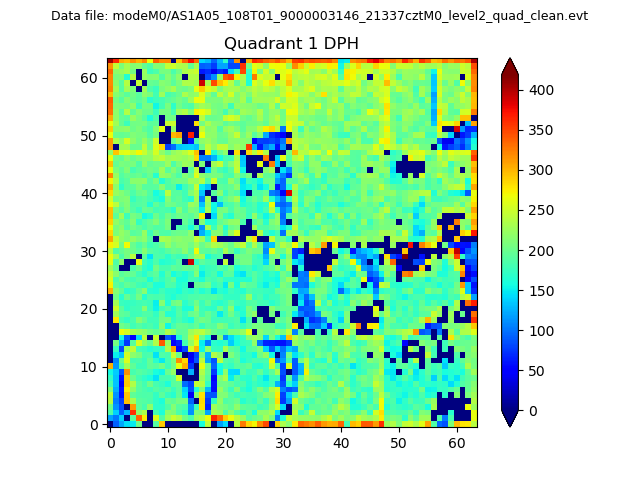 |
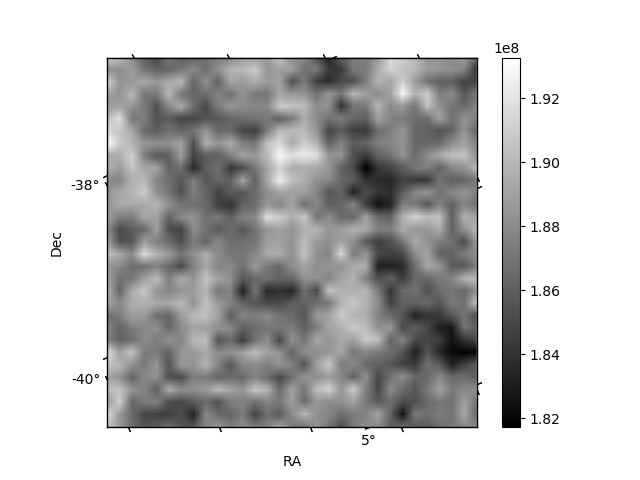
Quadrant B |
|---|---|---|---|
| Quadrant D | 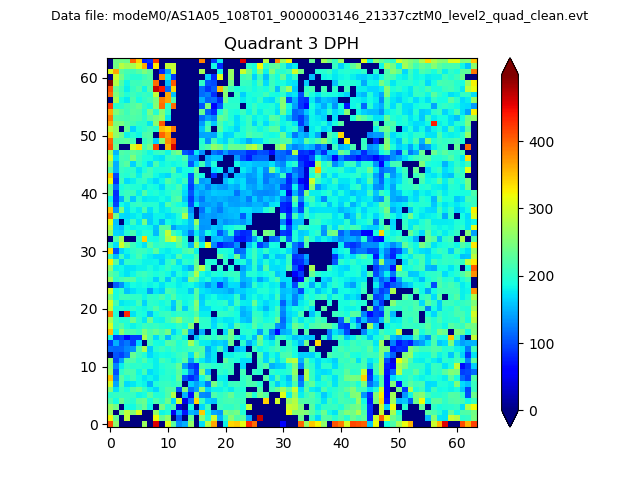 |
 |
Quadrant C |
| Plot type | Count rate plots | Images |
|---|---|---|
| Comparison with Poisson distribution Blue bars denote a histogram of data divided into 1 sec bins. Red curve is a Poisson curve with rate = median count rate of data. |
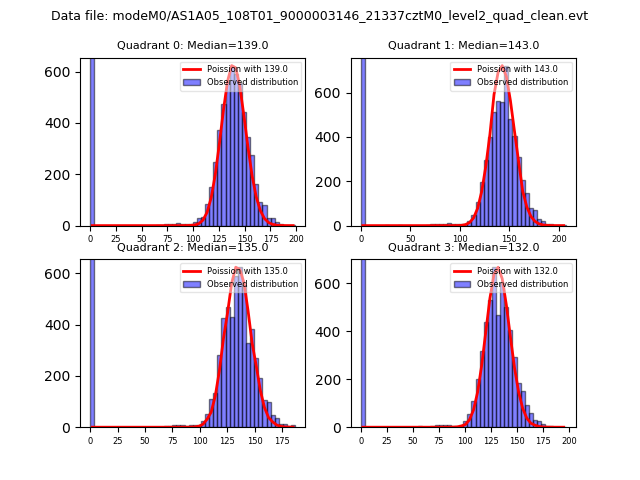 |
 |
| Quadrant-wise count rates Data is divided into 100 sec bins |
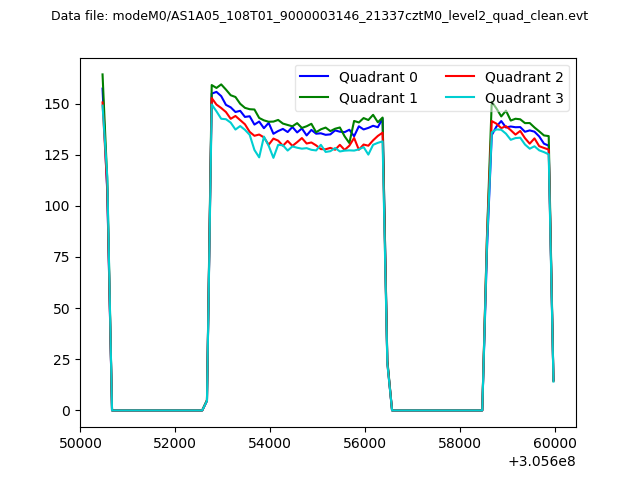 |
|
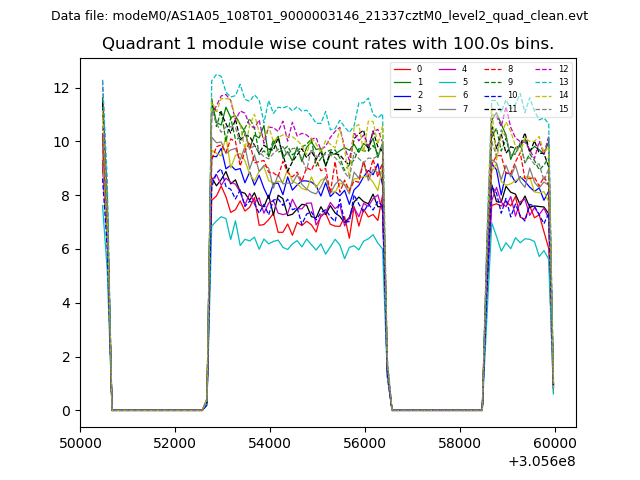
| Module-wise count rates for Quadrant A Data is divided into 100 sec bins |
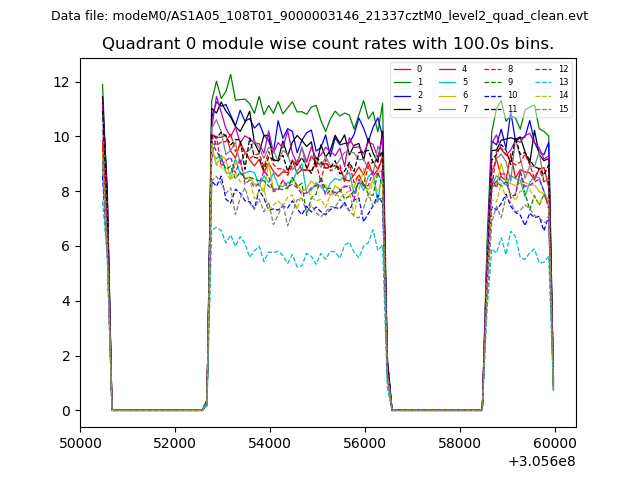 |
 |
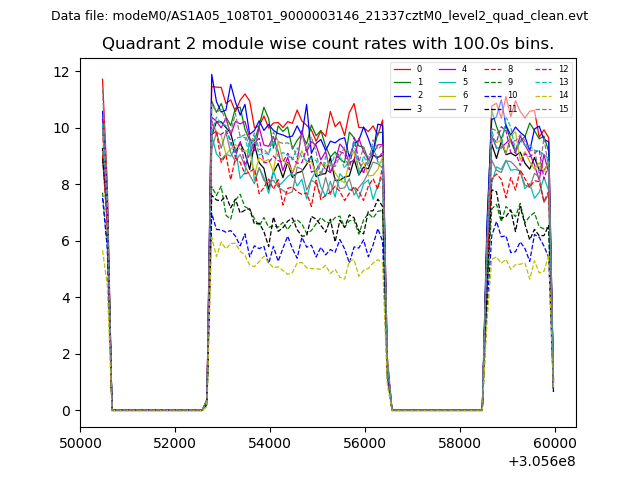
| Module-wise count rates for Quadrant B Data is divided into 100 sec bins |
 |
 |
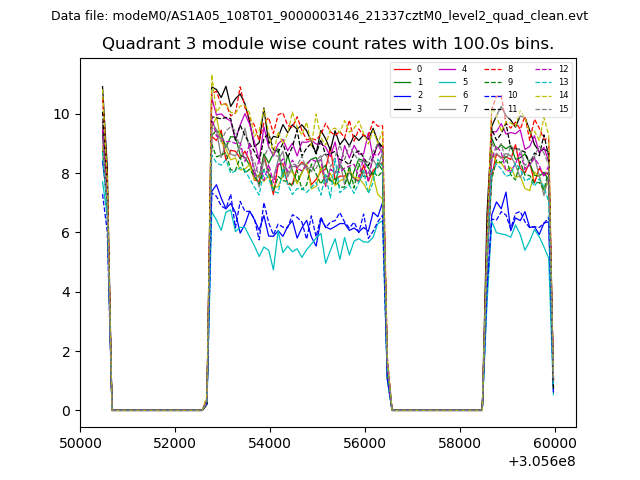
| Module-wise count rates for Quadrant C Data is divided into 100 sec bins |
 |
 |
| Module-wise count rates for Quadrant D Data is divided into 100 sec bins |
 |
 |
| Parameter | Plot |
|---|---|
| CZT HV Monitor | 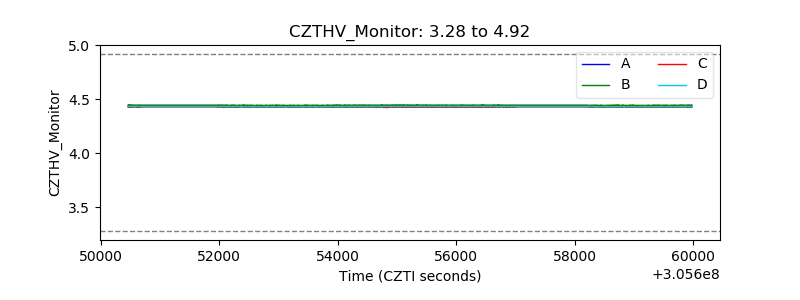 |
| D_VDD | 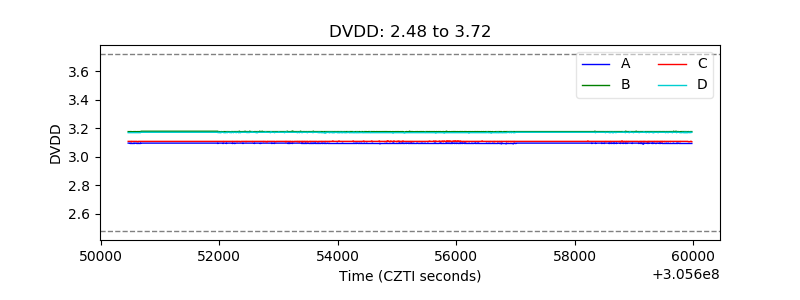 |
| Temperature 1 | 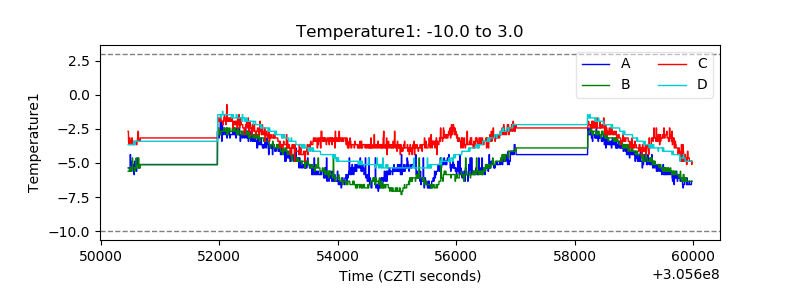 |
| Veto HV Monitor | 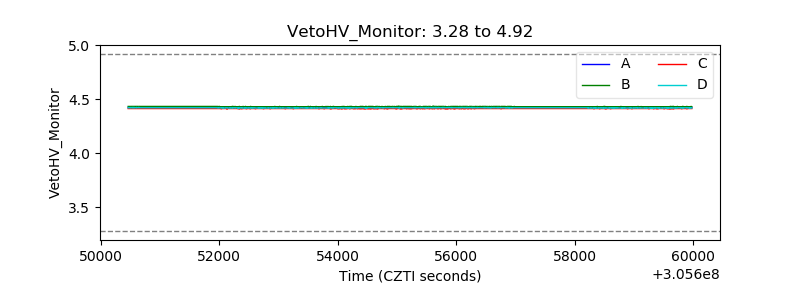 |
| Veto LLD | 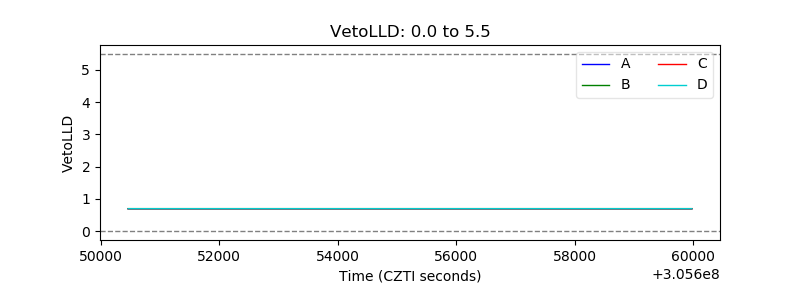 |
| Alpha Counter | 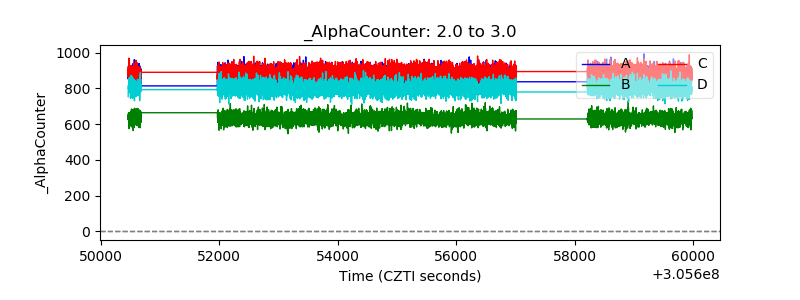 |
| _CPM_Rate | 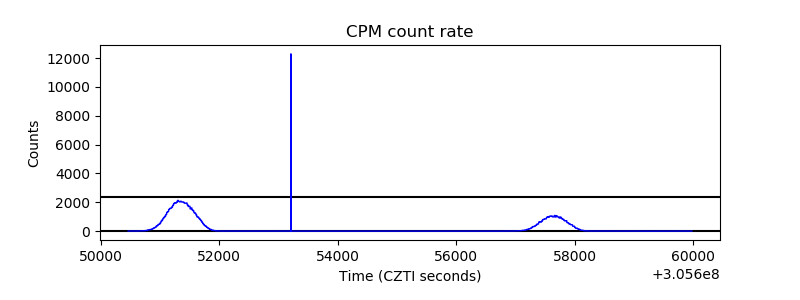 |
| CZT Counter | 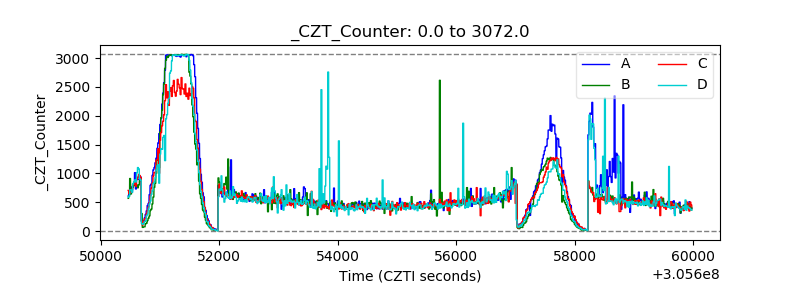 |
| +2.5 Volts monitor |  |
| +5 Volts monitor |  |
| _ROLL_ROT | 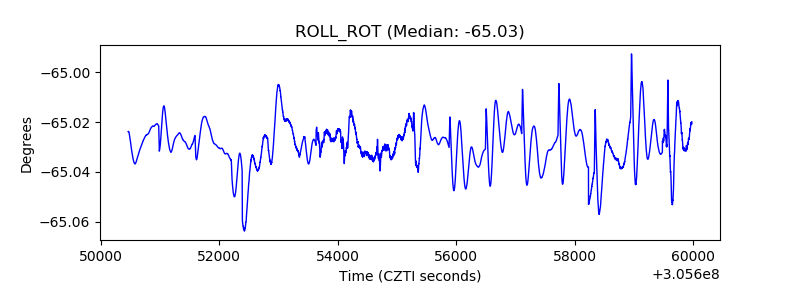 |
| _Roll_DEC | 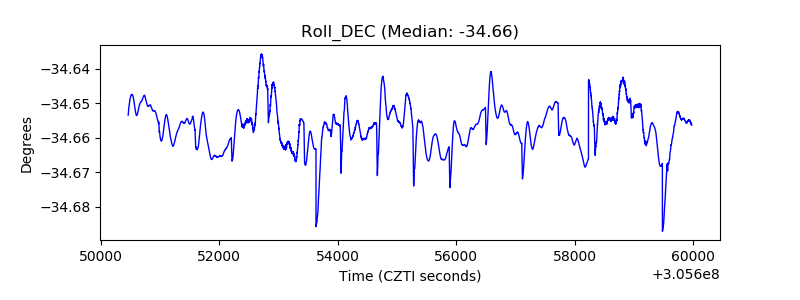 |
| _Roll_RA | 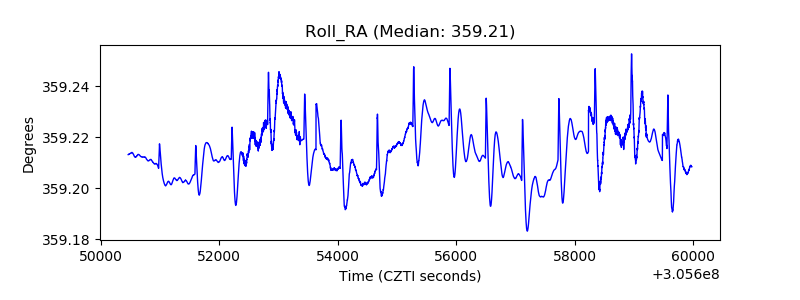 |
| Veto Counter | 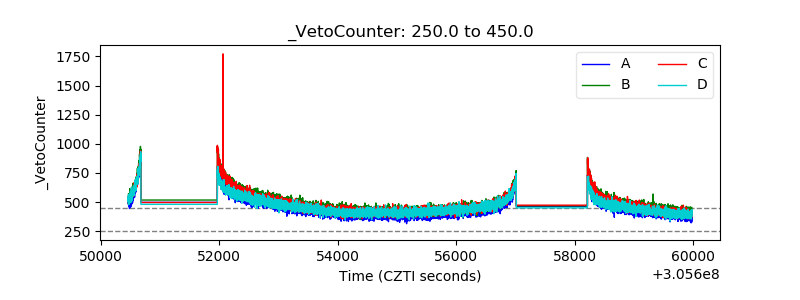 |