| Param | Original file | Final file |
|---|---|---|
| Filename | modeM0/AS1A05_108T01_9000003146_21339cztM0_level2.evt | modeM0/AS1A05_108T01_9000003146_21339cztM0_level2_quad_clean.evt |
| Size (bytes) | 495,959,040 | 106,381,440 |
| Size | 473.0 MB | 101.5 MB |
| Events in quadrant A | 3,714,055 | 686,089 |
| Events in quadrant B | 3,690,873 | 698,580 |
| Events in quadrant C | 3,455,243 | 669,004 |
| Events in quadrant D | 3,660,389 | 656,153 |
| Mode M0 | |||
|---|---|---|---|
| Quadrant | BADHDUFLAG | Total packets | Discarded packets |
| A | 0 | 15643 | 3 |
| B | 0 | 15814 | 2 |
| C | 0 | 15124 | 2 |
| D | 0 | 16120 | 2 |
| Mode M9 | |||
|---|---|---|---|
| Quadrant | BADHDUFLAG | Total packets | Discarded packets |
| A | 0 | 5 | 0 |
| B | 0 | 6 | 0 |
| C | 0 | 6 | 0 |
| D | 0 | 6 | 0 |
| Mode SS | |||
|---|---|---|---|
| Quadrant | BADHDUFLAG | Total packets | Discarded packets |
| A | 0 | 150 | 0 |
| B | 0 | 150 | 0 |
| C | 0 | 150 | 0 |
| D | 0 | 150 | 0 |
| Quadrant | Total seconds | Saturated seconds | Saturation percentage |
|---|---|---|---|
| A | 7353 | 24 | 0.326397% |
| B | 7353 | 93 | 1.264790% |
| C | 7353 | 44 | 0.598395% |
| D | 7353 | 56 | 0.761594% |
Noise dominated data is calculated using 1-second bins in cleaned event files. If a bin has >2000 counts, and if more than 50% of those come from <1% of pixels, then it is considered to be noise-dominated and hence unusable.
| Quadrant | # 1 sec bins | Bins with >0 counts | Bins with >2000 counts | High rate bins dominated by noise | Noise dominated (total time) | Noise dominated (detector-on time) | Marked lightcurve |
|---|---|---|---|---|---|---|---|
| A | 7913 | 7354 | 2 | 2 | 0.03% | 0.03% | 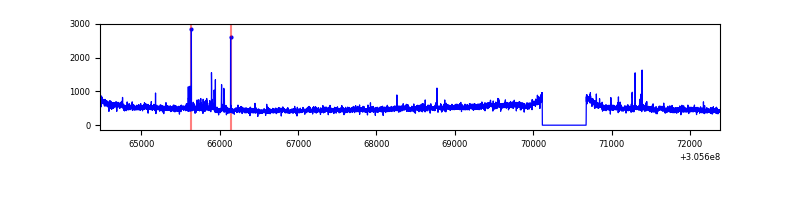 |
| B | 7913 | 7354 | 37 | 37 | 0.47% | 0.50% | 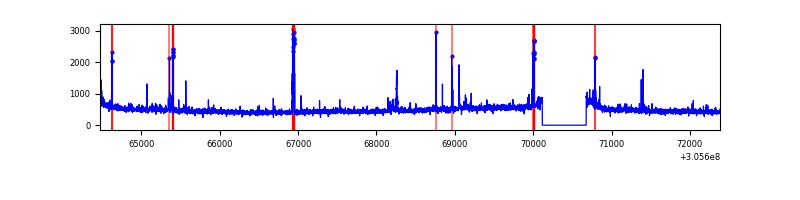 |
| C | 7913 | 7354 | 0 | 0 | 0.00% | 0.00% | 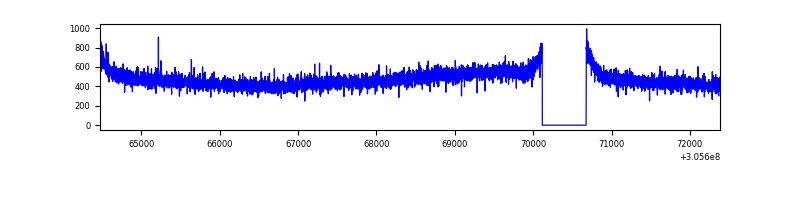 |
| D | 7913 | 7354 | 37 | 37 | 0.47% | 0.50% | 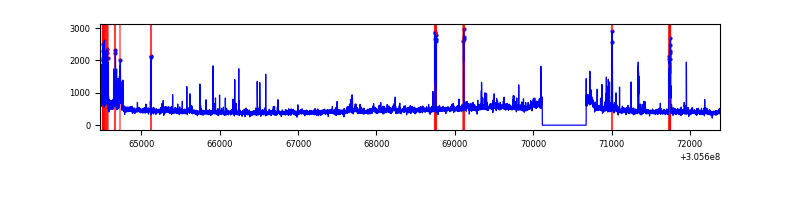 |
Top three noisy pixels from each quadrant. If the there are fewer than three noisy pixels in the level2.evt file, extra rows are filled as -1
| Pixel properties | Quadrant properties | ||||||
|---|---|---|---|---|---|---|---|
| Quadrant | DetID | PixID | Counts | Sigma | Mean | Median | Sigma |
| A | 5 | 168 | 227796 | 1271.39 | 887 | 869 | 178.5 |
| A | 5 | 16 | 34806 | 190.14 | 887 | 869 | 178.5 |
| A | 15 | 174 | 19099 | 102.14 | 887 | 869 | 178.5 |
| B | 3 | 64 | 94843 | 553.7 | 885 | 861 | 169.7 |
| B | 0 | 230 | 59568 | 345.88 | 885 | 861 | 169.7 |
| B | 0 | 197 | 31277 | 179.2 | 885 | 861 | 169.7 |
| C | 14 | 238 | 133311 | 666.27 | 849 | 856 | 198.8 |
| C | 3 | 233 | 6938 | 30.59 | 849 | 856 | 198.8 |
| C | 13 | 61 | 6007 | 25.91 | 849 | 856 | 198.8 |
| D | 1 | 52 | 138060 | 655.61 | 856 | 832 | 209.3 |
| D | 13 | 174 | 118861 | 563.88 | 856 | 832 | 209.3 |
| D | 13 | 172 | 57749 | 271.92 | 856 | 832 | 209.3 |
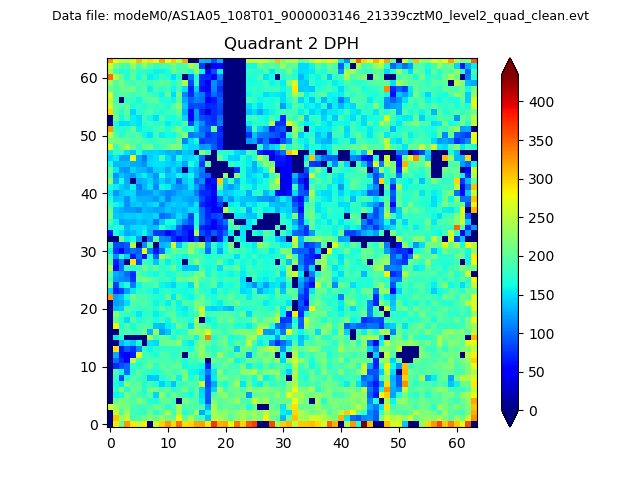
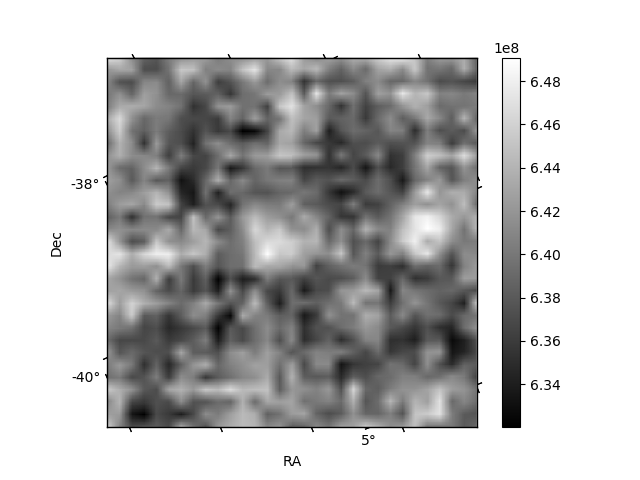
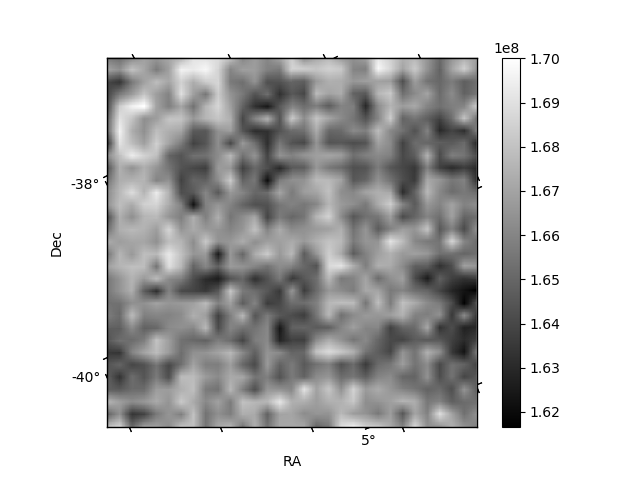
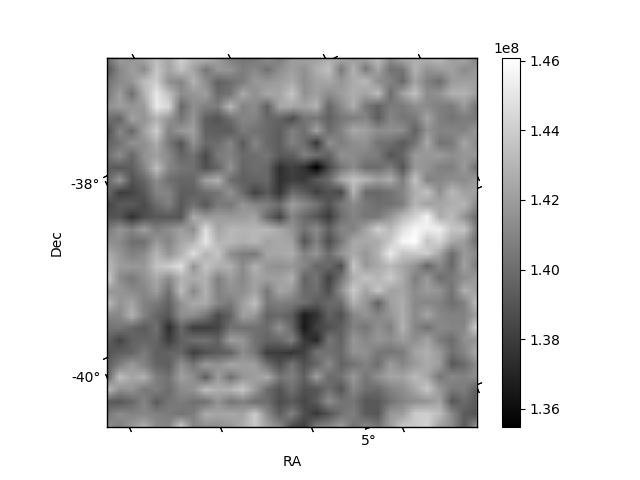
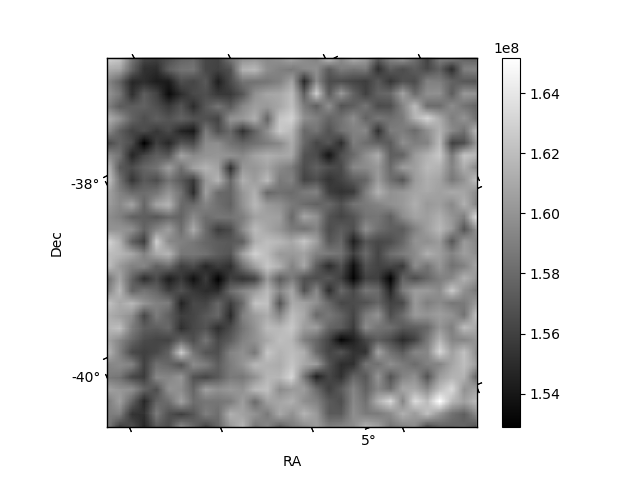
Histogram calculated using DETX and DETY for each event in the final _common_clean file
| Quadrant A | 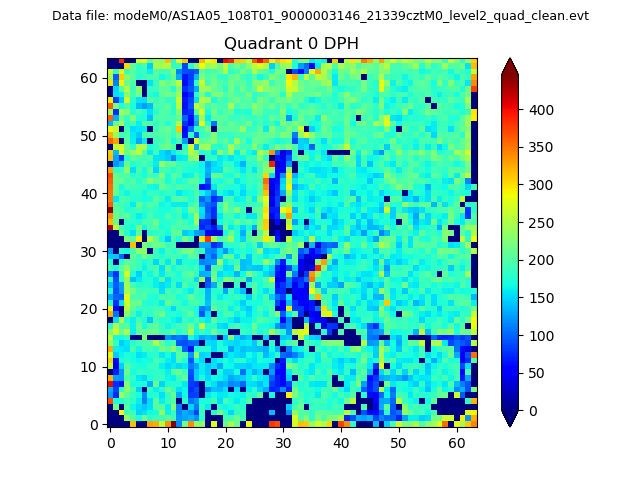 |
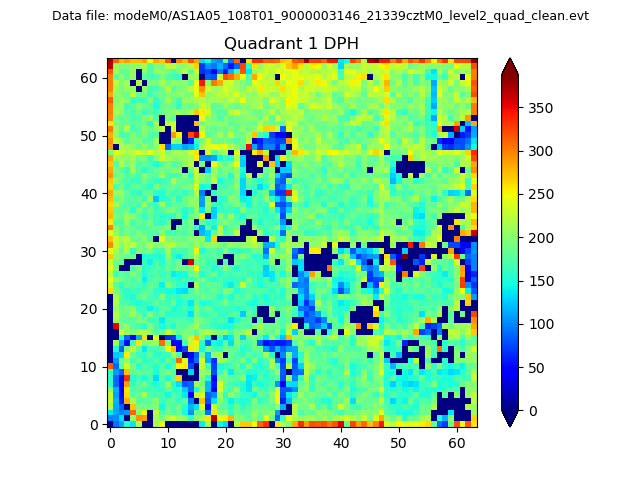 |
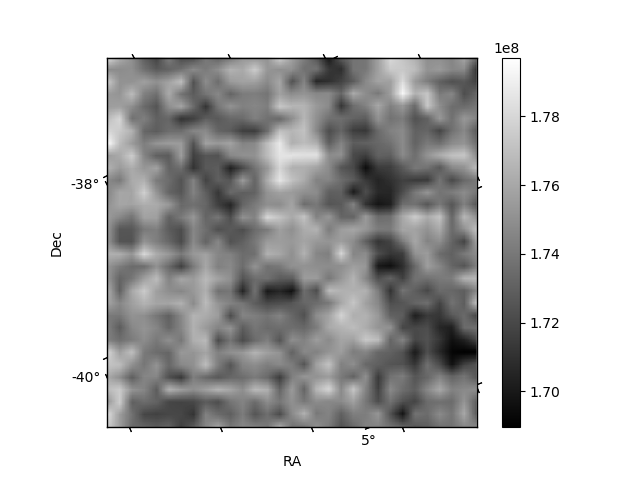
Quadrant B |
|---|---|---|---|
| Quadrant D | 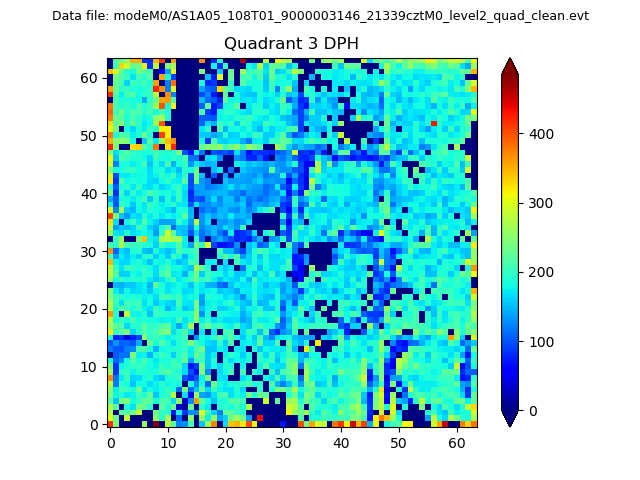 |
 |
Quadrant C |
| Plot type | Count rate plots | Images |
|---|---|---|
| Comparison with Poisson distribution Blue bars denote a histogram of data divided into 1 sec bins. Red curve is a Poisson curve with rate = median count rate of data. |
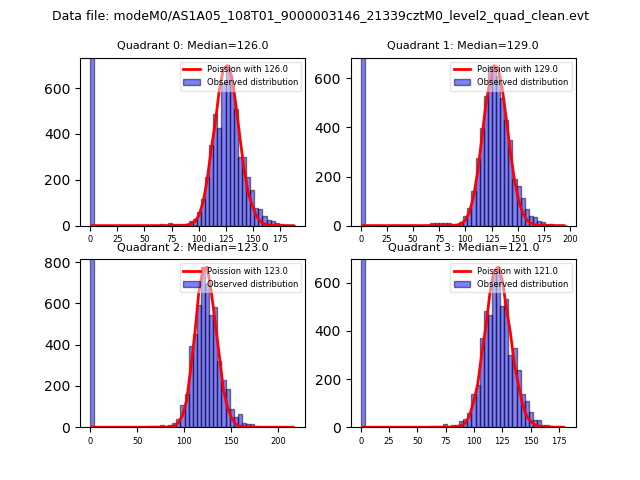 |
 |
| Quadrant-wise count rates Data is divided into 100 sec bins |
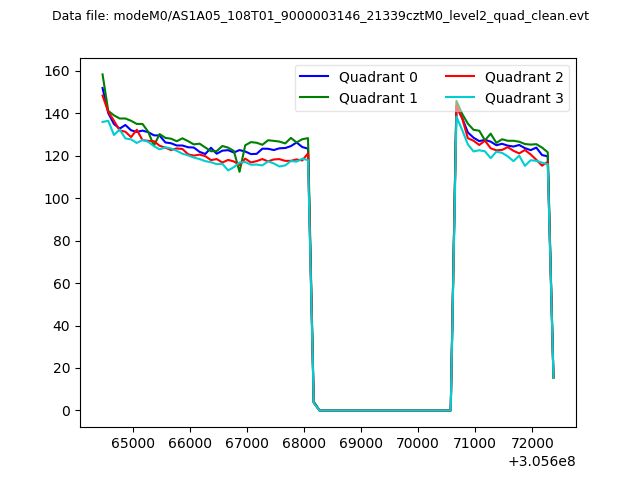 |
|
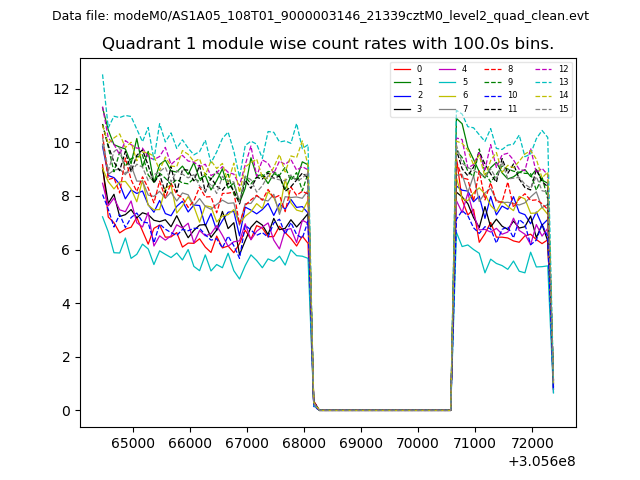
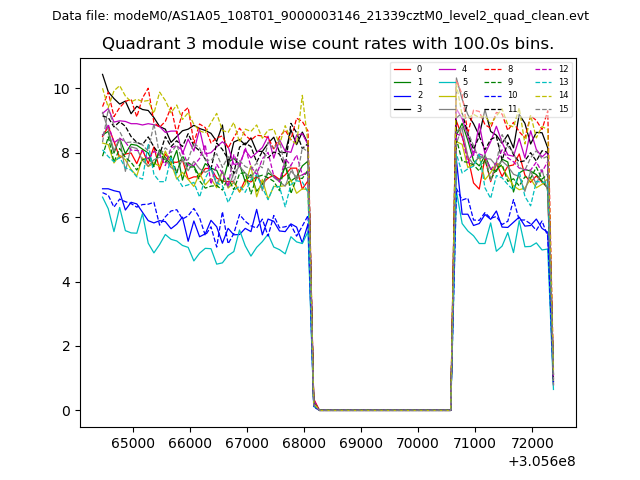
| Module-wise count rates for Quadrant A Data is divided into 100 sec bins |
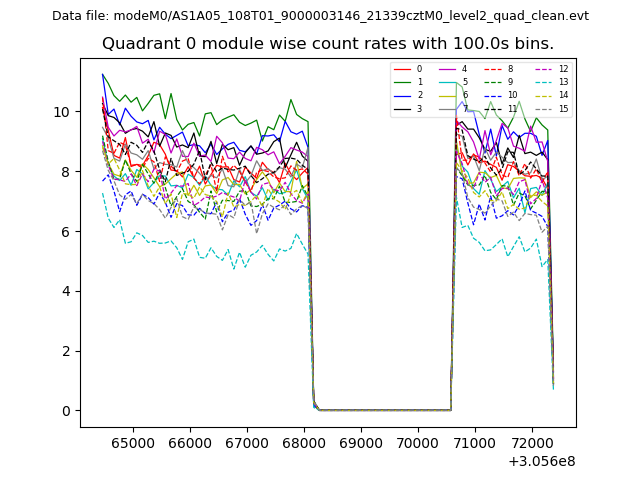 |
 |
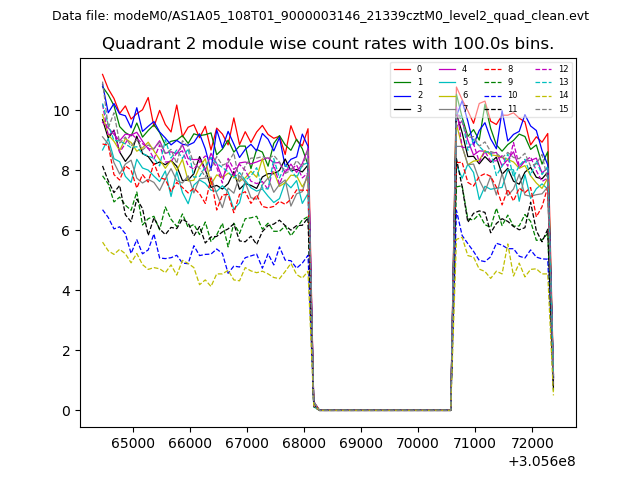
| Module-wise count rates for Quadrant B Data is divided into 100 sec bins |
 |
 |
| Module-wise count rates for Quadrant C Data is divided into 100 sec bins |
 |
 |
| Module-wise count rates for Quadrant D Data is divided into 100 sec bins |
 |
 |
| Parameter | Plot |
|---|---|
| CZT HV Monitor | 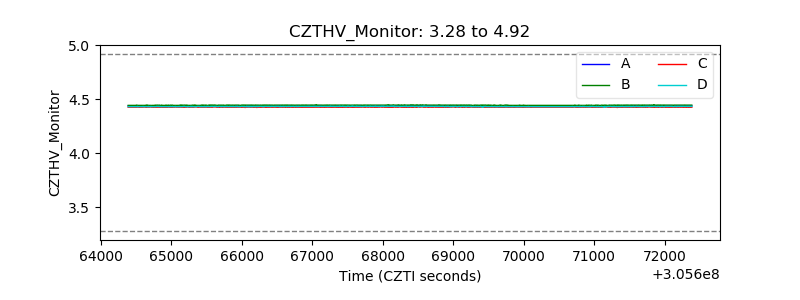 |
| D_VDD | 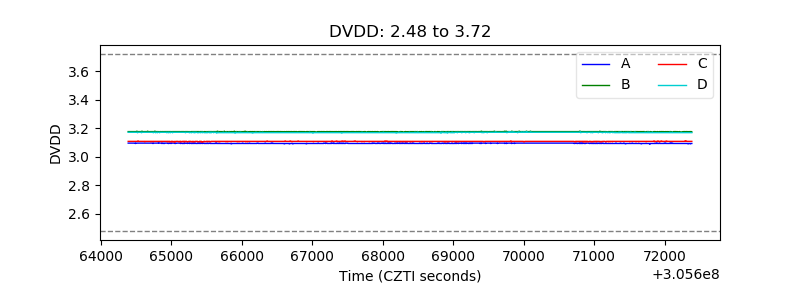 |
| Temperature 1 | 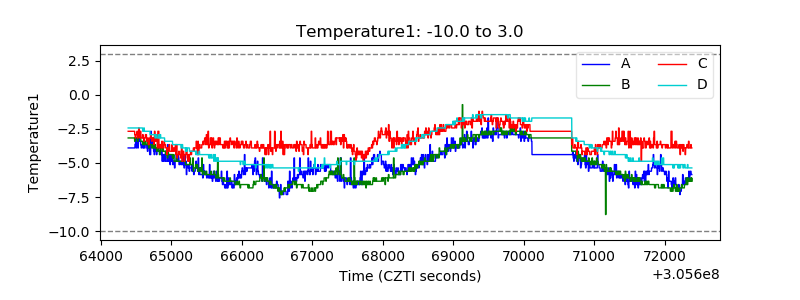 |
| Veto HV Monitor |  |
| Veto LLD | 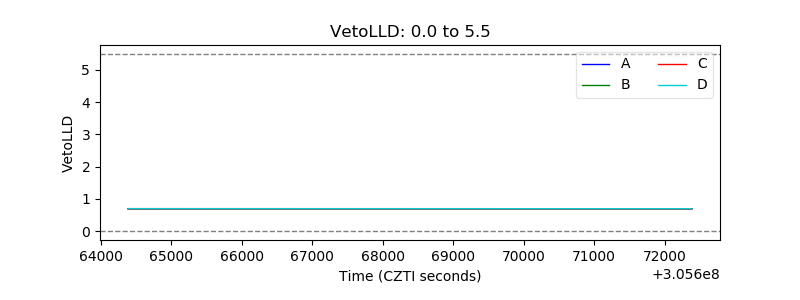 |
| Alpha Counter | 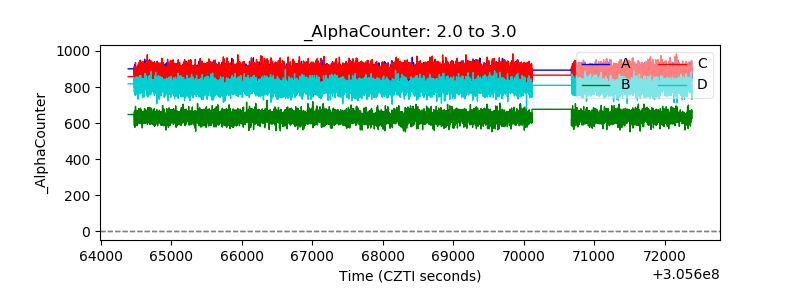 |
| _CPM_Rate | 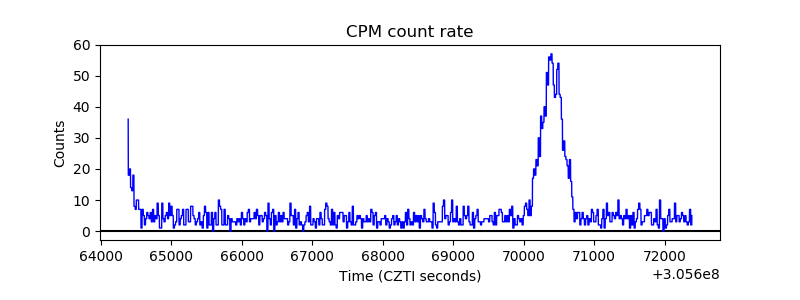 |
| CZT Counter | 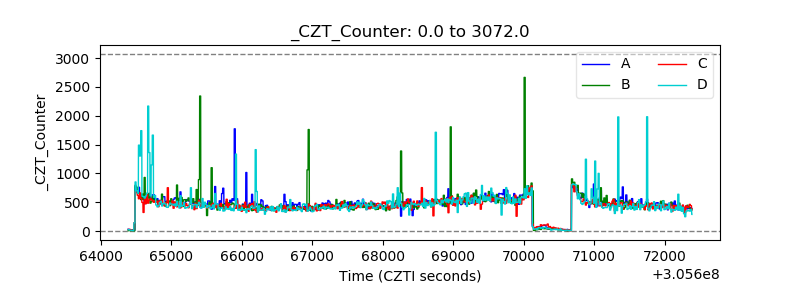 |
| +2.5 Volts monitor |  |
| +5 Volts monitor |  |
| _ROLL_ROT | 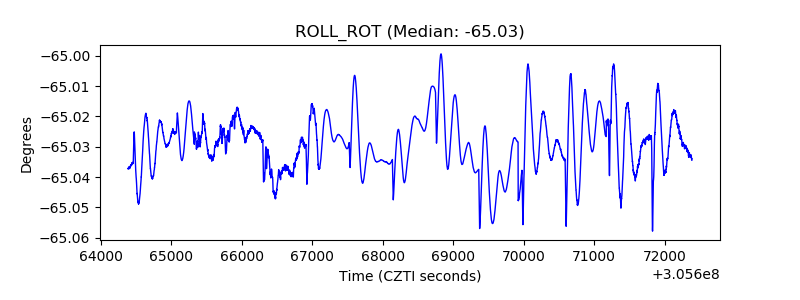 |
| _Roll_DEC | 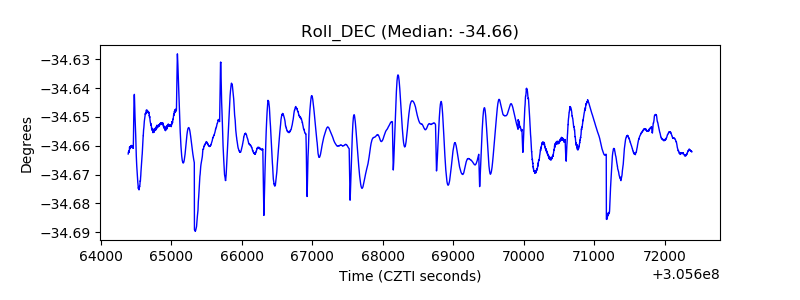 |
| _Roll_RA | 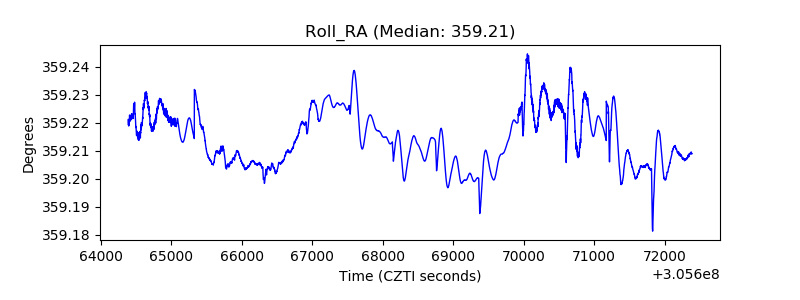 |
| Veto Counter | 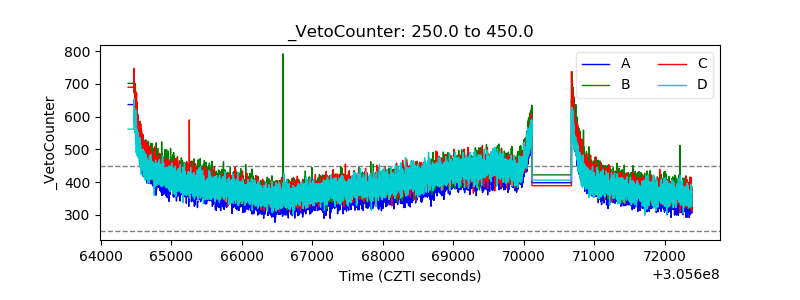 |