| Param | Original file | Final file |
|---|---|---|
| Filename | modeM0/AS1A05_108T01_9000003146_21341cztM0_level2.evt | modeM0/AS1A05_108T01_9000003146_21341cztM0_level2_quad_clean.evt |
| Size (bytes) | 521,680,320 | 106,450,560 |
| Size | 497.5 MB | 101.5 MB |
| Events in quadrant A | 3,861,626 | 681,216 |
| Events in quadrant B | 3,675,777 | 698,314 |
| Events in quadrant C | 3,577,459 | 662,922 |
| Events in quadrant D | 4,166,039 | 650,386 |
| Mode M0 | |||
|---|---|---|---|
| Quadrant | BADHDUFLAG | Total packets | Discarded packets |
| A | 0 | 16307 | 2 |
| B | 0 | 15974 | 2 |
| C | 0 | 15642 | 2 |
| D | 0 | 17603 | 2 |
| Mode M9 | |||
|---|---|---|---|
| Quadrant | BADHDUFLAG | Total packets | Discarded packets |
| A | 0 | 4 | 0 |
| B | 0 | 5 | 0 |
| C | 0 | 5 | 0 |
| D | 0 | 5 | 0 |
| Mode SS | |||
|---|---|---|---|
| Quadrant | BADHDUFLAG | Total packets | Discarded packets |
| A | 0 | 154 | 0 |
| B | 0 | 154 | 0 |
| C | 0 | 154 | 0 |
| D | 0 | 154 | 0 |
| Quadrant | Total seconds | Saturated seconds | Saturation percentage |
|---|---|---|---|
| A | 7638 | 49 | 0.641529% |
| B | 7637 | 94 | 1.230850% |
| C | 7637 | 95 | 1.243944% |
| D | 7637 | 53 | 0.693990% |
Noise dominated data is calculated using 1-second bins in cleaned event files. If a bin has >2000 counts, and if more than 50% of those come from <1% of pixels, then it is considered to be noise-dominated and hence unusable.
| Quadrant | # 1 sec bins | Bins with >0 counts | Bins with >2000 counts | High rate bins dominated by noise | Noise dominated (total time) | Noise dominated (detector-on time) | Marked lightcurve |
|---|---|---|---|---|---|---|---|
| A | 8003 | 7640 | 0 | 0 | 0.00% | 0.00% | 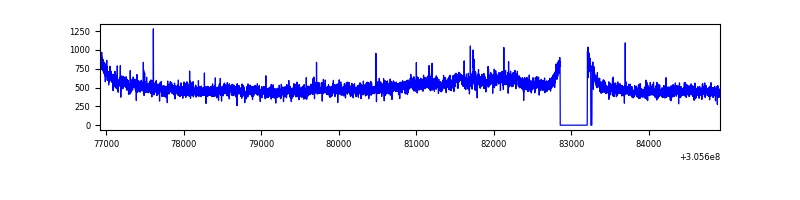 |
| B | 8002 | 7639 | 14 | 14 | 0.17% | 0.18% | 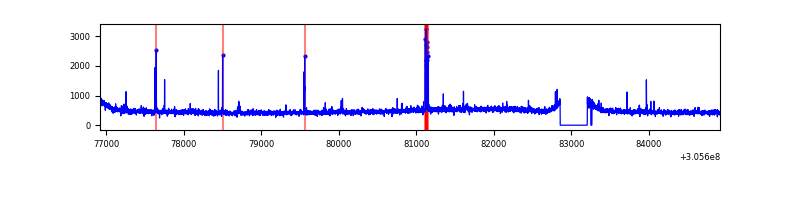 |
| C | 8002 | 7639 | 0 | 0 | 0.00% | 0.00% | 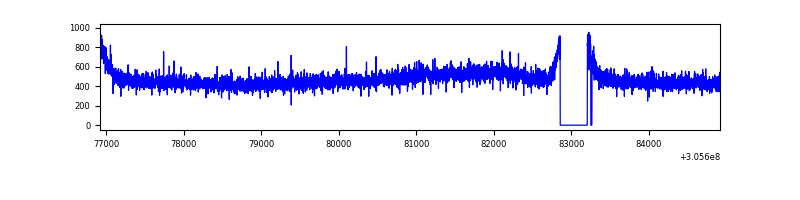 |
| D | 8002 | 7639 | 15 | 15 | 0.19% | 0.20% | 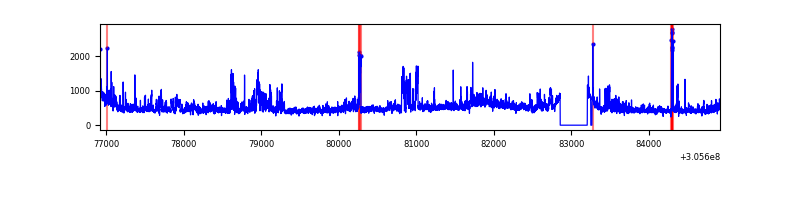 |
Top three noisy pixels from each quadrant. If the there are fewer than three noisy pixels in the level2.evt file, extra rows are filled as -1
| Pixel properties | Quadrant properties | ||||||
|---|---|---|---|---|---|---|---|
| Quadrant | DetID | PixID | Counts | Sigma | Mean | Median | Sigma |
| A | 5 | 168 | 347162 | 1901.3 | 906 | 887 | 182.1 |
| A | 5 | 16 | 11457 | 58.04 | 906 | 887 | 182.1 |
| A | 13 | 254 | 10512 | 52.85 | 906 | 887 | 182.1 |
| B | 3 | 64 | 61494 | 349.32 | 909 | 889 | 173.5 |
| B | 0 | 230 | 22575 | 125.0 | 909 | 889 | 173.5 |
| B | 12 | 111 | 21660 | 119.72 | 909 | 889 | 173.5 |
| C | 14 | 238 | 134863 | 654.67 | 875 | 881 | 204.7 |
| C | 8 | 128 | 14234 | 65.25 | 875 | 881 | 204.7 |
| C | 7 | 247 | 8124 | 35.39 | 875 | 881 | 204.7 |
| D | 1 | 52 | 543715 | 2509.45 | 882 | 858 | 216.3 |
| D | 12 | 235 | 164044 | 754.36 | 882 | 858 | 216.3 |
| D | 13 | 172 | 55447 | 252.35 | 882 | 858 | 216.3 |
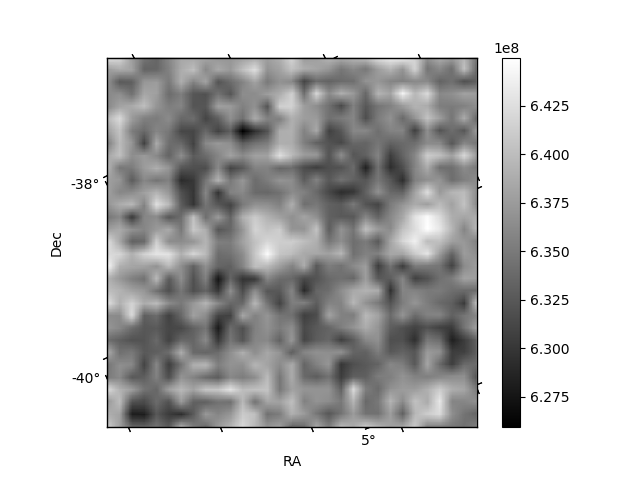
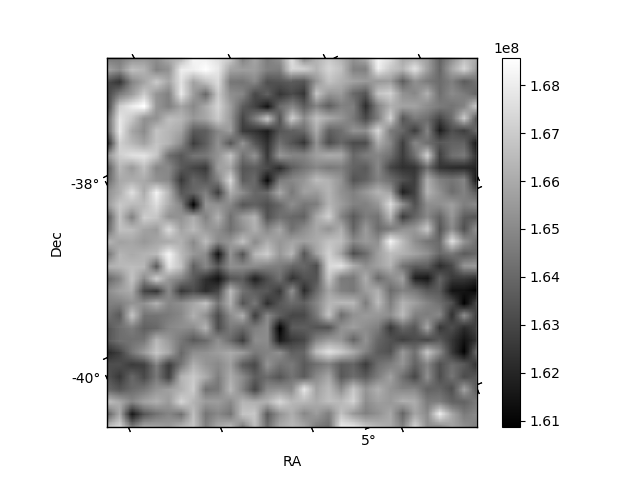
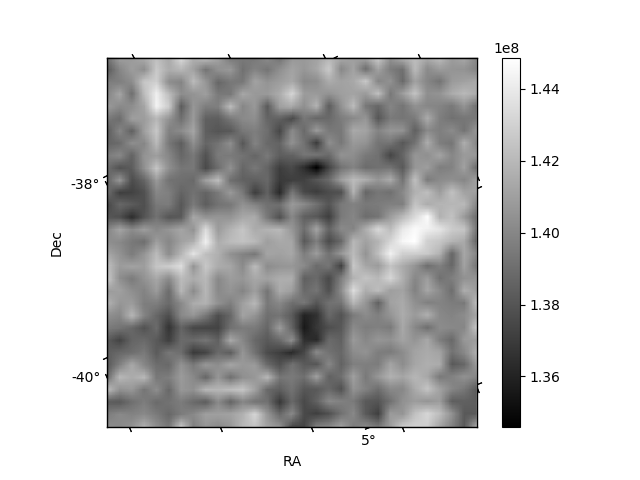
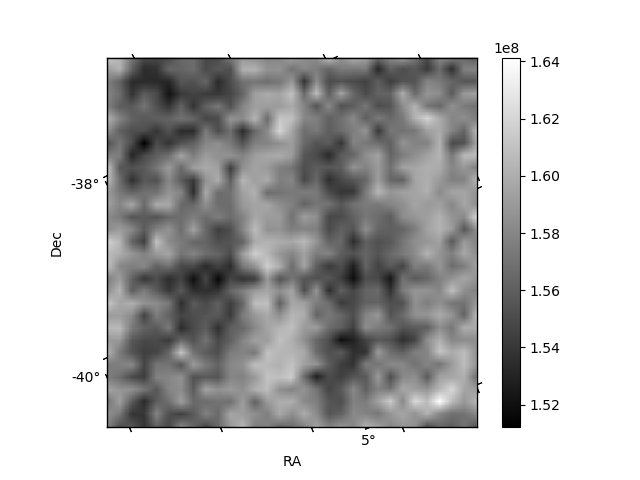
Histogram calculated using DETX and DETY for each event in the final _common_clean file
| Quadrant A | 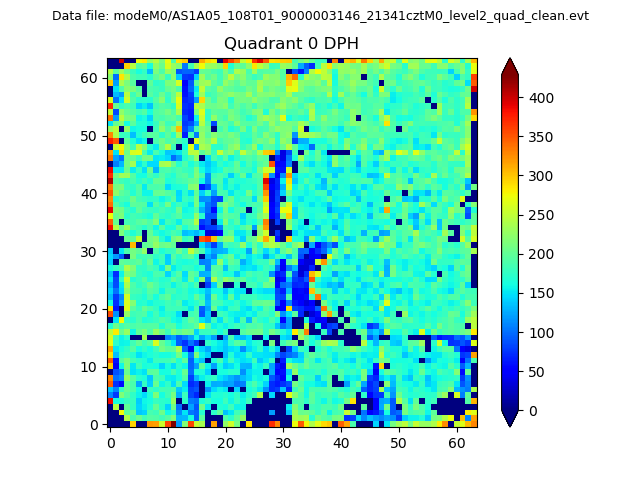 |
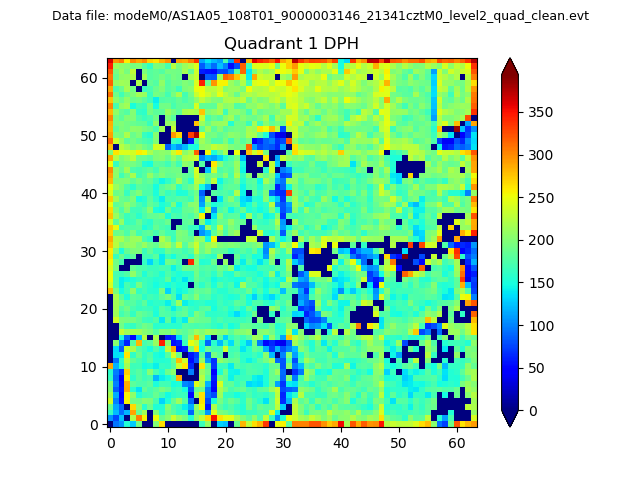 |
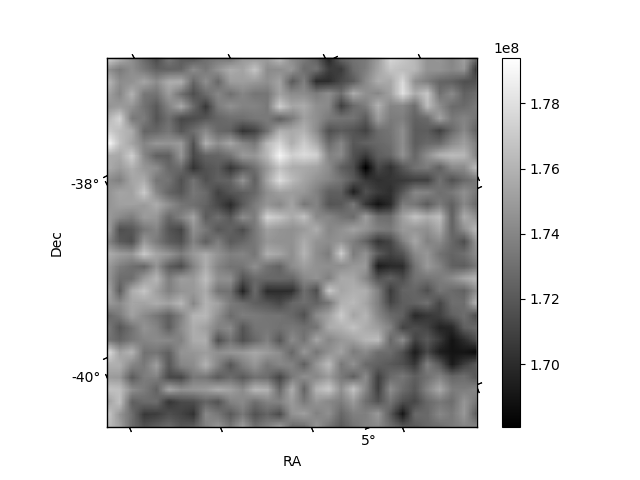
Quadrant B |
|---|---|---|---|
| Quadrant D | 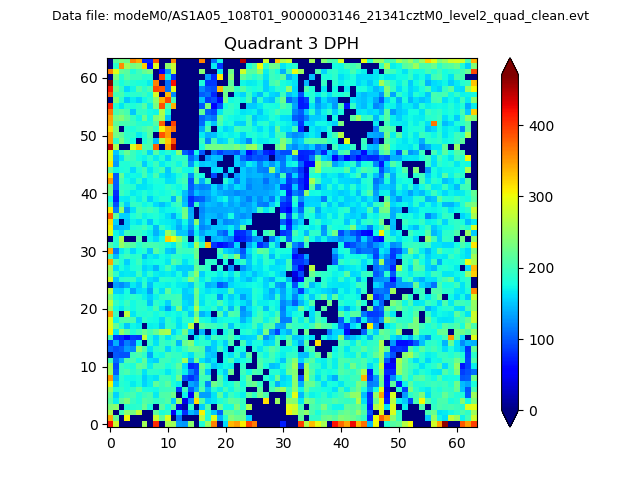 |
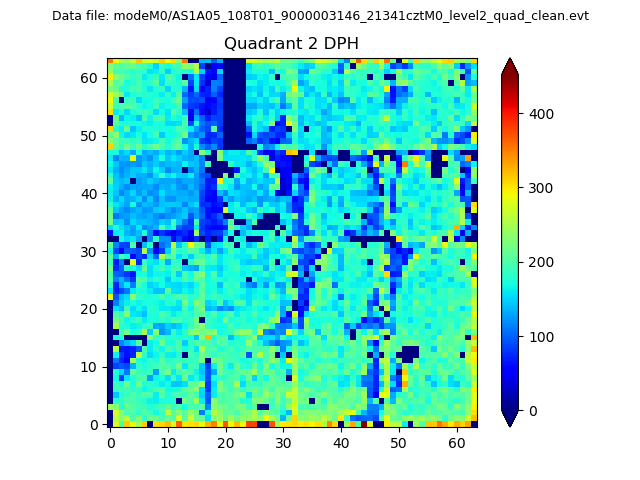 |
Quadrant C |
| Plot type | Count rate plots | Images |
|---|---|---|
| Comparison with Poisson distribution Blue bars denote a histogram of data divided into 1 sec bins. Red curve is a Poisson curve with rate = median count rate of data. |
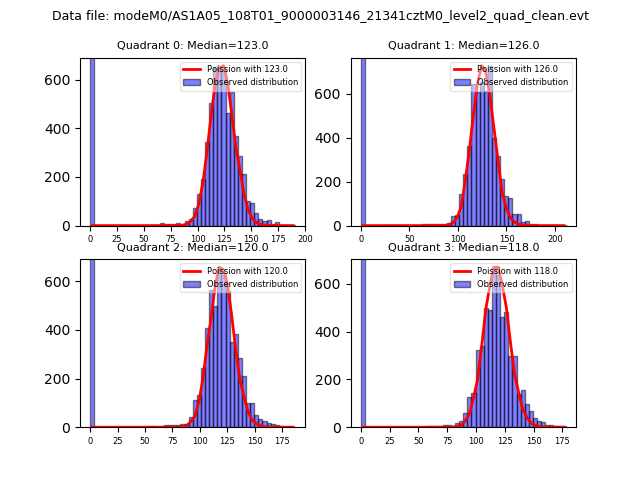 |
 |
| Quadrant-wise count rates Data is divided into 100 sec bins |
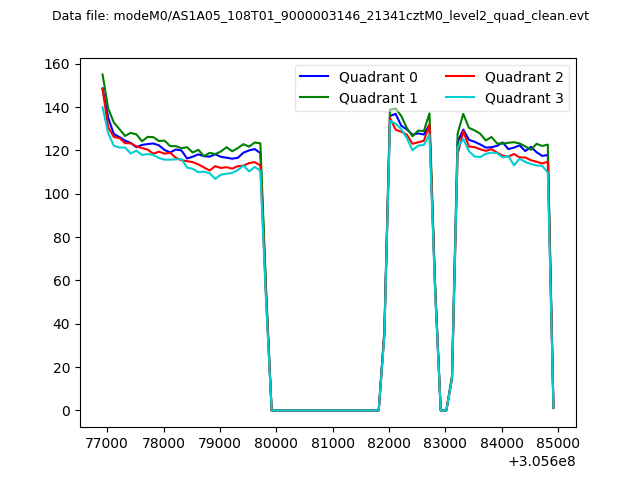 |
|
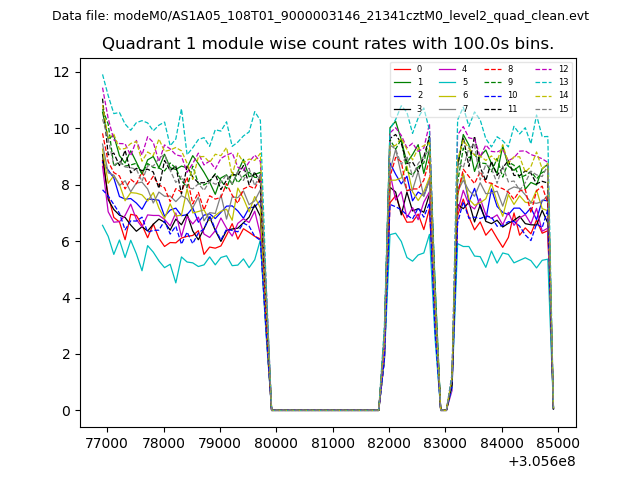
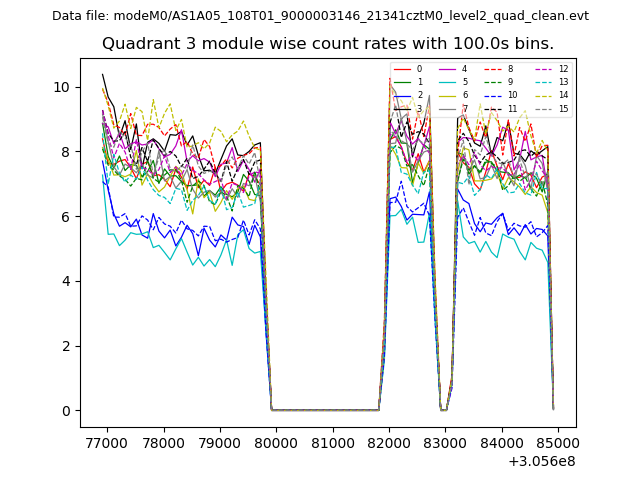
| Module-wise count rates for Quadrant A Data is divided into 100 sec bins |
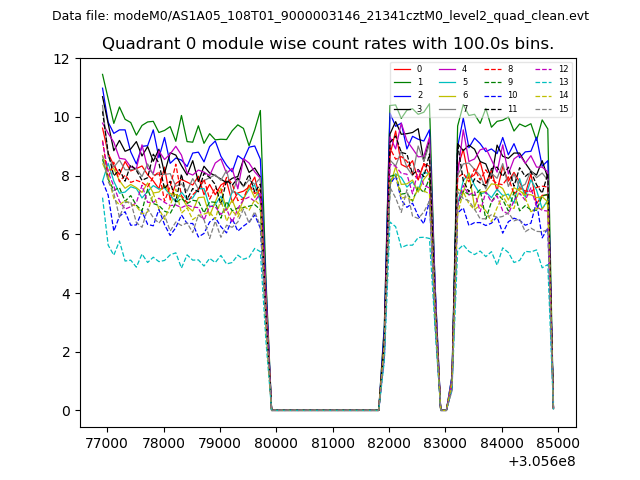 |
 |
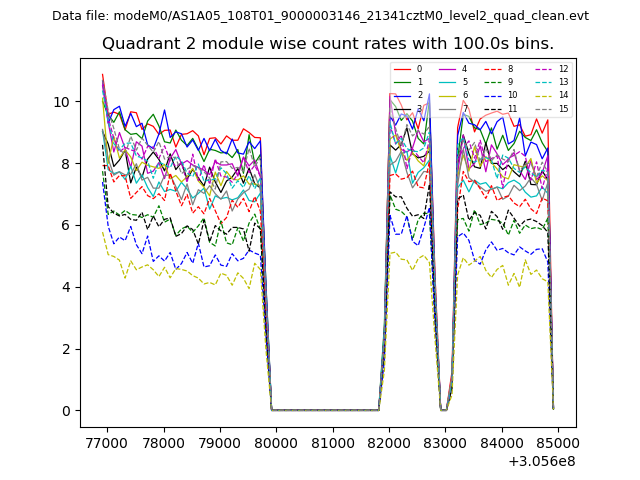
| Module-wise count rates for Quadrant B Data is divided into 100 sec bins |
 |
 |
| Module-wise count rates for Quadrant C Data is divided into 100 sec bins |
 |
 |
| Module-wise count rates for Quadrant D Data is divided into 100 sec bins |
 |
 |
| Parameter | Plot |
|---|---|
| CZT HV Monitor | 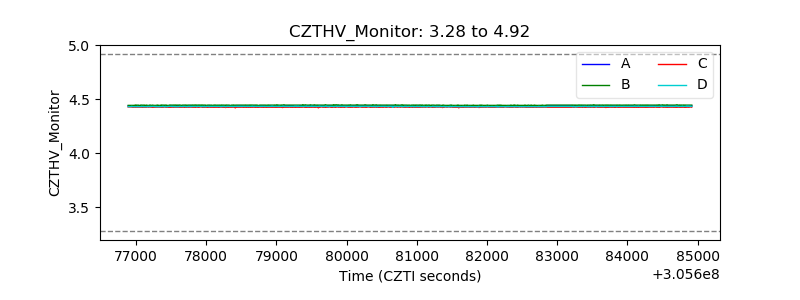 |
| D_VDD | 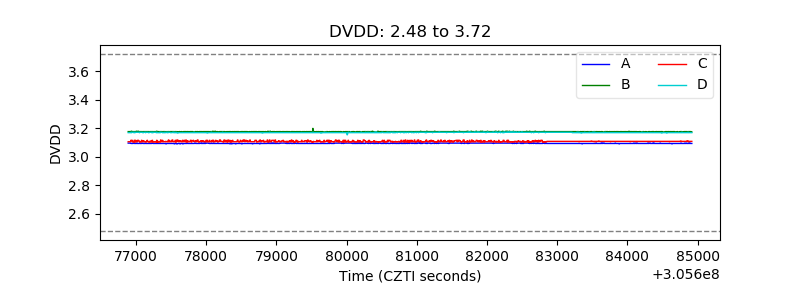 |
| Temperature 1 | 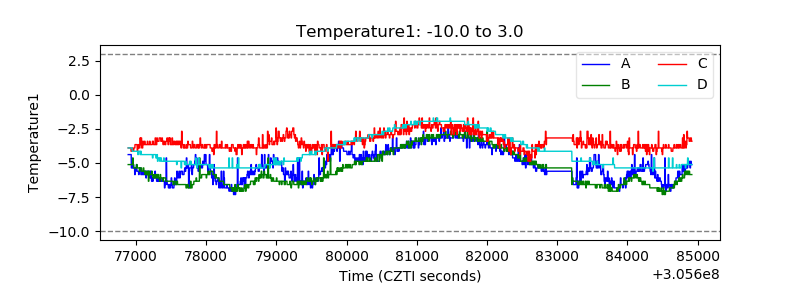 |
| Veto HV Monitor | 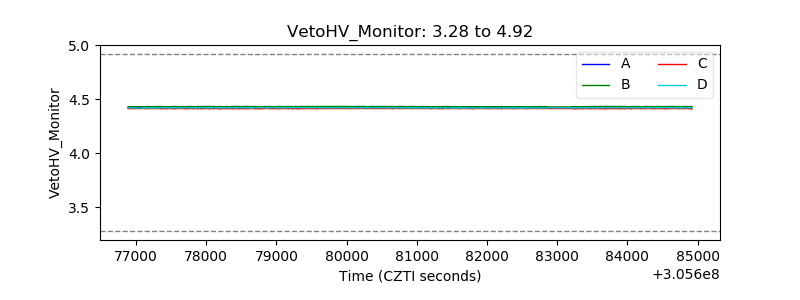 |
| Veto LLD | 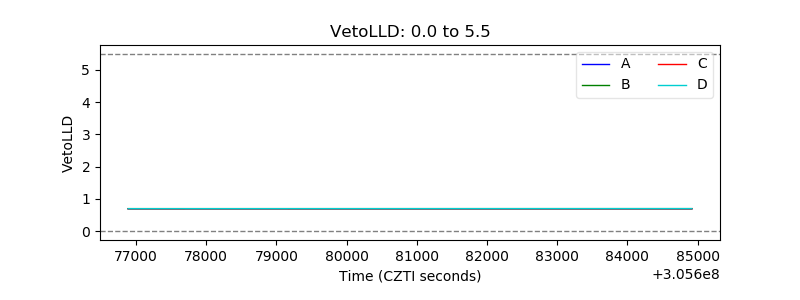 |
| Alpha Counter | 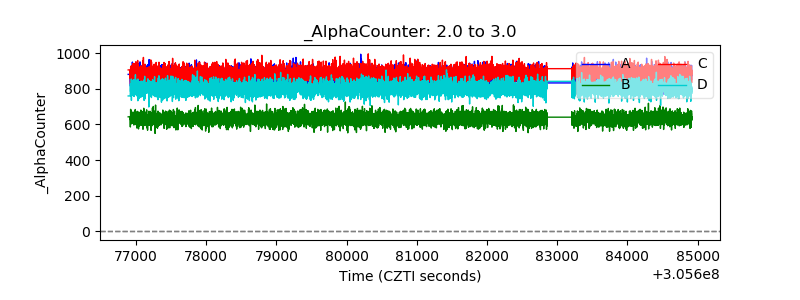 |
| _CPM_Rate | 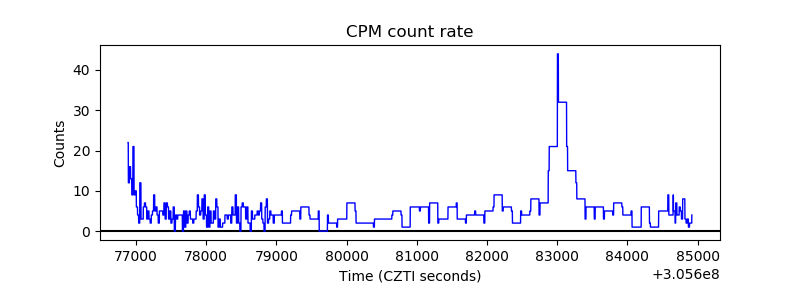 |
| CZT Counter | 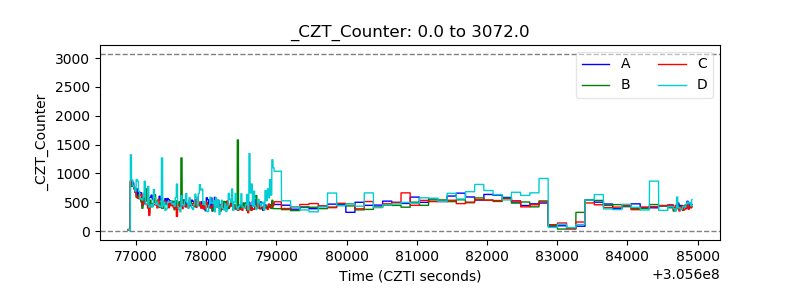 |
| +2.5 Volts monitor |  |
| +5 Volts monitor |  |
| _ROLL_ROT | 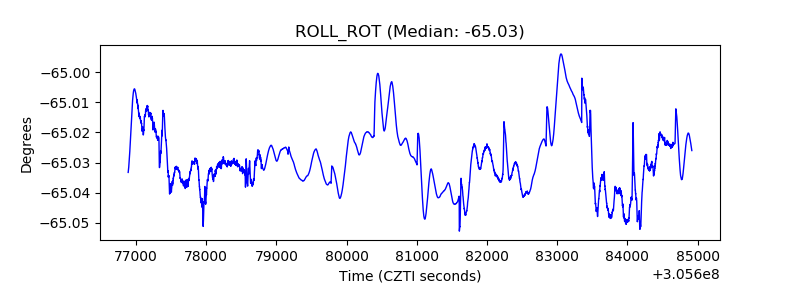 |
| _Roll_DEC |  |
| _Roll_RA | 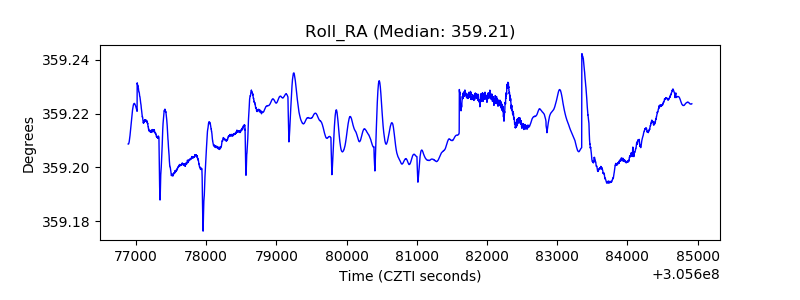 |
| Veto Counter |  |