| Param | Original file | Final file |
|---|---|---|
| Filename | modeM0/AS1A05_108T01_9000003146_21344cztM0_level2.evt | modeM0/AS1A05_108T01_9000003146_21344cztM0_level2_quad_clean.evt |
| Size (bytes) | 807,459,840 | 145,365,120 |
| Size | 770.1 MB | 138.6 MB |
| Events in quadrant A | 5,697,688 | 912,703 |
| Events in quadrant B | 5,506,192 | 933,258 |
| Events in quadrant C | 5,432,742 | 888,459 |
| Events in quadrant D | 7,034,736 | 868,417 |
| Mode M0 | |||
|---|---|---|---|
| Quadrant | BADHDUFLAG | Total packets | Discarded packets |
| A | 0 | 23914 | 2 |
| B | 0 | 23823 | 2 |
| C | 0 | 23550 | 2 |
| D | 0 | 28678 | 2 |
| Mode M9 | |||
|---|---|---|---|
| Quadrant | BADHDUFLAG | Total packets | Discarded packets |
| A | 0 | 9 | 0 |
| B | 0 | 9 | 0 |
| C | 0 | 9 | 0 |
| D | 0 | 9 | 0 |
| Mode SS | |||
|---|---|---|---|
| Quadrant | BADHDUFLAG | Total packets | Discarded packets |
| A | 0 | 234 | 0 |
| B | 0 | 234 | 0 |
| C | 0 | 234 | 0 |
| D | 0 | 234 | 0 |
| Quadrant | Total seconds | Saturated seconds | Saturation percentage |
|---|---|---|---|
| A | 11562 | 50 | 0.432451% |
| B | 11563 | 91 | 0.786993% |
| C | 11563 | 158 | 1.366427% |
| D | 11563 | 238 | 2.058289% |
Noise dominated data is calculated using 1-second bins in cleaned event files. If a bin has >2000 counts, and if more than 50% of those come from <1% of pixels, then it is considered to be noise-dominated and hence unusable.
| Quadrant | # 1 sec bins | Bins with >0 counts | Bins with >2000 counts | High rate bins dominated by noise | Noise dominated (total time) | Noise dominated (detector-on time) | Marked lightcurve |
|---|---|---|---|---|---|---|---|
| A | 12442 | 11565 | 0 | 0 | 0.00% | 0.00% | 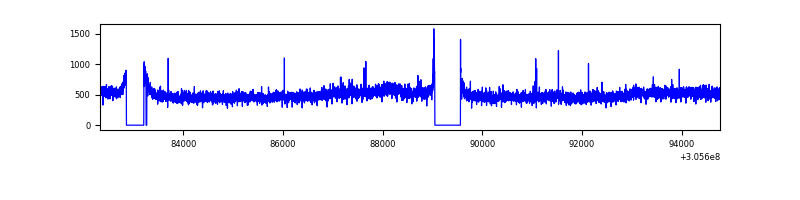 |
| B | 12443 | 11566 | 4 | 4 | 0.03% | 0.03% | 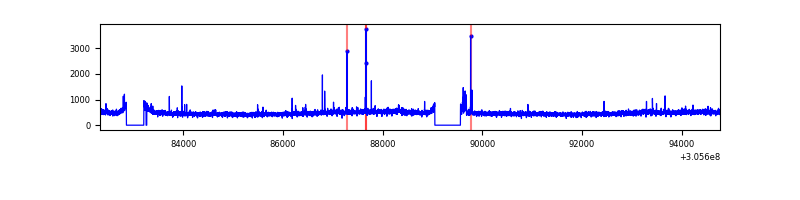 |
| C | 12443 | 11565 | 1 | 1 | 0.01% | 0.01% | 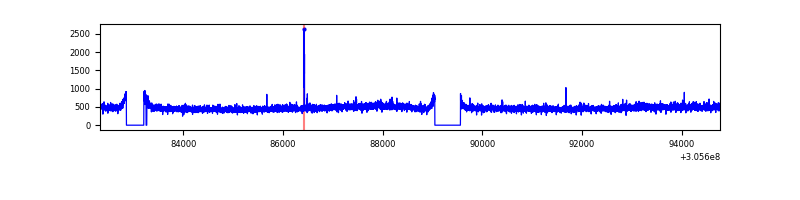 |
| D | 12443 | 11566 | 184 | 184 | 1.48% | 1.59% | 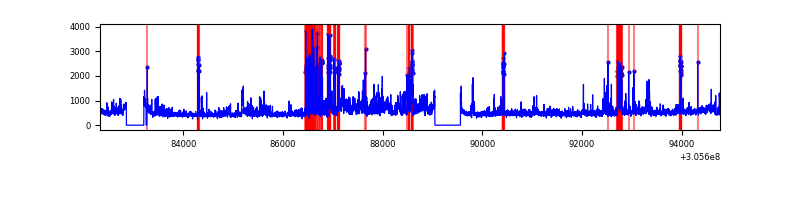 |
Top three noisy pixels from each quadrant. If the there are fewer than three noisy pixels in the level2.evt file, extra rows are filled as -1
| Pixel properties | Quadrant properties | ||||||
|---|---|---|---|---|---|---|---|
| Quadrant | DetID | PixID | Counts | Sigma | Mean | Median | Sigma |
| A | 5 | 168 | 360943 | 1305.43 | 1376 | 1347 | 275.5 |
| A | 5 | 16 | 18342 | 61.7 | 1376 | 1347 | 275.5 |
| A | 13 | 254 | 15260 | 50.51 | 1376 | 1347 | 275.5 |
| B | 0 | 230 | 53334 | 197.36 | 1373 | 1337 | 263.5 |
| B | 12 | 111 | 32877 | 119.72 | 1373 | 1337 | 263.5 |
| B | 3 | 64 | 30828 | 111.94 | 1373 | 1337 | 263.5 |
| C | 14 | 238 | 210885 | 674.15 | 1327 | 1332 | 310.8 |
| C | 7 | 247 | 24660 | 75.05 | 1327 | 1332 | 310.8 |
| C | 10 | 23 | 18991 | 56.81 | 1327 | 1332 | 310.8 |
| D | 1 | 52 | 958526 | 2962.98 | 1331 | 1293 | 323.1 |
| D | 7 | 238 | 321695 | 991.76 | 1331 | 1293 | 323.1 |
| D | 13 | 174 | 255286 | 786.2 | 1331 | 1293 | 323.1 |
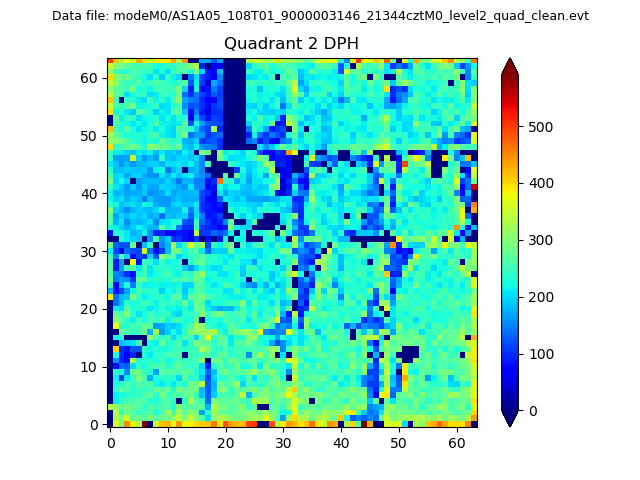
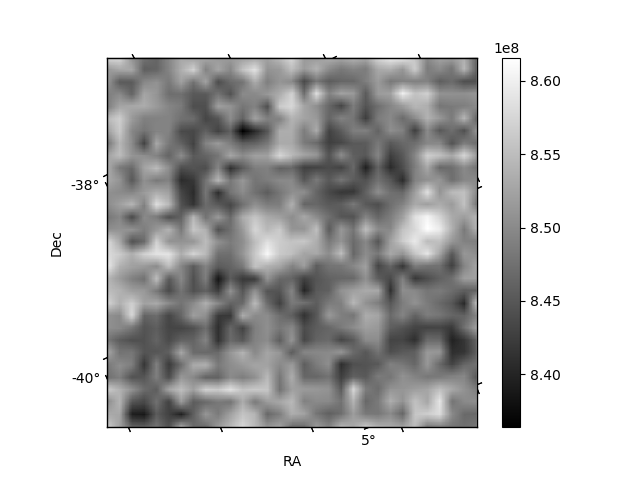
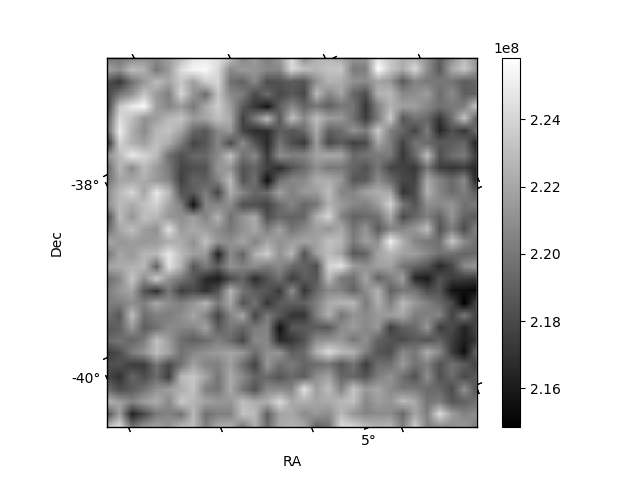
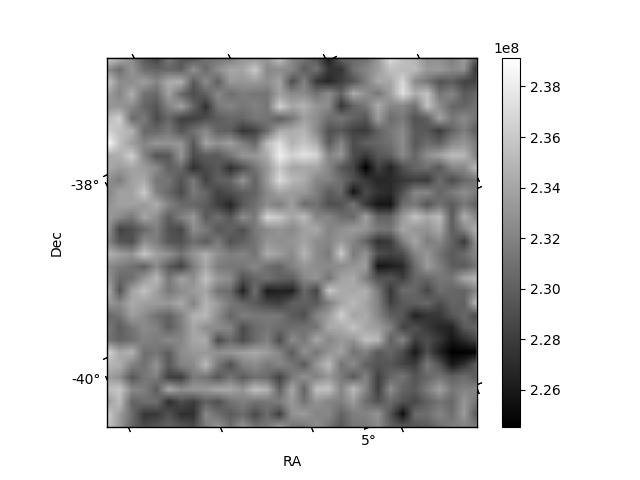
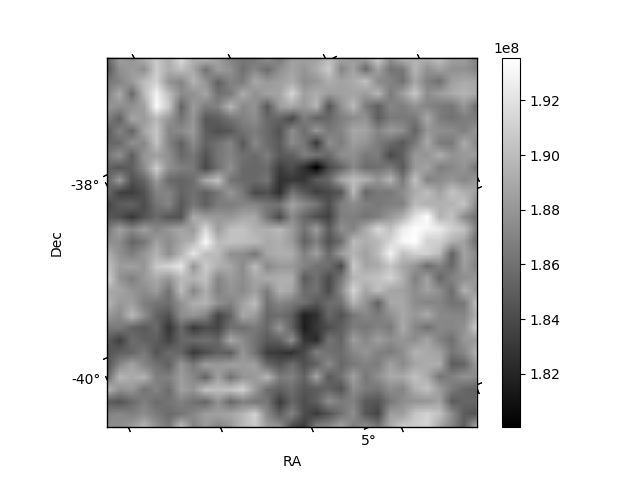
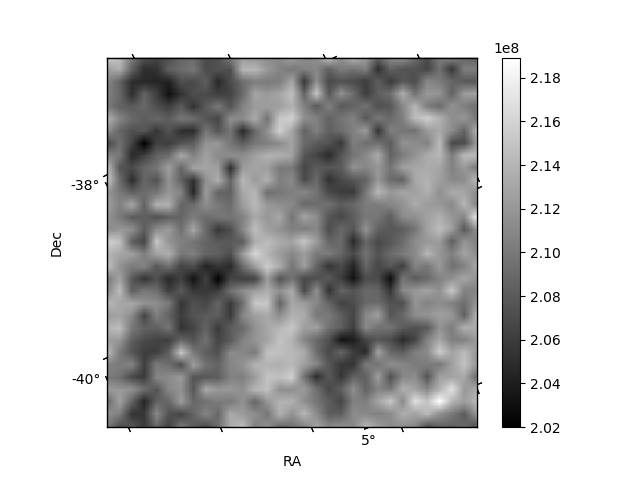
Histogram calculated using DETX and DETY for each event in the final _common_clean file
| Quadrant A | 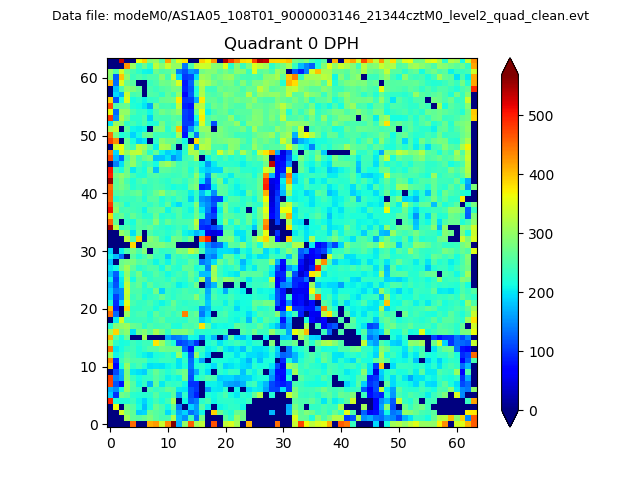 |
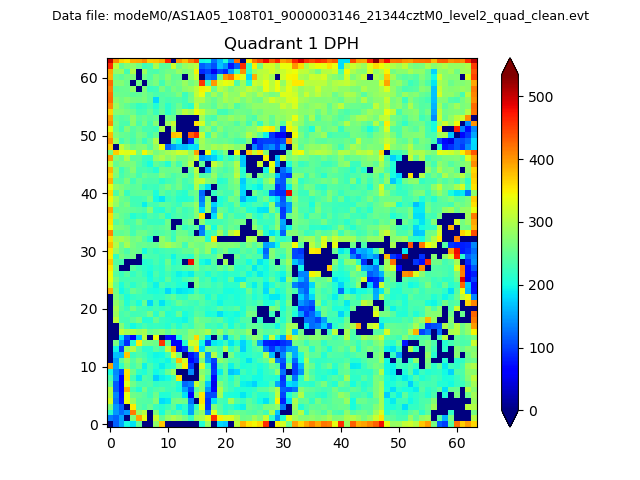 |
Quadrant B |
|---|---|---|---|
| Quadrant D | 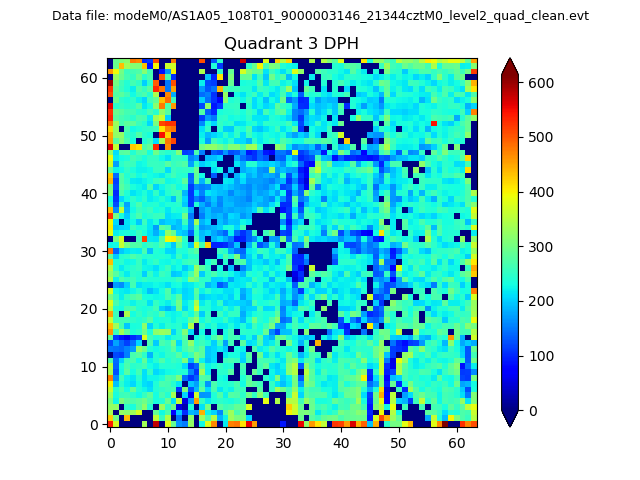 |
 |
Quadrant C |
| Plot type | Count rate plots | Images |
|---|---|---|
| Comparison with Poisson distribution Blue bars denote a histogram of data divided into 1 sec bins. Red curve is a Poisson curve with rate = median count rate of data. |
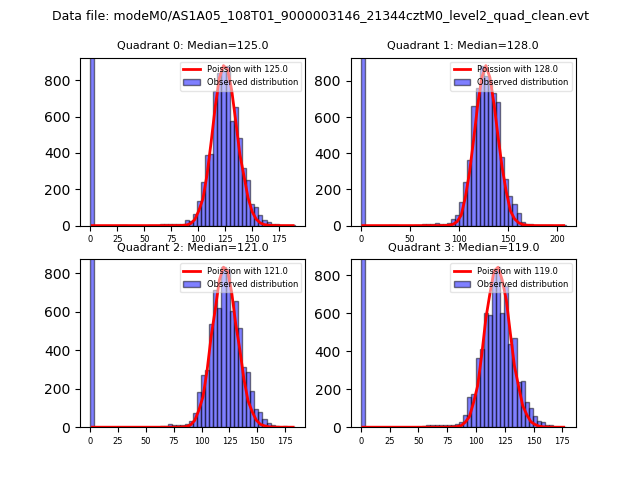 |
 |
| Quadrant-wise count rates Data is divided into 100 sec bins |
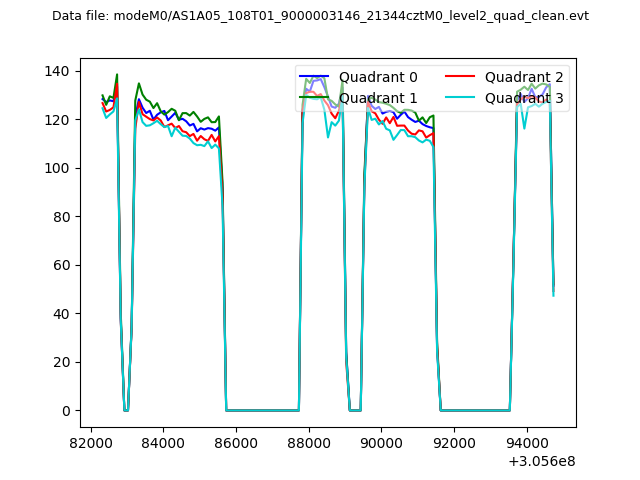 |
|
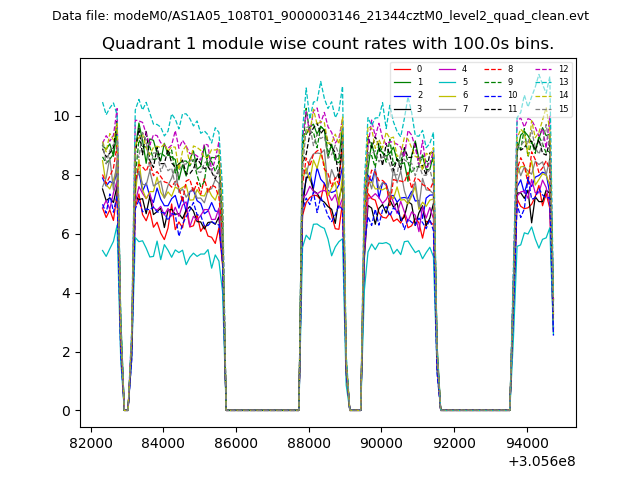
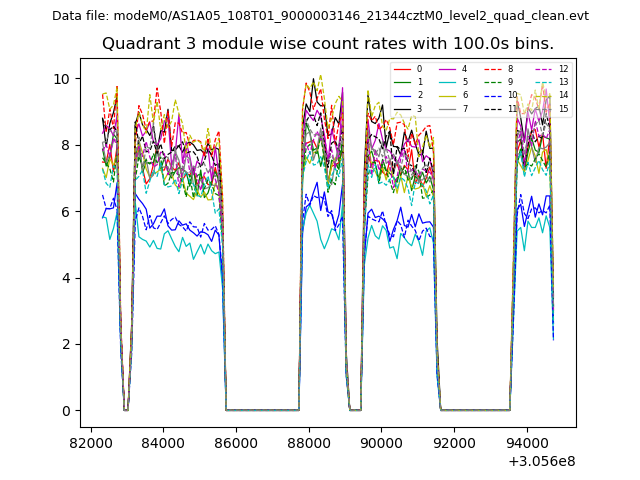
| Module-wise count rates for Quadrant A Data is divided into 100 sec bins |
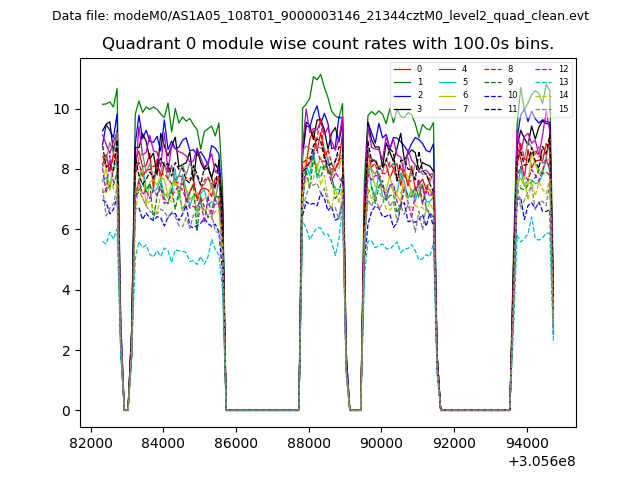 |
 |
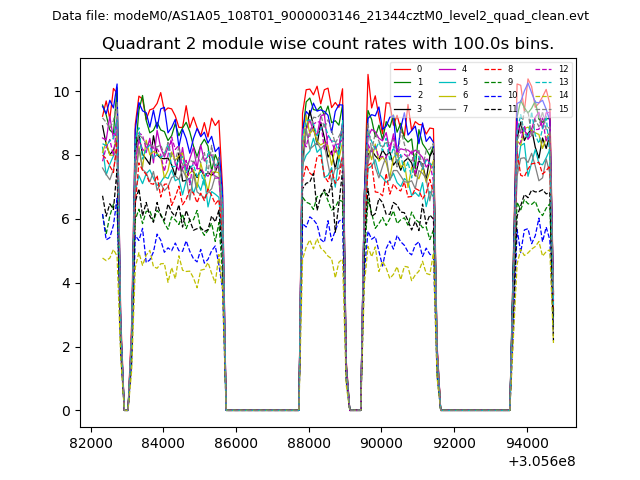
| Module-wise count rates for Quadrant B Data is divided into 100 sec bins |
 |
 |
| Module-wise count rates for Quadrant C Data is divided into 100 sec bins |
 |
 |
| Module-wise count rates for Quadrant D Data is divided into 100 sec bins |
 |
 |
| Parameter | Plot |
|---|---|
| CZT HV Monitor | 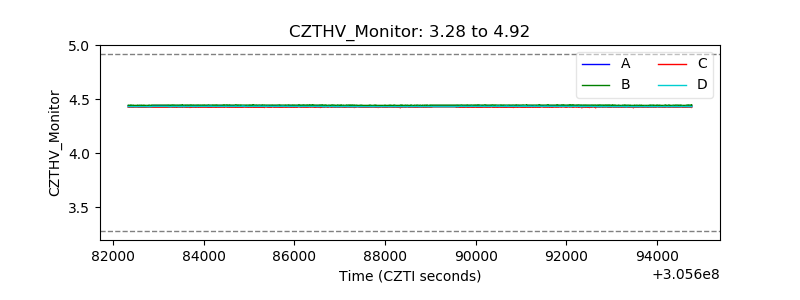 |
| D_VDD |  |
| Temperature 1 |  |
| Veto HV Monitor | 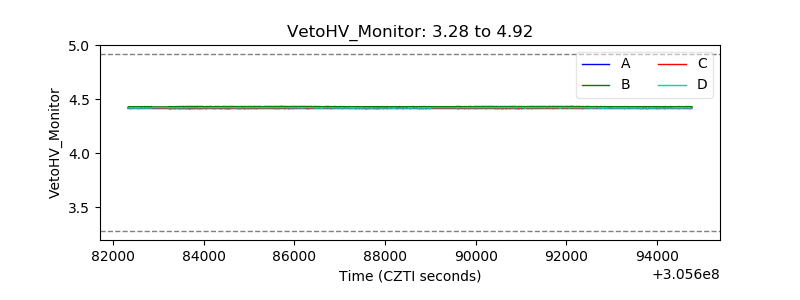 |
| Veto LLD | 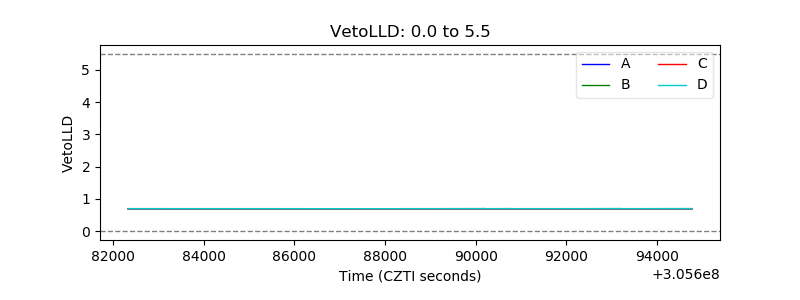 |
| Alpha Counter | 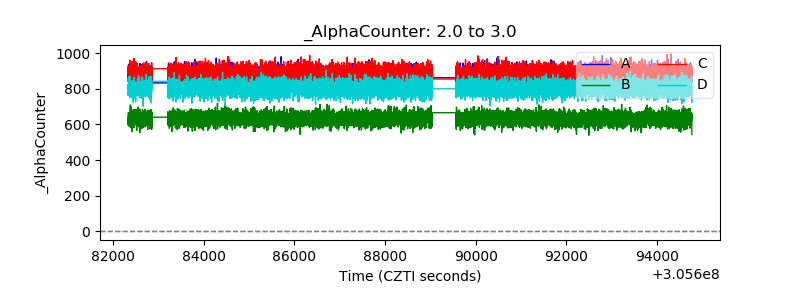 |
| _CPM_Rate | 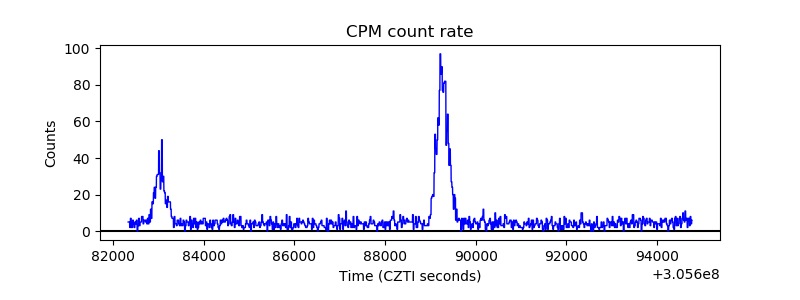 |
| CZT Counter | 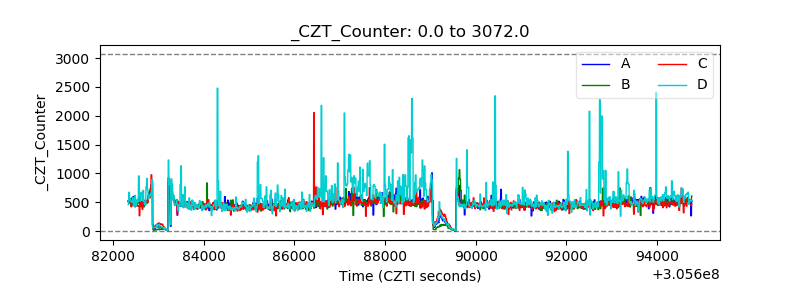 |
| +2.5 Volts monitor | 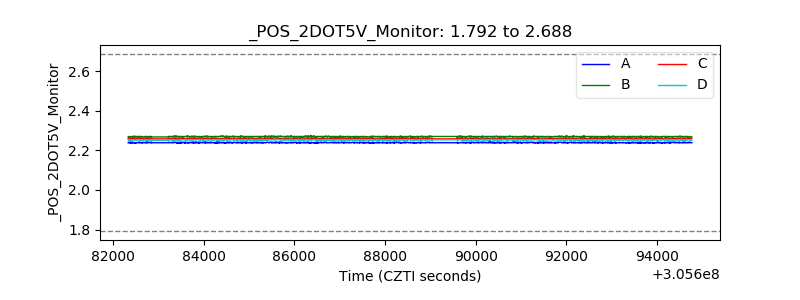 |
| +5 Volts monitor |  |
| _ROLL_ROT | 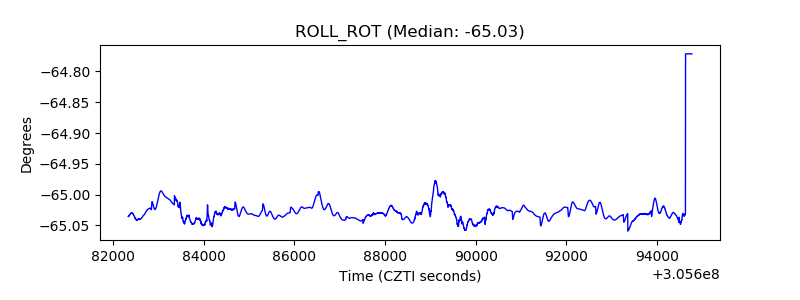 |
| _Roll_DEC | 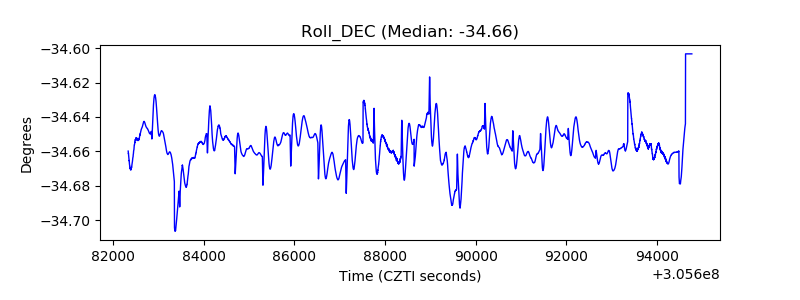 |
| _Roll_RA | 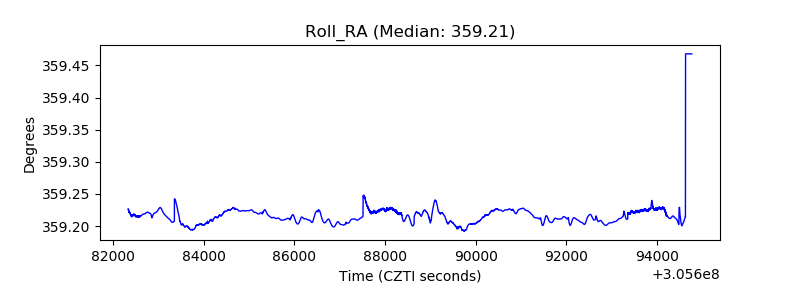 |
| Veto Counter | 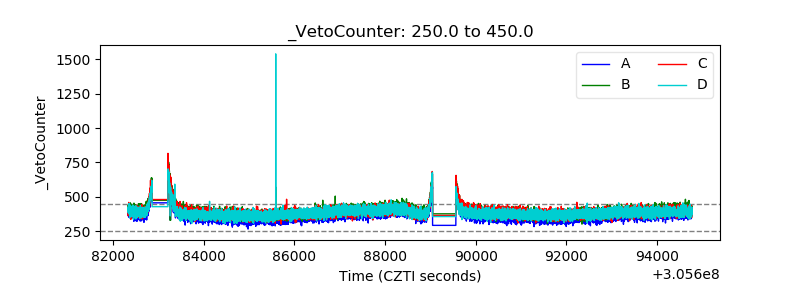 |