| Param | Original file | Final file |
|---|---|---|
| Filename | modeM0/AS1A05_041T01_9000003150_21349cztM0_level2.evt | modeM0/AS1A05_041T01_9000003150_21349cztM0_level2_quad_clean.evt |
| Size (bytes) | 257,469,120 | 20,923,200 |
| Size | 245.5 MB | 20.0 MB |
| Events in quadrant A | 1,302,635 | 123,434 |
| Events in quadrant B | 1,309,516 | 124,264 |
| Events in quadrant C | 1,256,362 | 119,873 |
| Events in quadrant D | 3,780,479 | 108,368 |
| Mode SS | |||
|---|---|---|---|
| Quadrant | BADHDUFLAG | Total packets | Discarded packets |
| A | 0 | 46 | 0 |
| B | 0 | 46 | 0 |
| C | 0 | 46 | 0 |
| D | 0 | 46 | 0 |
| Mode M0 | |||
|---|---|---|---|
| Quadrant | BADHDUFLAG | Total packets | Discarded packets |
| A | 0 | 5438 | 1 |
| B | 0 | 5386 | 1 |
| C | 0 | 5192 | 1 |
| D | 0 | 12738 | 5 |
| Mode M9 | |||
|---|---|---|---|
| Quadrant | BADHDUFLAG | Total packets | Discarded packets |
| A | 0 | 13 | 0 |
| B | 0 | 13 | 0 |
| C | 0 | 13 | 0 |
| D | 0 | 13 | 0 |
| Quadrant | Total seconds | Saturated seconds | Saturation percentage |
|---|---|---|---|
| A | 2167 | 88 | 4.060914% |
| B | 2167 | 100 | 4.614675% |
| C | 2167 | 101 | 4.660821% |
| D | 2166 | 655 | 30.240074% |
Noise dominated data is calculated using 1-second bins in cleaned event files. If a bin has >2000 counts, and if more than 50% of those come from <1% of pixels, then it is considered to be noise-dominated and hence unusable.
| Quadrant | # 1 sec bins | Bins with >0 counts | Bins with >2000 counts | High rate bins dominated by noise | Noise dominated (total time) | Noise dominated (detector-on time) | Marked lightcurve |
|---|---|---|---|---|---|---|---|
| A | 3427 | 2167 | 0 | 0 | 0.00% | 0.00% | 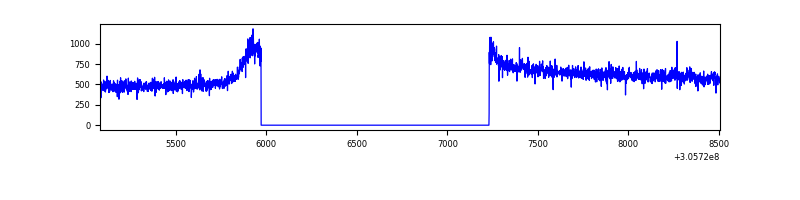 |
| B | 3427 | 2167 | 4 | 4 | 0.12% | 0.18% | 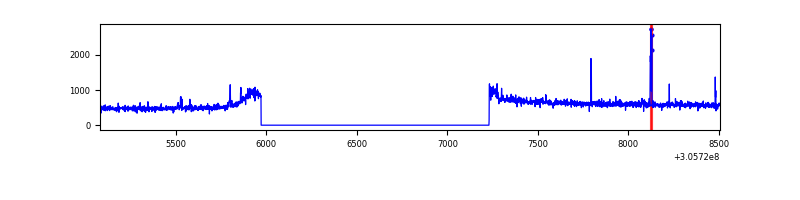 |
| C | 3427 | 2167 | 0 | 0 | 0.00% | 0.00% | 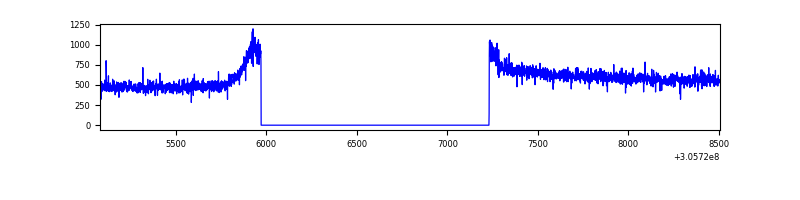 |
| D | 3426 | 2166 | 431 | 431 | 12.58% | 19.90% | 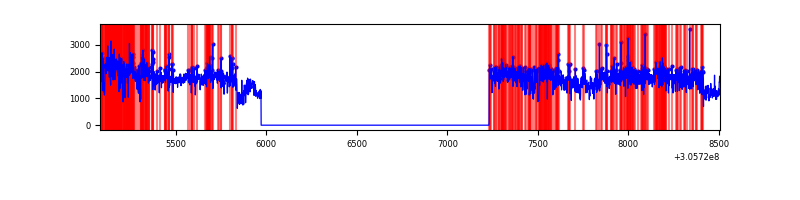 |
Top three noisy pixels from each quadrant. If the there are fewer than three noisy pixels in the level2.evt file, extra rows are filled as -1
| Pixel properties | Quadrant properties | ||||||
|---|---|---|---|---|---|---|---|
| Quadrant | DetID | PixID | Counts | Sigma | Mean | Median | Sigma |
| A | 5 | 168 | 31245 | 462.71 | 329 | 323 | 66.8 |
| A | 11 | 47 | 3207 | 43.16 | 329 | 323 | 66.8 |
| A | 13 | 254 | 3030 | 40.51 | 329 | 323 | 66.8 |
| B | 3 | 64 | 30839 | 487.74 | 321 | 314 | 62.6 |
| B | 0 | 230 | 10304 | 159.62 | 321 | 314 | 62.6 |
| B | 12 | 111 | 7243 | 110.71 | 321 | 314 | 62.6 |
| C | 14 | 238 | 49666 | 677.94 | 308 | 311 | 72.8 |
| C | 13 | 61 | 2185 | 25.74 | 308 | 311 | 72.8 |
| C | 7 | 247 | 2176 | 25.62 | 308 | 311 | 72.8 |
| D | 13 | 174 | 2493714 | 34333.51 | 299 | 292 | 72.6 |
| D | 1 | 52 | 50424 | 690.3 | 299 | 292 | 72.6 |
| D | 13 | 104 | 38712 | 529.03 | 299 | 292 | 72.6 |
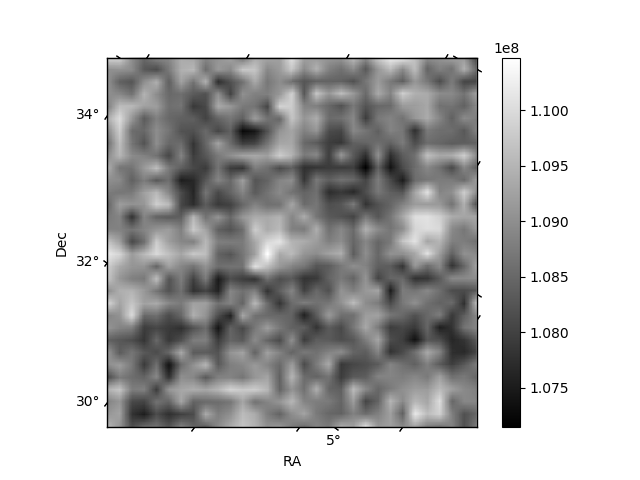
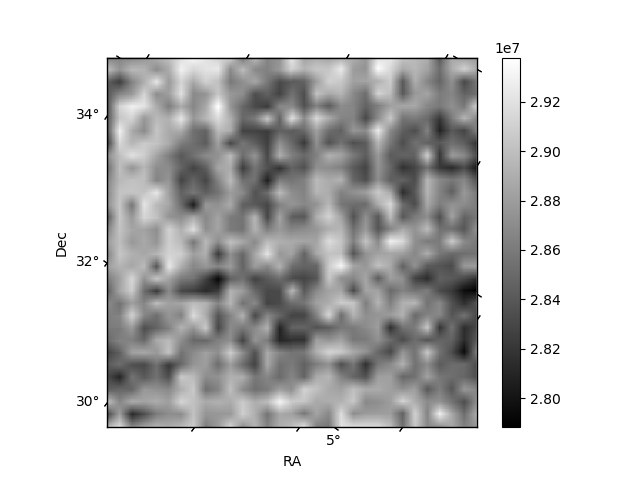
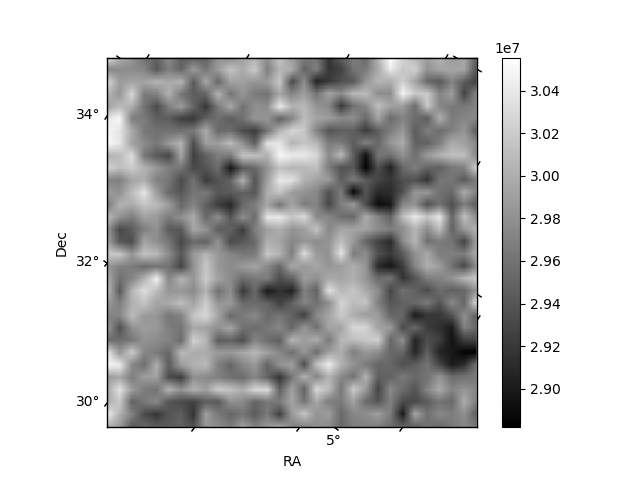
Histogram calculated using DETX and DETY for each event in the final _common_clean file
| Quadrant A | 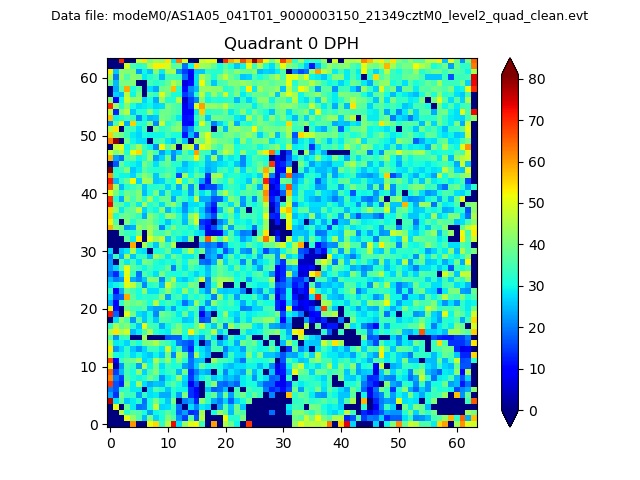 |
 |
Quadrant B |
|---|---|---|---|
| Quadrant D | 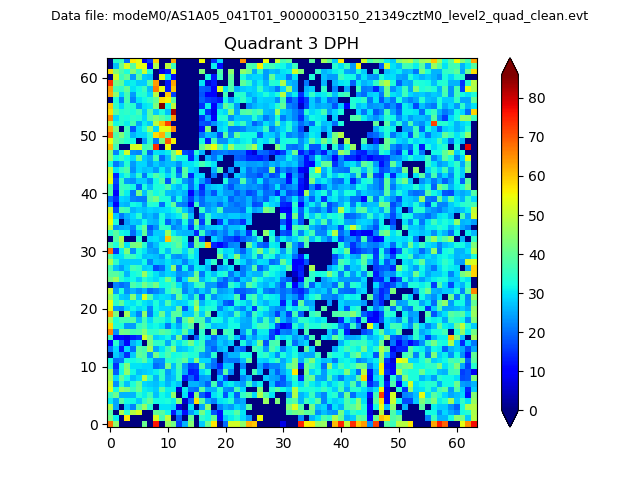 |
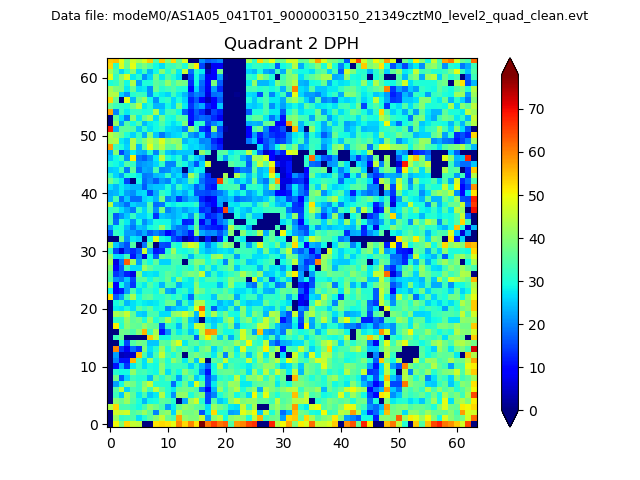 |
Quadrant C |
| Plot type | Count rate plots | Images |
|---|---|---|
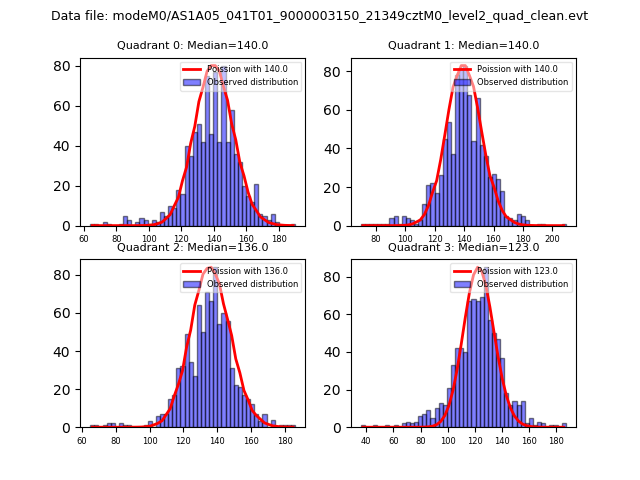
| Comparison with Poisson distribution Blue bars denote a histogram of data divided into 1 sec bins. Red curve is a Poisson curve with rate = median count rate of data. |
 |
 |
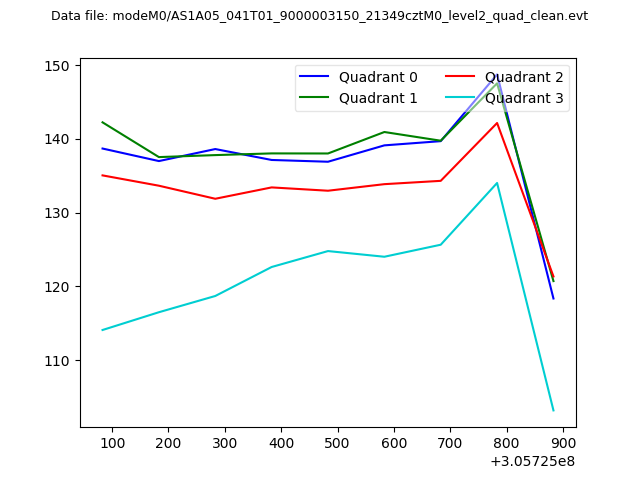
| Quadrant-wise count rates Data is divided into 100 sec bins |
 |
|
| Module-wise count rates for Quadrant A Data is divided into 100 sec bins |
 |
 |
| Module-wise count rates for Quadrant B Data is divided into 100 sec bins |
 |
 |
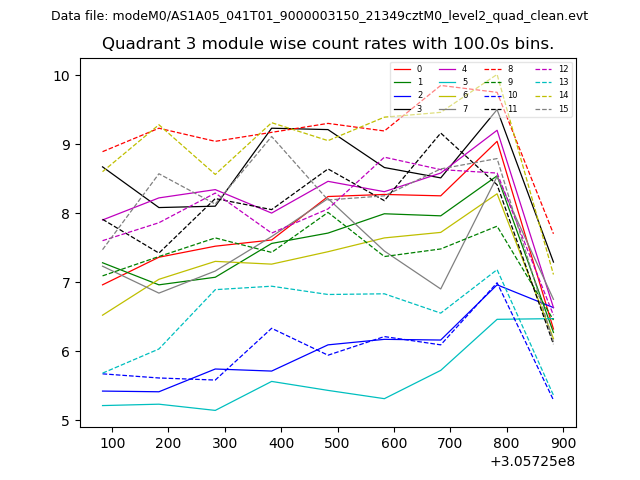
| Module-wise count rates for Quadrant C Data is divided into 100 sec bins |
 |
 |
| Module-wise count rates for Quadrant D Data is divided into 100 sec bins |
 |
 |
| Parameter | Plot |
|---|---|
| CZT HV Monitor |  |
| D_VDD | 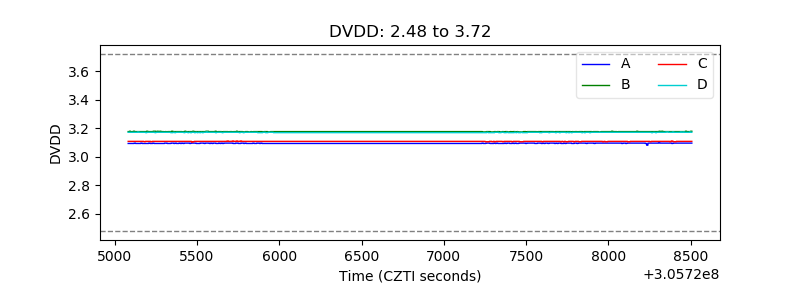 |
| Temperature 1 | 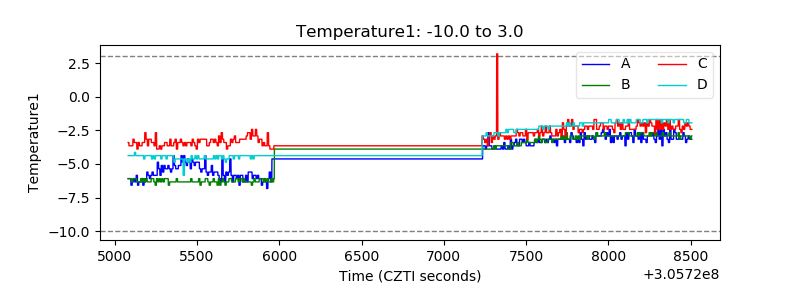 |
| Veto HV Monitor | 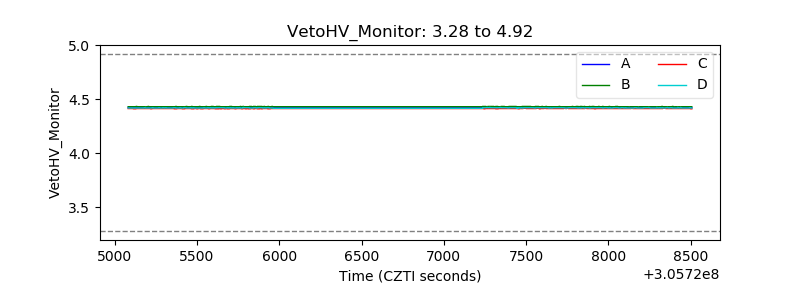 |
| Veto LLD | 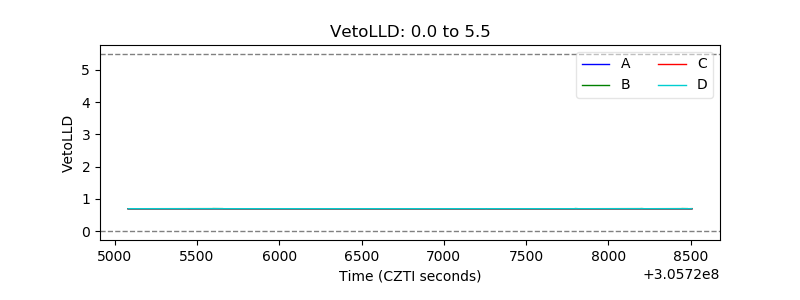 |
| Alpha Counter |  |
| _CPM_Rate | 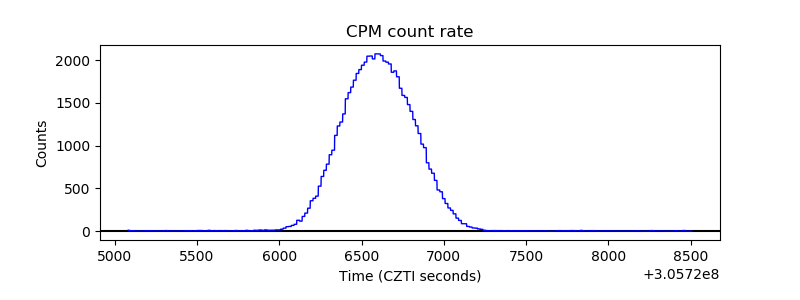 |
| CZT Counter | 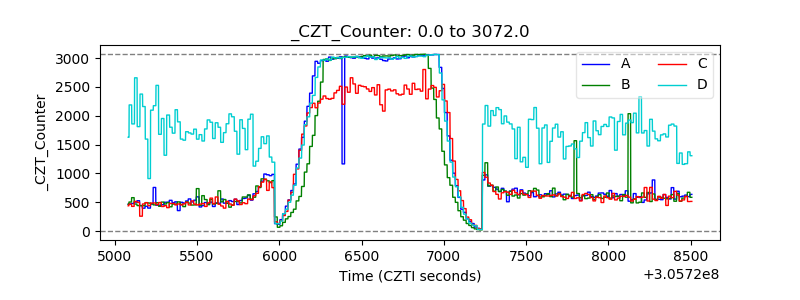 |
| +2.5 Volts monitor |  |
| +5 Volts monitor |  |
| _ROLL_ROT | 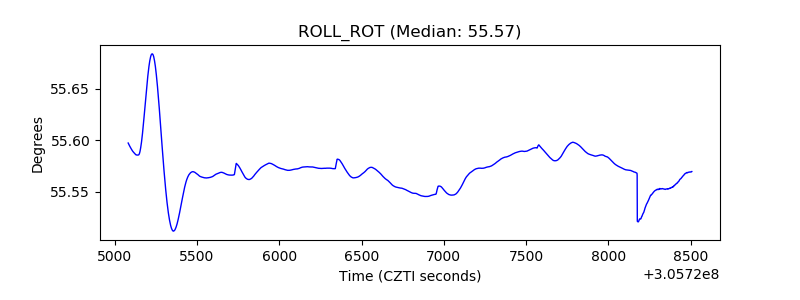 |
| _Roll_DEC | 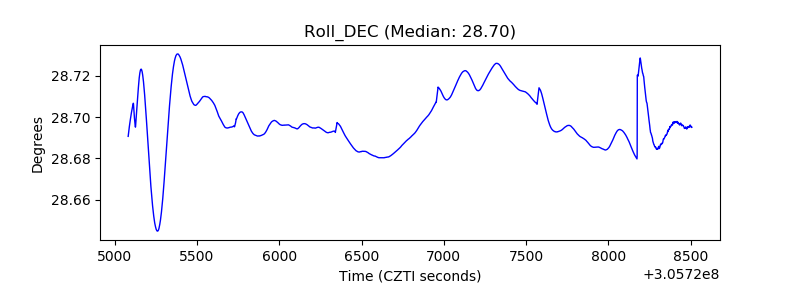 |
| _Roll_RA | 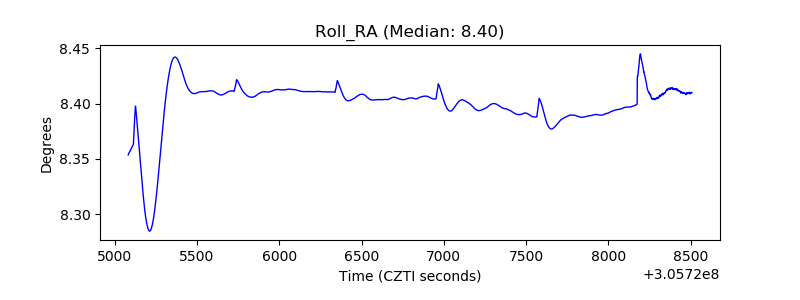 |
| Veto Counter | 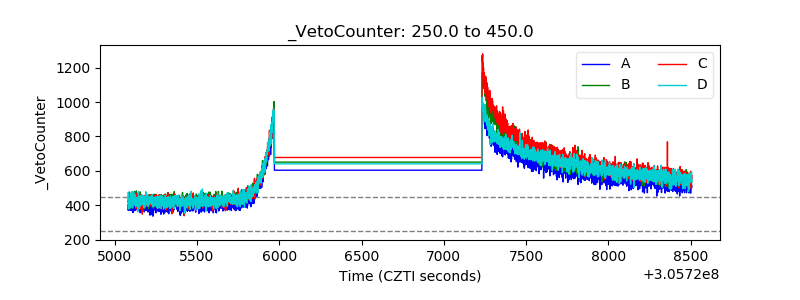 |