| Param | Original file | Final file |
|---|---|---|
| Filename | modeM0/AS1A05_041T01_9000003150_21350cztM0_level2.evt | modeM0/AS1A05_041T01_9000003150_21350cztM0_level2_quad_clean.evt |
| Size (bytes) | 626,192,640 | 78,871,680 |
| Size | 597.2 MB | 75.2 MB |
| Events in quadrant A | 3,519,720 | 504,854 |
| Events in quadrant B | 3,507,200 | 506,691 |
| Events in quadrant C | 3,919,271 | 482,641 |
| Events in quadrant D | 7,597,145 | 459,388 |
| Mode SS | |||
|---|---|---|---|
| Quadrant | BADHDUFLAG | Total packets | Discarded packets |
| A | 0 | 126 | 0 |
| B | 0 | 126 | 0 |
| C | 0 | 126 | 0 |
| D | 0 | 126 | 0 |
| Mode M0 | |||
|---|---|---|---|
| Quadrant | BADHDUFLAG | Total packets | Discarded packets |
| A | 0 | 14519 | 2 |
| B | 0 | 14427 | 2 |
| C | 0 | 15822 | 2 |
| D | 0 | 26899 | 2 |
| Mode M9 | |||
|---|---|---|---|
| Quadrant | BADHDUFLAG | Total packets | Discarded packets |
| A | 0 | 22 | 0 |
| B | 0 | 23 | 0 |
| C | 0 | 23 | 0 |
| D | 0 | 23 | 0 |
| Quadrant | Total seconds | Saturated seconds | Saturation percentage |
|---|---|---|---|
| A | 6229 | 130 | 2.087012% |
| B | 6229 | 146 | 2.343875% |
| C | 6229 | 215 | 3.451597% |
| D | 6229 | 1003 | 16.102103% |
Noise dominated data is calculated using 1-second bins in cleaned event files. If a bin has >2000 counts, and if more than 50% of those come from <1% of pixels, then it is considered to be noise-dominated and hence unusable.
| Quadrant | # 1 sec bins | Bins with >0 counts | Bins with >2000 counts | High rate bins dominated by noise | Noise dominated (total time) | Noise dominated (detector-on time) | Marked lightcurve |
|---|---|---|---|---|---|---|---|
| A | 7524 | 6229 | 0 | 0 | 0.00% | 0.00% | 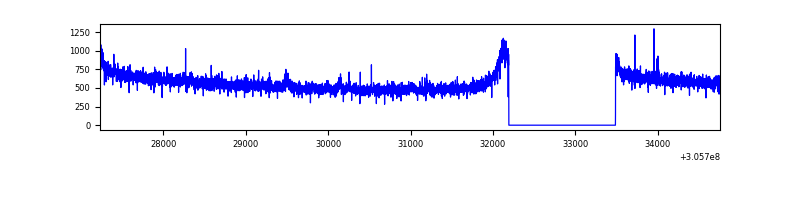 |
| B | 7524 | 6229 | 6 | 6 | 0.08% | 0.10% |  |
| C | 7524 | 6229 | 7 | 7 | 0.09% | 0.11% | 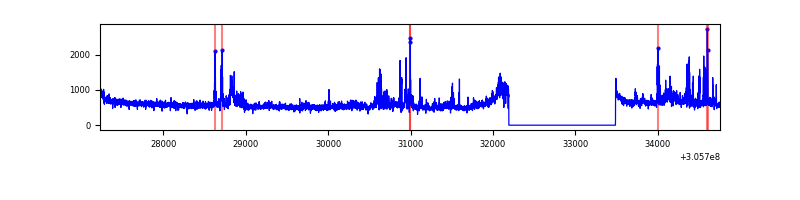 |
| D | 7524 | 6229 | 629 | 629 | 8.36% | 10.10% | 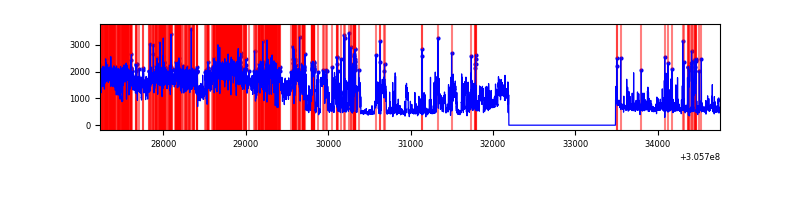 |
Top three noisy pixels from each quadrant. If the there are fewer than three noisy pixels in the level2.evt file, extra rows are filled as -1
| Pixel properties | Quadrant properties | ||||||
|---|---|---|---|---|---|---|---|
| Quadrant | DetID | PixID | Counts | Sigma | Mean | Median | Sigma |
| A | 5 | 168 | 74155 | 419.28 | 886 | 870 | 174.8 |
| A | 9 | 143 | 12570 | 66.94 | 886 | 870 | 174.8 |
| A | 15 | 174 | 10732 | 56.42 | 886 | 870 | 174.8 |
| B | 0 | 197 | 34738 | 206.88 | 873 | 853 | 163.8 |
| B | 3 | 64 | 27676 | 163.76 | 873 | 853 | 163.8 |
| B | 0 | 230 | 21483 | 125.95 | 873 | 853 | 163.8 |
| C | 3 | 233 | 502413 | 2594.83 | 841 | 849 | 193.3 |
| C | 14 | 238 | 134425 | 691.05 | 841 | 849 | 193.3 |
| C | 13 | 61 | 5876 | 26.01 | 841 | 849 | 193.3 |
| D | 13 | 174 | 3874762 | 19420.18 | 833 | 811 | 199.5 |
| D | 1 | 52 | 311803 | 1559.01 | 833 | 811 | 199.5 |
| D | 13 | 104 | 98984 | 492.14 | 833 | 811 | 199.5 |
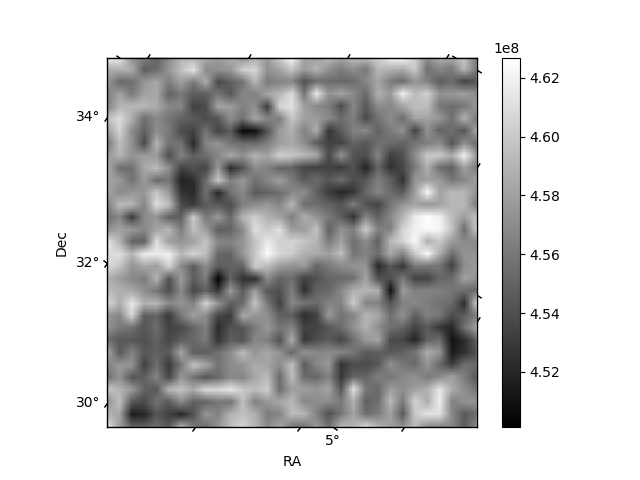
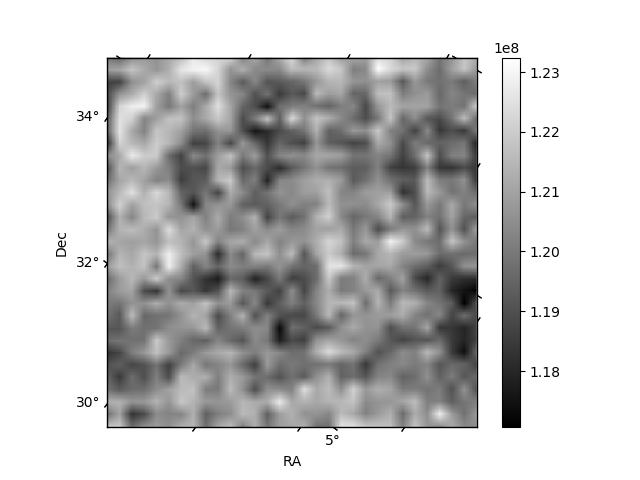
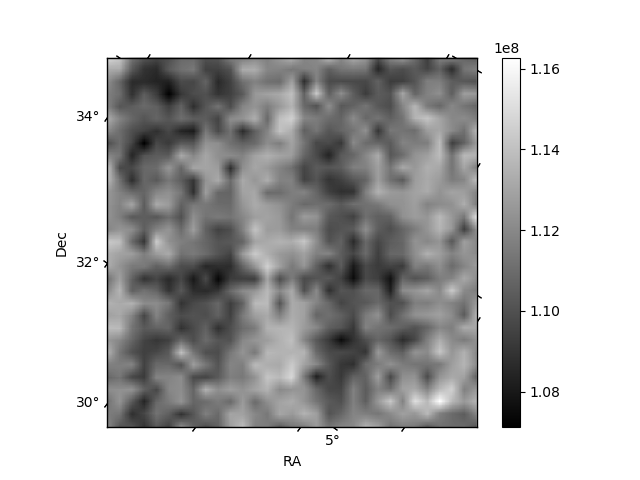
Histogram calculated using DETX and DETY for each event in the final _common_clean file
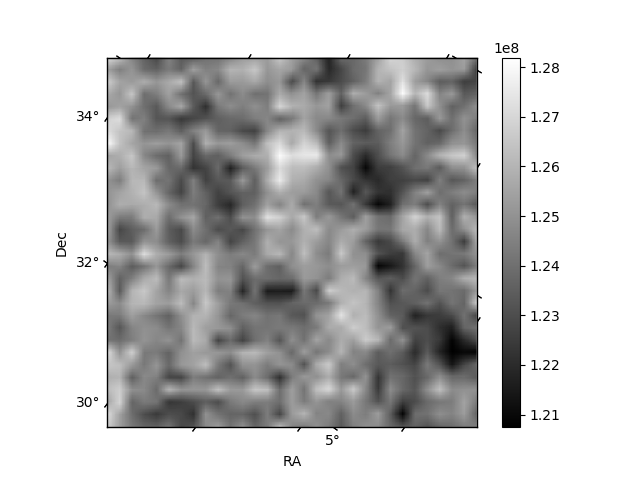
| Quadrant A |  |
 |
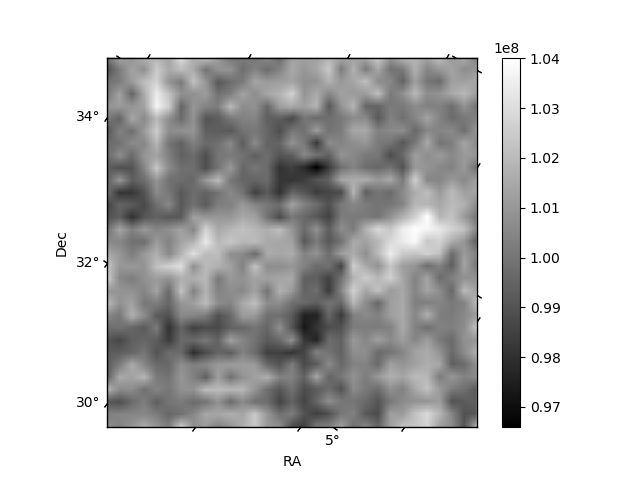
Quadrant B |
|---|---|---|---|
| Quadrant D | 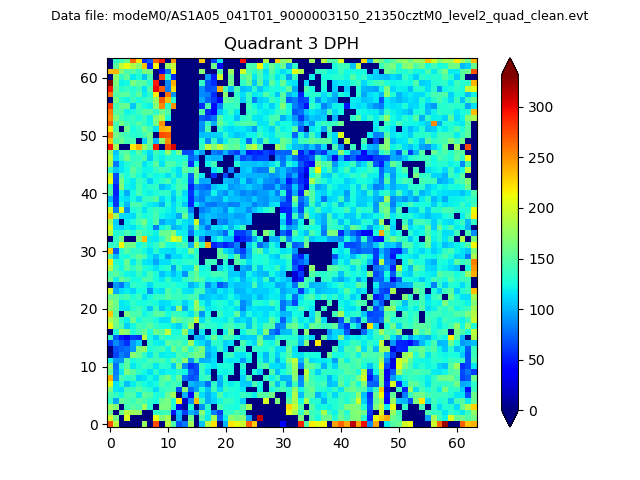 |
 |
Quadrant C |
| Plot type | Count rate plots | Images |
|---|---|---|
| Comparison with Poisson distribution Blue bars denote a histogram of data divided into 1 sec bins. Red curve is a Poisson curve with rate = median count rate of data. |
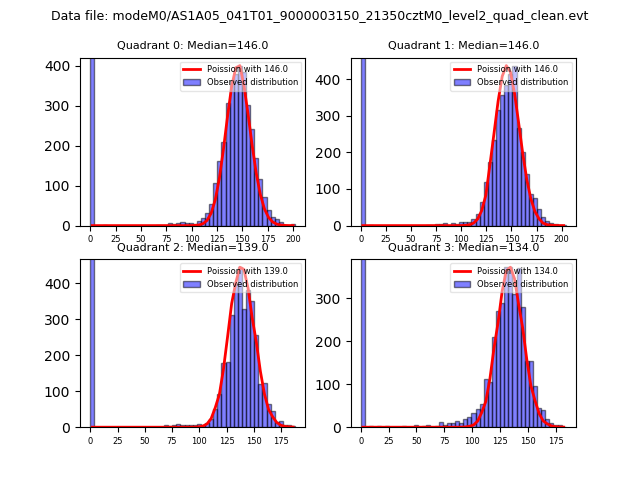 |
 |
| Quadrant-wise count rates Data is divided into 100 sec bins |
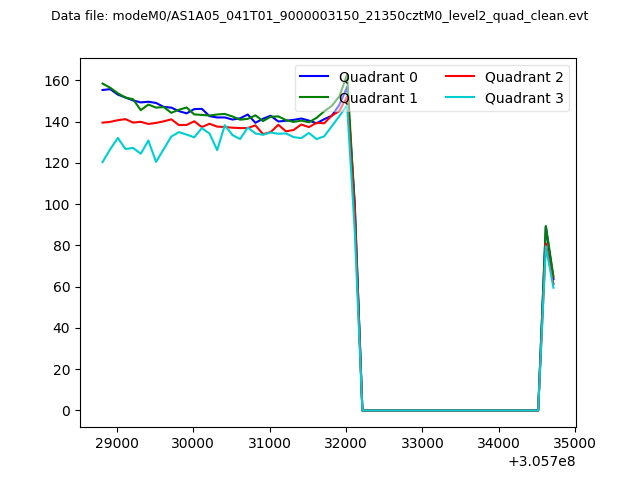 |
|
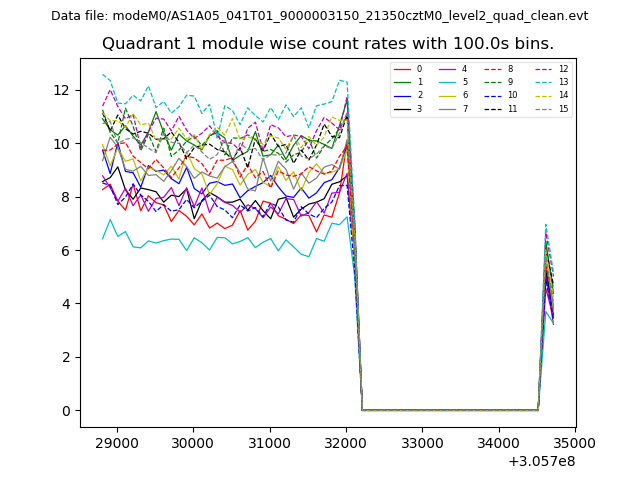
| Module-wise count rates for Quadrant A Data is divided into 100 sec bins |
 |
 |
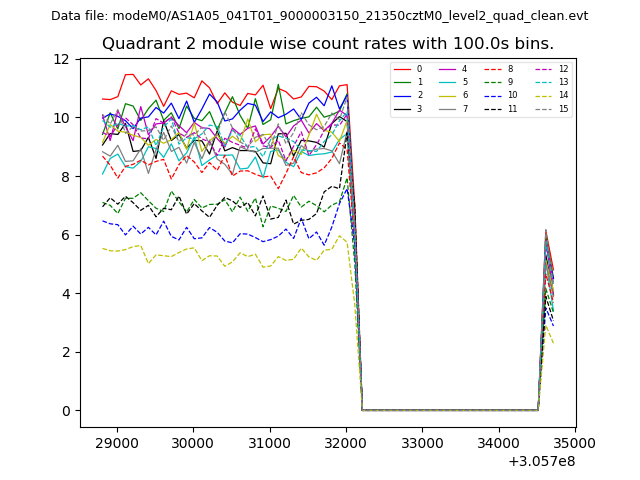
| Module-wise count rates for Quadrant B Data is divided into 100 sec bins |
 |
 |
| Module-wise count rates for Quadrant C Data is divided into 100 sec bins |
 |
 |
| Module-wise count rates for Quadrant D Data is divided into 100 sec bins |
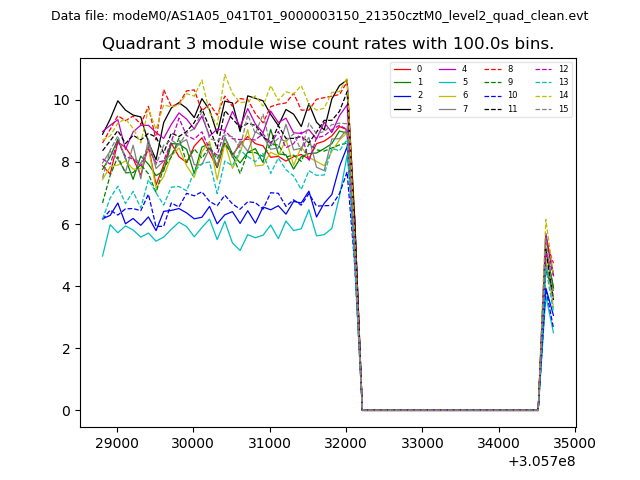 |
 |
| Parameter | Plot |
|---|---|
| CZT HV Monitor |  |
| D_VDD | 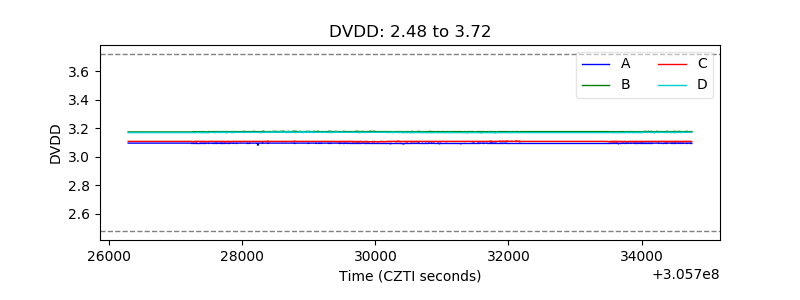 |
| Temperature 1 | 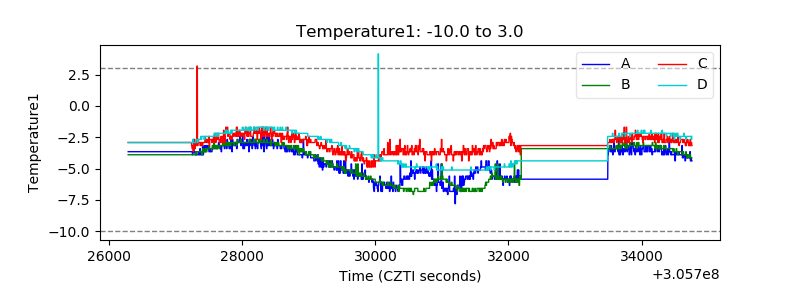 |
| Veto HV Monitor | 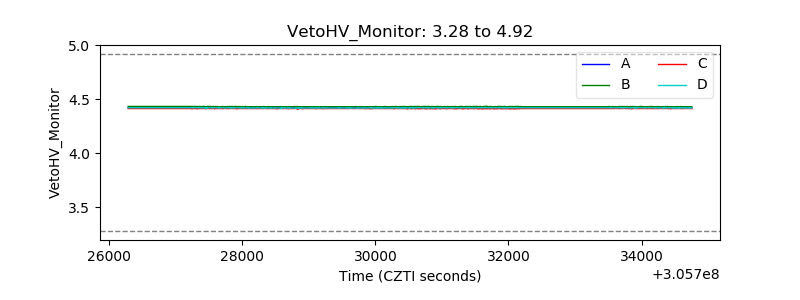 |
| Veto LLD | 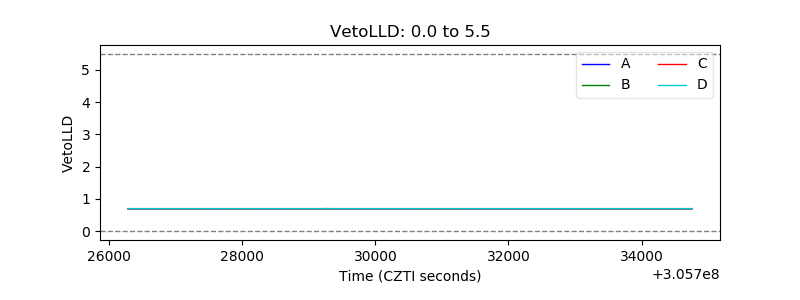 |
| Alpha Counter | 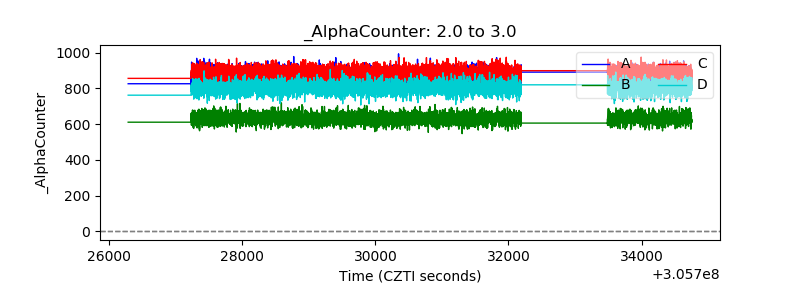 |
| _CPM_Rate | 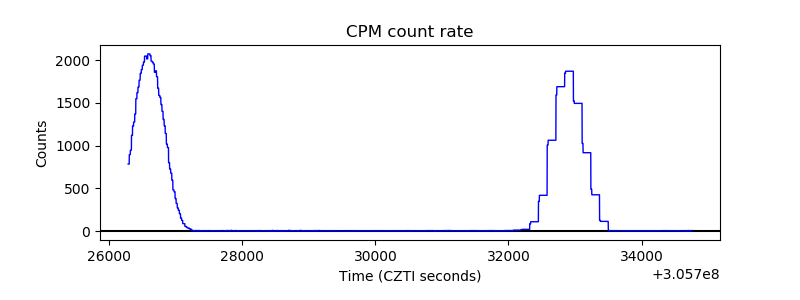 |
| CZT Counter |  |
| +2.5 Volts monitor |  |
| +5 Volts monitor |  |
| _ROLL_ROT | 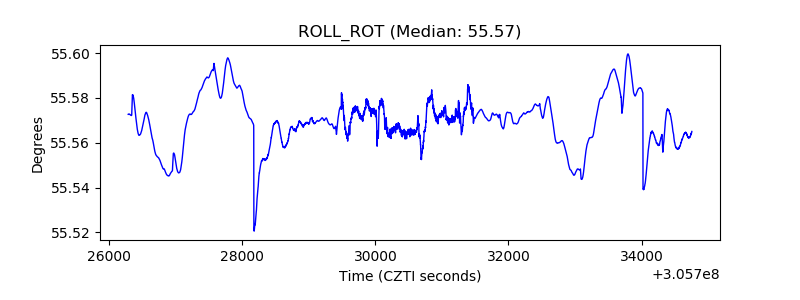 |
| _Roll_DEC | 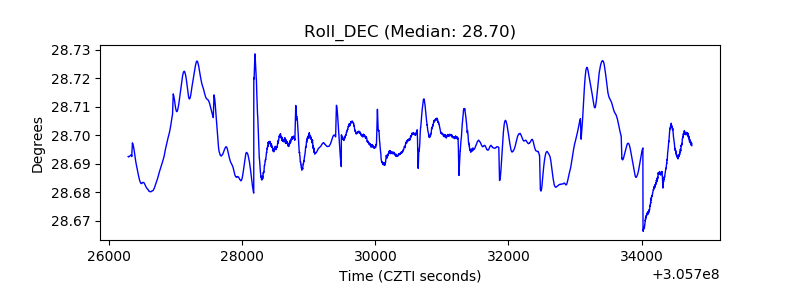 |
| _Roll_RA | 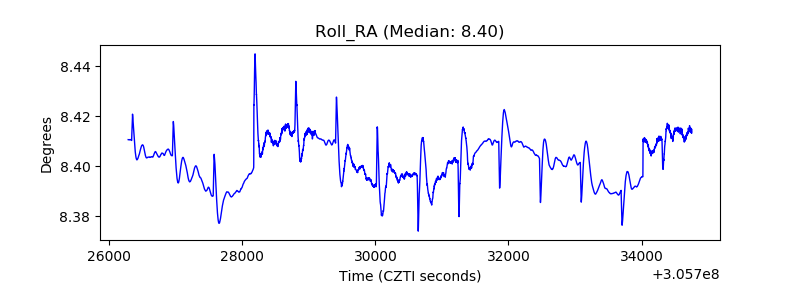 |
| Veto Counter | 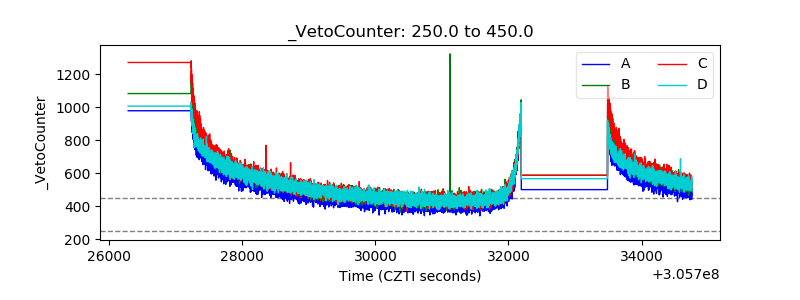 |