| Param | Original file | Final file |
|---|---|---|
| Filename | modeM0/AS1A05_041T01_9000003150_21351cztM0_level2.evt | modeM0/AS1A05_041T01_9000003150_21351cztM0_level2_quad_clean.evt |
| Size (bytes) | 619,971,840 | 89,179,200 |
| Size | 591.3 MB | 85.0 MB |
| Events in quadrant A | 3,566,806 | 594,414 |
| Events in quadrant B | 3,400,139 | 602,822 |
| Events in quadrant C | 4,433,833 | 567,283 |
| Events in quadrant D | 6,954,077 | 501,754 |
| Mode SS | |||
|---|---|---|---|
| Quadrant | BADHDUFLAG | Total packets | Discarded packets |
| A | 0 | 126 | 0 |
| B | 0 | 126 | 0 |
| C | 0 | 126 | 0 |
| D | 0 | 126 | 0 |
| Mode M0 | |||
|---|---|---|---|
| Quadrant | BADHDUFLAG | Total packets | Discarded packets |
| A | 0 | 14603 | 2 |
| B | 0 | 14074 | 2 |
| C | 0 | 17475 | 3 |
| D | 0 | 24993 | 2 |
| Mode M9 | |||
|---|---|---|---|
| Quadrant | BADHDUFLAG | Total packets | Discarded packets |
| A | 0 | 13 | 0 |
| B | 0 | 14 | 0 |
| C | 0 | 14 | 0 |
| D | 0 | 14 | 0 |
| Quadrant | Total seconds | Saturated seconds | Saturation percentage |
|---|---|---|---|
| A | 6216 | 99 | 1.592664% |
| B | 6216 | 132 | 2.123552% |
| C | 6215 | 303 | 4.875302% |
| D | 6215 | 1881 | 30.265487% |
Noise dominated data is calculated using 1-second bins in cleaned event files. If a bin has >2000 counts, and if more than 50% of those come from <1% of pixels, then it is considered to be noise-dominated and hence unusable.
| Quadrant | # 1 sec bins | Bins with >0 counts | Bins with >2000 counts | High rate bins dominated by noise | Noise dominated (total time) | Noise dominated (detector-on time) | Marked lightcurve |
|---|---|---|---|---|---|---|---|
| A | 7501 | 6216 | 0 | 0 | 0.00% | 0.00% | 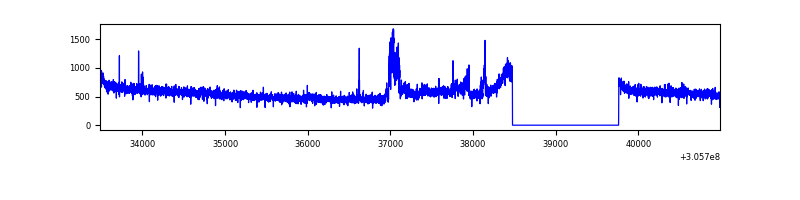 |
| B | 7501 | 6216 | 3 | 3 | 0.04% | 0.05% | 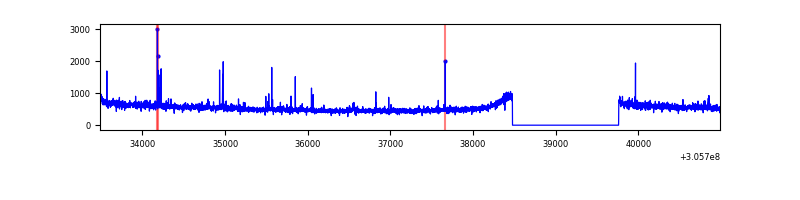 |
| C | 7500 | 6215 | 95 | 95 | 1.27% | 1.53% | 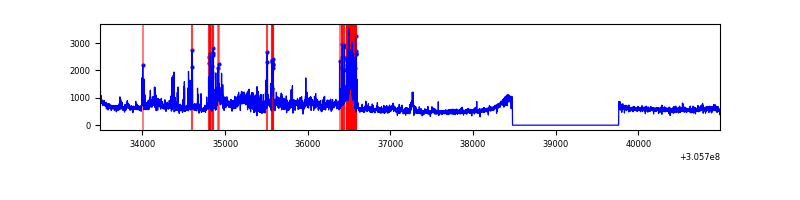 |
| D | 7500 | 6215 | 1456 | 1456 | 19.41% | 23.43% | 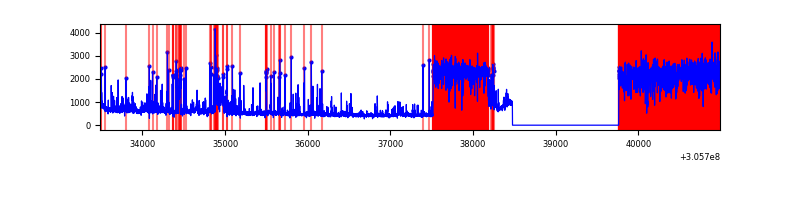 |
Top three noisy pixels from each quadrant. If the there are fewer than three noisy pixels in the level2.evt file, extra rows are filled as -1
| Pixel properties | Quadrant properties | ||||||
|---|---|---|---|---|---|---|---|
| Quadrant | DetID | PixID | Counts | Sigma | Mean | Median | Sigma |
| A | 9 | 143 | 229933 | 1354.82 | 853 | 839 | 169.1 |
| A | 5 | 168 | 47117 | 273.68 | 853 | 839 | 169.1 |
| A | 13 | 254 | 8674 | 46.33 | 853 | 839 | 169.1 |
| B | 0 | 197 | 49236 | 305.59 | 843 | 823 | 158.4 |
| B | 0 | 230 | 27014 | 165.32 | 843 | 823 | 158.4 |
| B | 3 | 64 | 19996 | 121.02 | 843 | 823 | 158.4 |
| C | 3 | 233 | 952970 | 5051.36 | 815 | 824 | 188.5 |
| C | 10 | 23 | 165728 | 874.85 | 815 | 824 | 188.5 |
| C | 14 | 238 | 127591 | 672.53 | 815 | 824 | 188.5 |
| D | 1 | 52 | 1847891 | 10263.36 | 748 | 729 | 180.0 |
| D | 13 | 174 | 1154348 | 6409.84 | 748 | 729 | 180.0 |
| D | 7 | 238 | 890260 | 4942.49 | 748 | 729 | 180.0 |
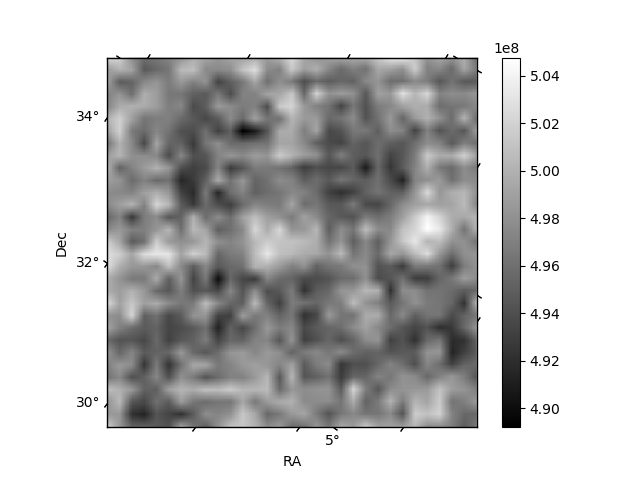
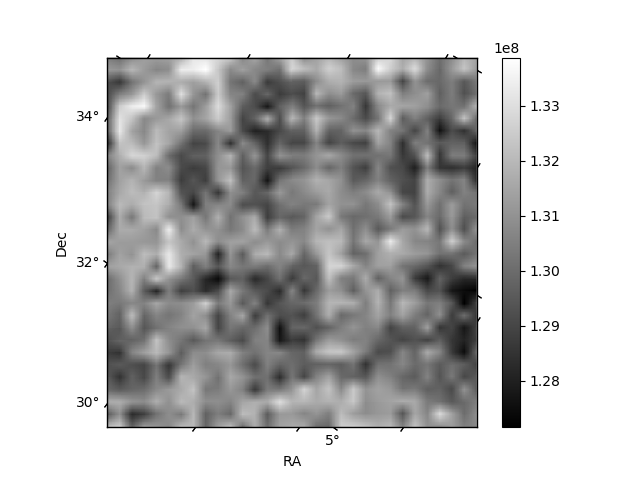
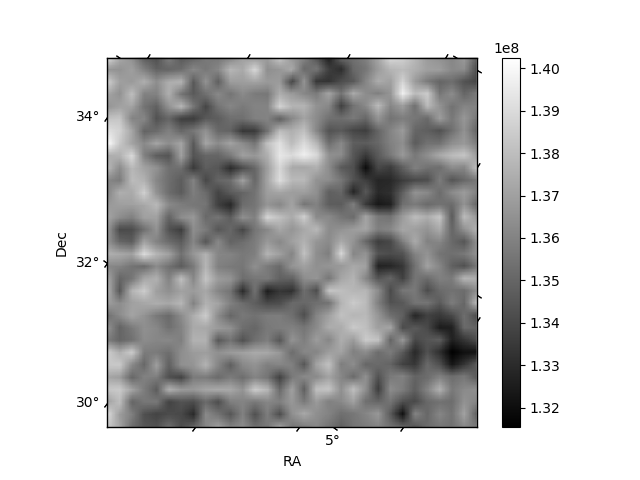
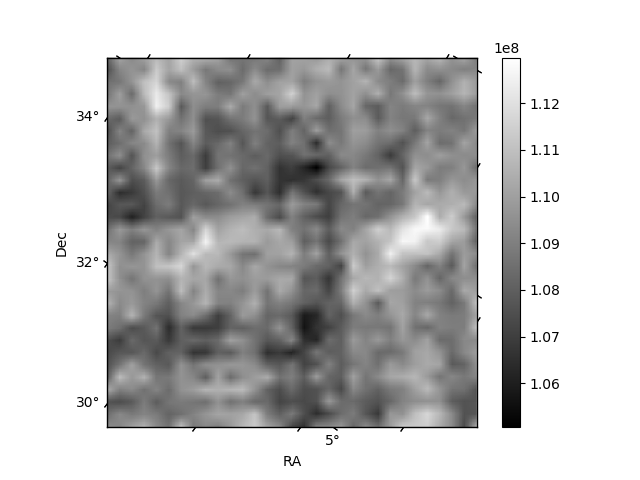
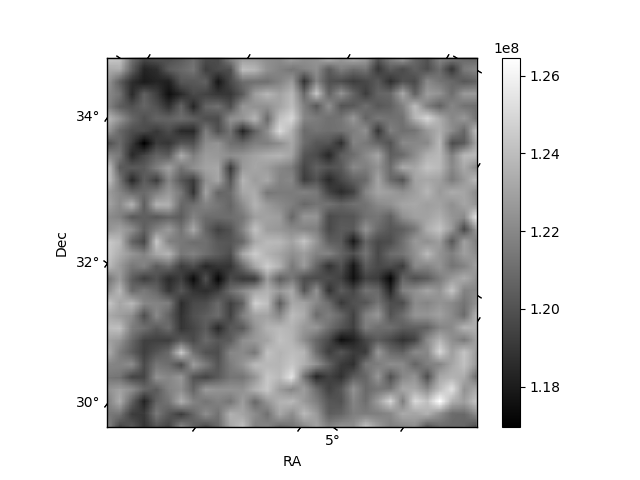
Histogram calculated using DETX and DETY for each event in the final _common_clean file
| Quadrant A | 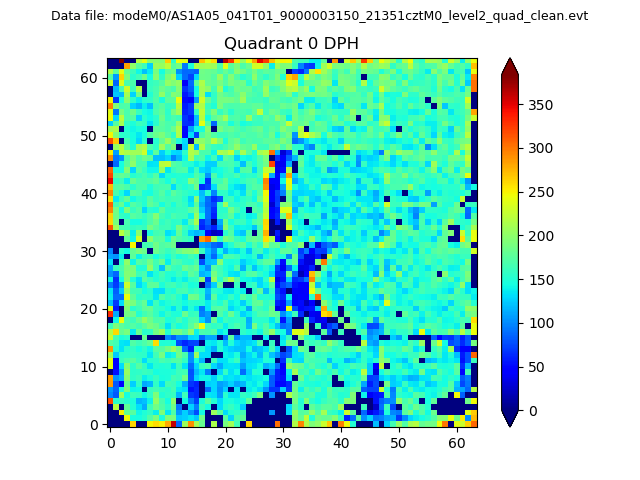 |
 |
Quadrant B |
|---|---|---|---|
| Quadrant D | 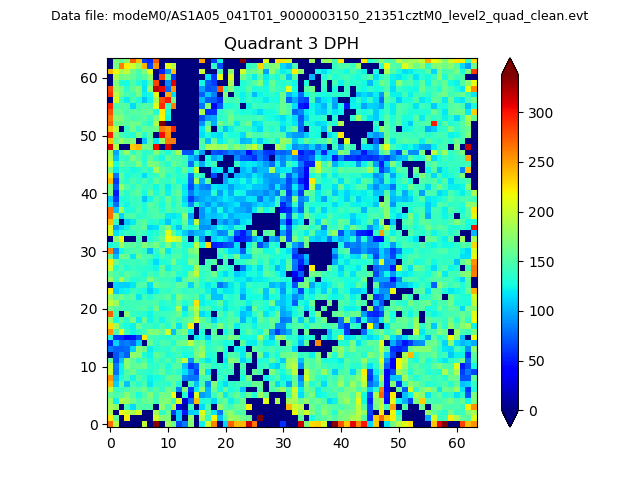 |
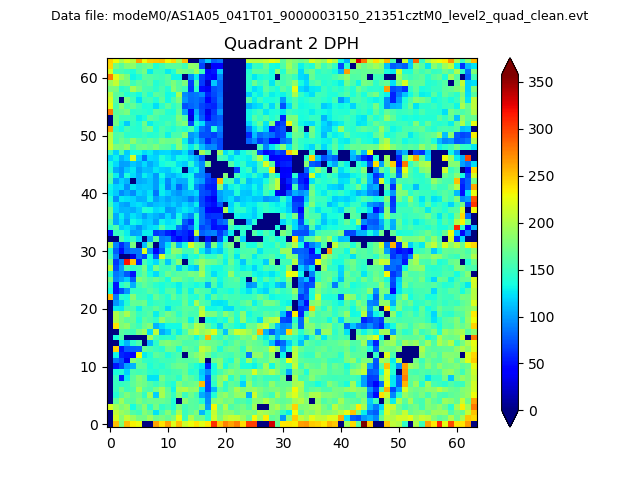 |
Quadrant C |
| Plot type | Count rate plots | Images |
|---|---|---|
| Comparison with Poisson distribution Blue bars denote a histogram of data divided into 1 sec bins. Red curve is a Poisson curve with rate = median count rate of data. |
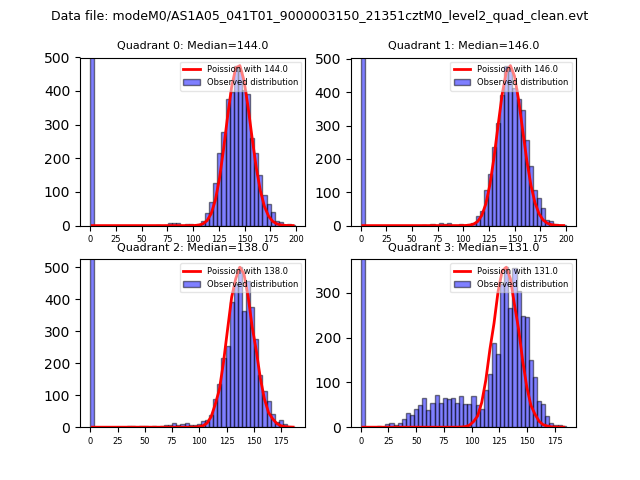 |
 |
| Quadrant-wise count rates Data is divided into 100 sec bins |
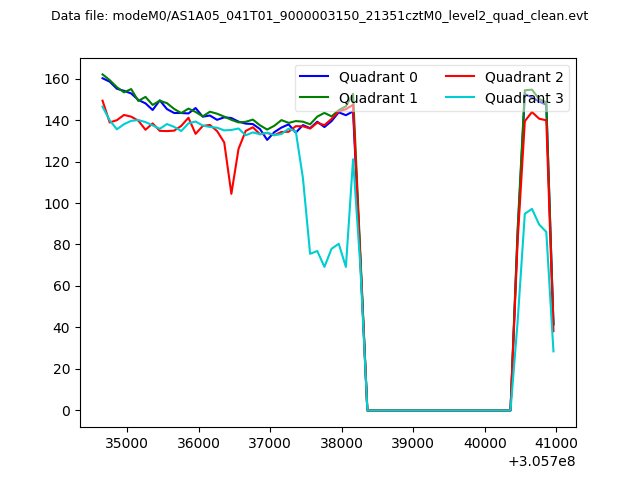 |
|
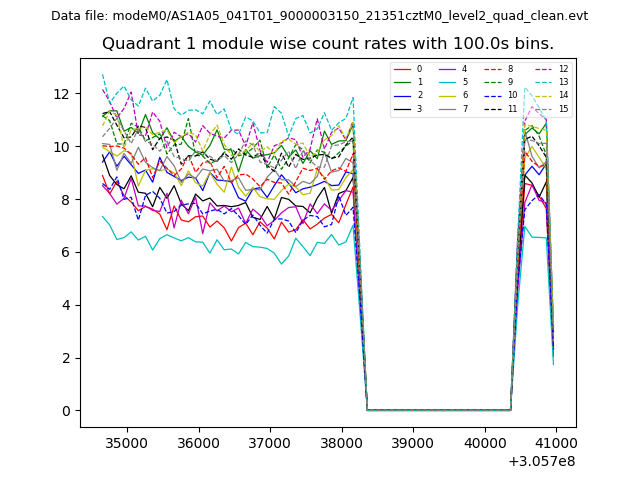
| Module-wise count rates for Quadrant A Data is divided into 100 sec bins |
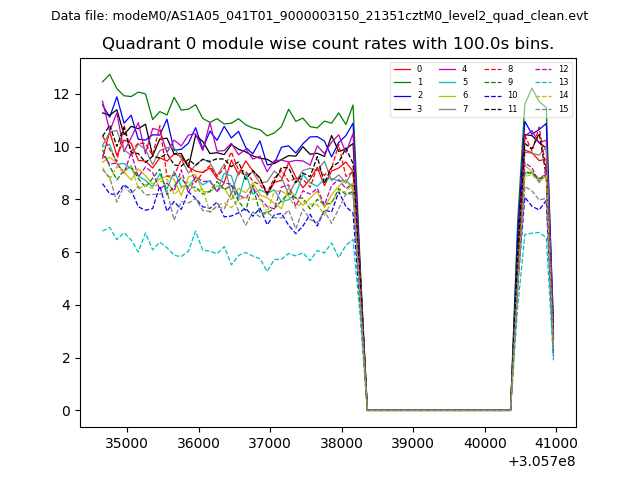 |
 |
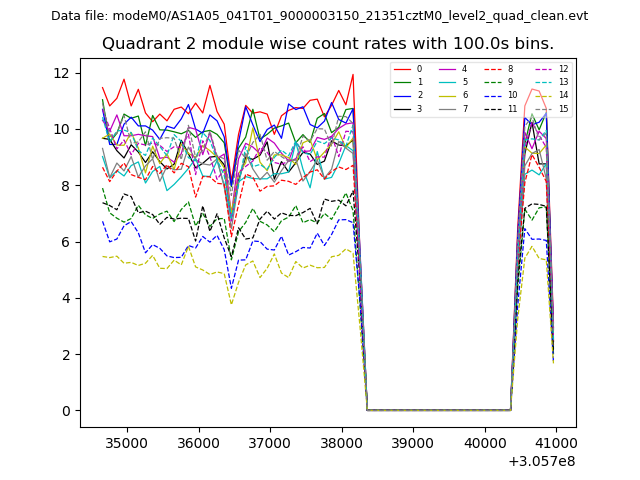
| Module-wise count rates for Quadrant B Data is divided into 100 sec bins |
 |
 |
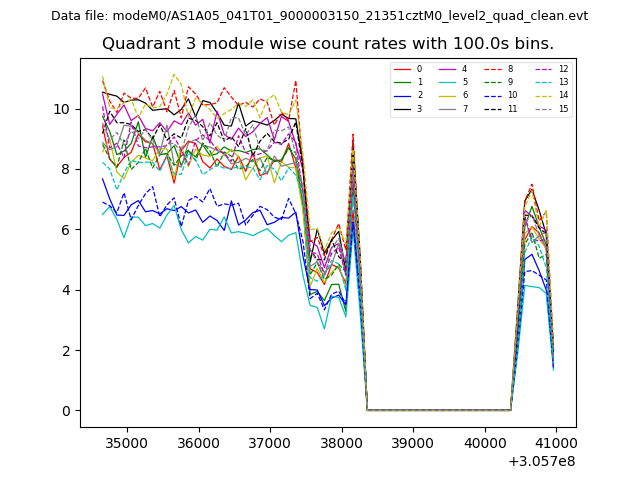
| Module-wise count rates for Quadrant C Data is divided into 100 sec bins |
 |
 |
| Module-wise count rates for Quadrant D Data is divided into 100 sec bins |
 |
 |
| Parameter | Plot |
|---|---|
| CZT HV Monitor | 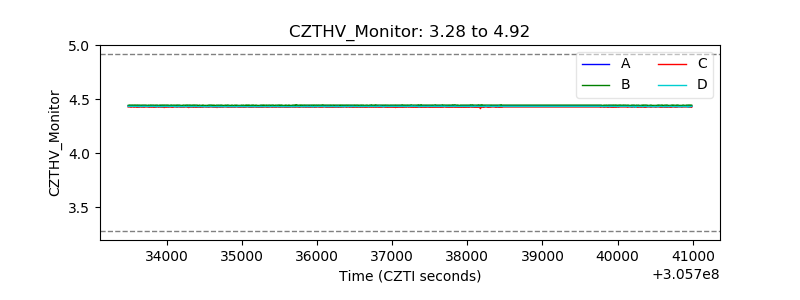 |
| D_VDD | 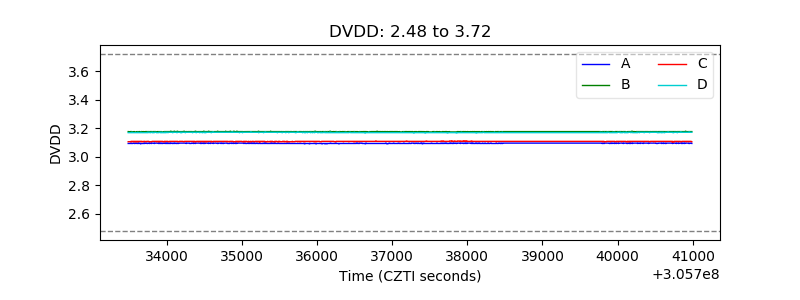 |
| Temperature 1 | 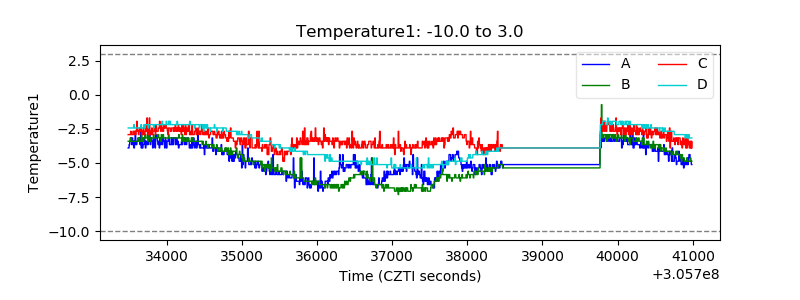 |
| Veto HV Monitor |  |
| Veto LLD | 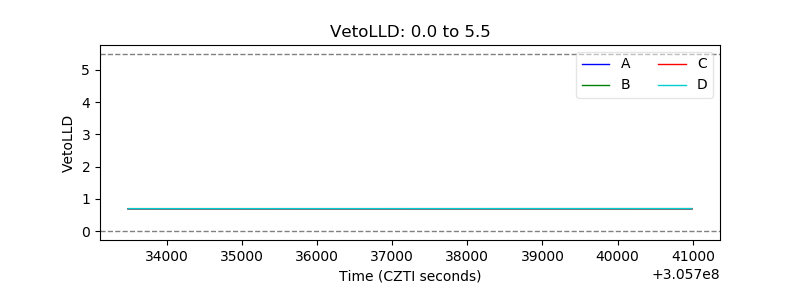 |
| Alpha Counter |  |
| _CPM_Rate | 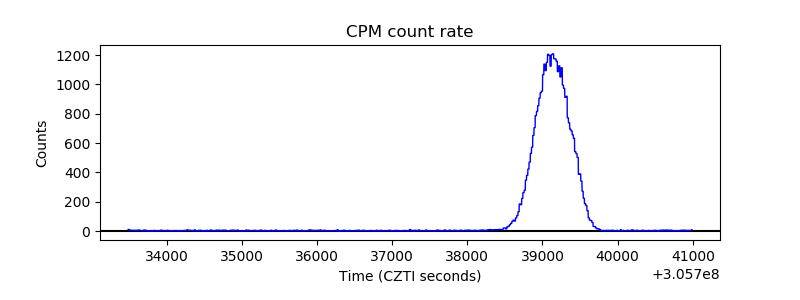 |
| CZT Counter | 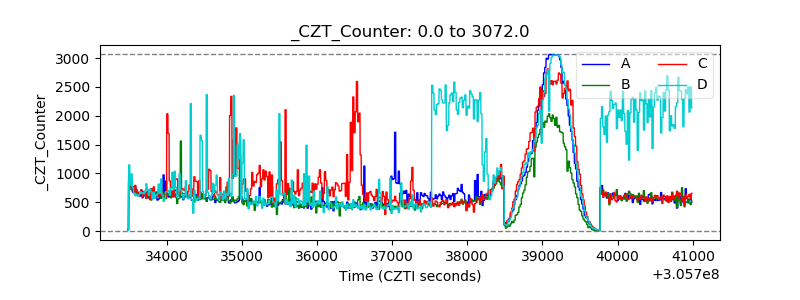 |
| +2.5 Volts monitor |  |
| +5 Volts monitor |  |
| _ROLL_ROT | 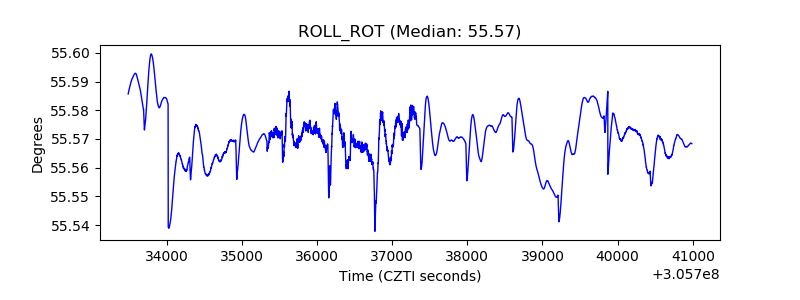 |
| _Roll_DEC | 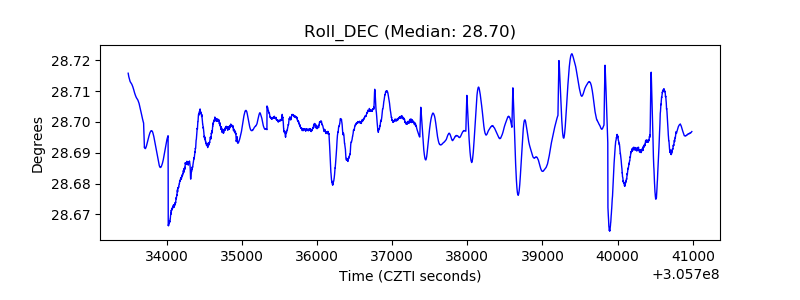 |
| _Roll_RA |  |
| Veto Counter | 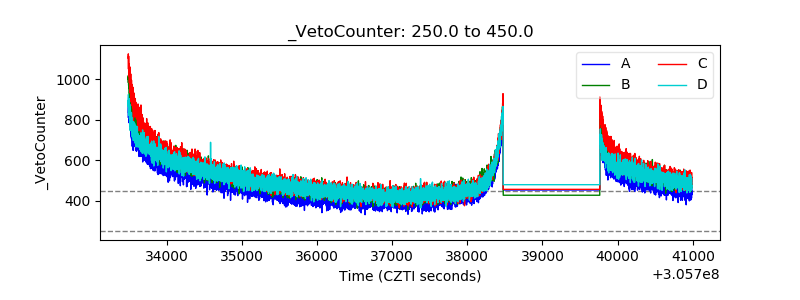 |