| Param | Original file | Final file |
|---|---|---|
| Filename | modeM0/AS1A05_041T01_9000003150_21353cztM0_level2.evt | modeM0/AS1A05_041T01_9000003150_21353cztM0_level2_quad_clean.evt |
| Size (bytes) | 635,080,320 | 100,638,720 |
| Size | 605.7 MB | 96.0 MB |
| Events in quadrant A | 3,278,714 | 668,573 |
| Events in quadrant B | 3,341,496 | 679,734 |
| Events in quadrant C | 4,058,456 | 640,443 |
| Events in quadrant D | 8,099,675 | 589,631 |
| Mode SS | |||
|---|---|---|---|
| Quadrant | BADHDUFLAG | Total packets | Discarded packets |
| A | 0 | 136 | 0 |
| B | 0 | 136 | 0 |
| C | 0 | 136 | 0 |
| D | 0 | 136 | 0 |
| Mode M0 | |||
|---|---|---|---|
| Quadrant | BADHDUFLAG | Total packets | Discarded packets |
| A | 0 | 13928 | 1 |
| B | 0 | 14176 | 1 |
| C | 0 | 16369 | 1 |
| D | 0 | 28704 | 1 |
| Mode M9 | |||
|---|---|---|---|
| Quadrant | BADHDUFLAG | Total packets | Discarded packets |
| A | 0 | 7 | 0 |
| B | 0 | 7 | 0 |
| C | 0 | 7 | 0 |
| D | 0 | 7 | 0 |
| Quadrant | Total seconds | Saturated seconds | Saturation percentage |
|---|---|---|---|
| A | 6728 | 28 | 0.416171% |
| B | 6729 | 57 | 0.847080% |
| C | 6729 | 238 | 3.536930% |
| D | 6729 | 1227 | 18.234507% |
Noise dominated data is calculated using 1-second bins in cleaned event files. If a bin has >2000 counts, and if more than 50% of those come from <1% of pixels, then it is considered to be noise-dominated and hence unusable.
| Quadrant | # 1 sec bins | Bins with >0 counts | Bins with >2000 counts | High rate bins dominated by noise | Noise dominated (total time) | Noise dominated (detector-on time) | Marked lightcurve |
|---|---|---|---|---|---|---|---|
| A | 7443 | 6729 | 0 | 0 | 0.00% | 0.00% | 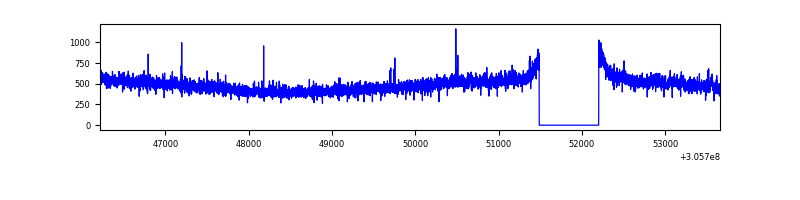 |
| B | 7444 | 6730 | 9 | 9 | 0.12% | 0.13% | 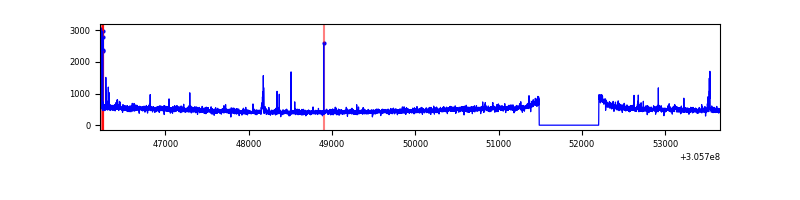 |
| C | 7444 | 6729 | 61 | 61 | 0.82% | 0.91% | 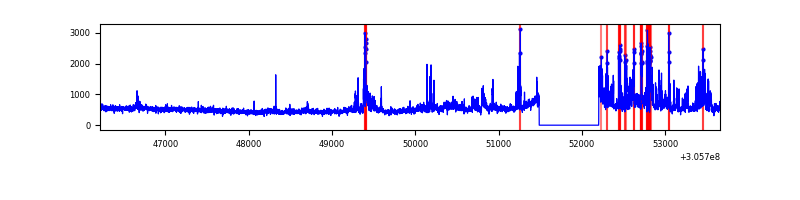 |
| D | 7444 | 6730 | 1017 | 1017 | 13.66% | 15.11% | 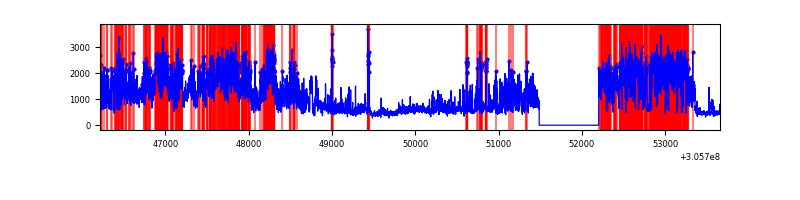 |
Top three noisy pixels from each quadrant. If the there are fewer than three noisy pixels in the level2.evt file, extra rows are filled as -1
| Pixel properties | Quadrant properties | ||||||
|---|---|---|---|---|---|---|---|
| Quadrant | DetID | PixID | Counts | Sigma | Mean | Median | Sigma |
| A | 5 | 168 | 77425 | 461.45 | 828 | 811 | 166.0 |
| A | 13 | 254 | 8412 | 45.78 | 828 | 811 | 166.0 |
| A | 11 | 47 | 7148 | 38.17 | 828 | 811 | 166.0 |
| B | 0 | 230 | 39948 | 248.19 | 825 | 803 | 157.7 |
| B | 3 | 64 | 36833 | 228.44 | 825 | 803 | 157.7 |
| B | 0 | 197 | 31875 | 197.0 | 825 | 803 | 157.7 |
| C | 3 | 233 | 816656 | 4383.49 | 795 | 802 | 186.1 |
| C | 14 | 238 | 124292 | 663.5 | 795 | 802 | 186.1 |
| C | 10 | 91 | 10255 | 50.79 | 795 | 802 | 186.1 |
| D | 13 | 174 | 3531333 | 18581.85 | 776 | 753 | 190.0 |
| D | 7 | 238 | 1298422 | 6829.78 | 776 | 753 | 190.0 |
| D | 1 | 52 | 166868 | 874.28 | 776 | 753 | 190.0 |
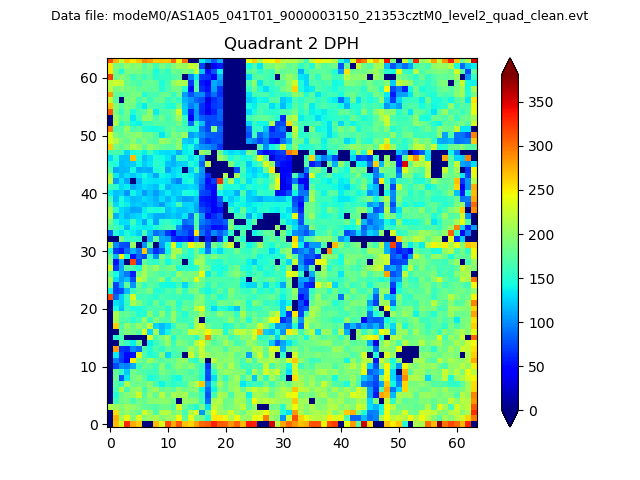
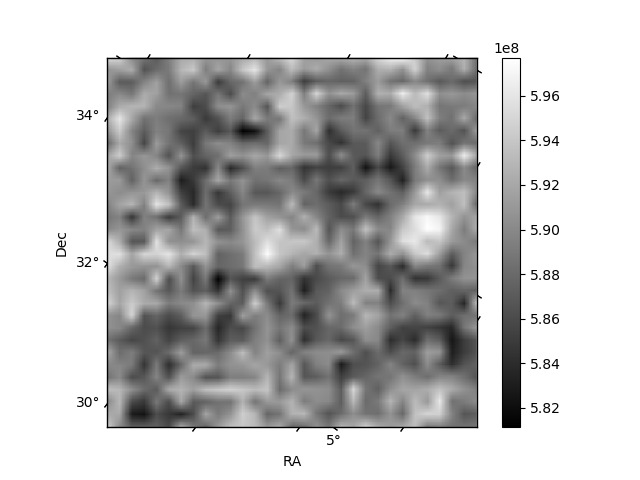
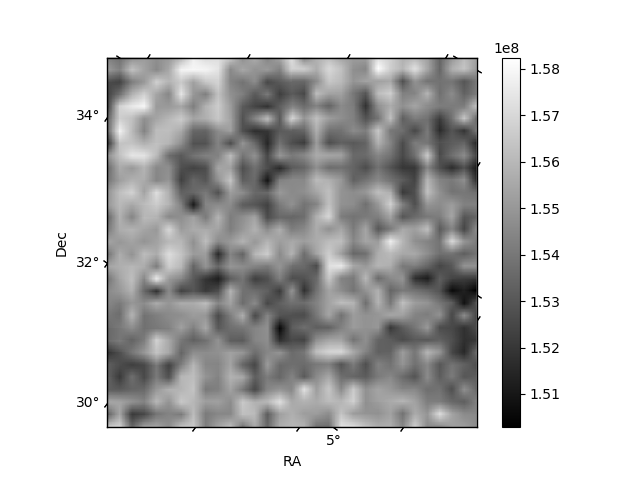
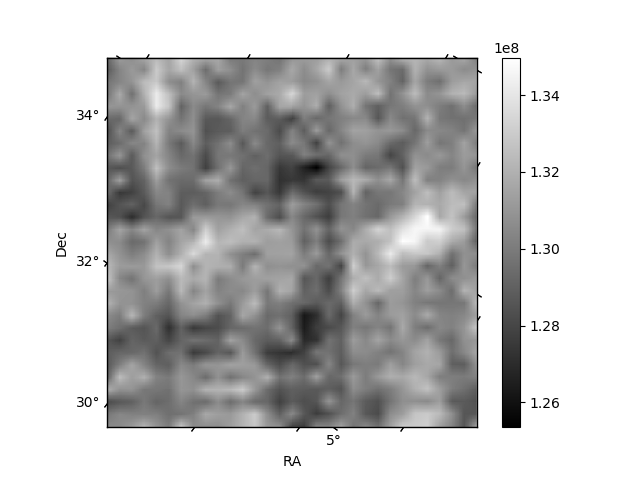
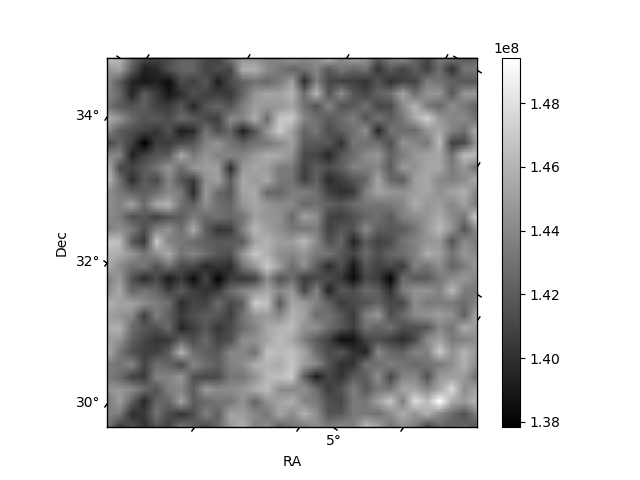
Histogram calculated using DETX and DETY for each event in the final _common_clean file
| Quadrant A | 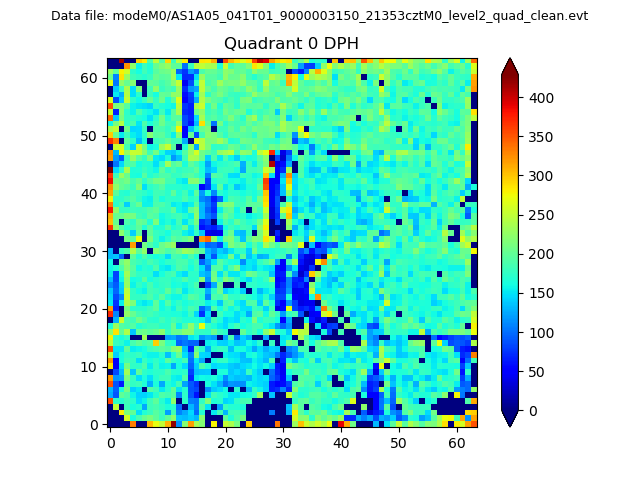 |
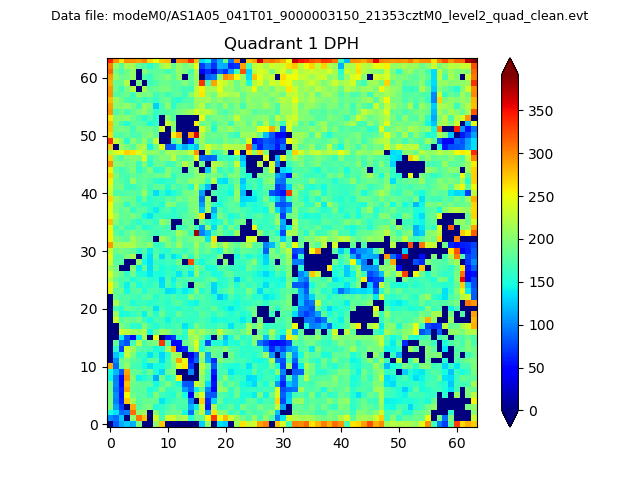 |
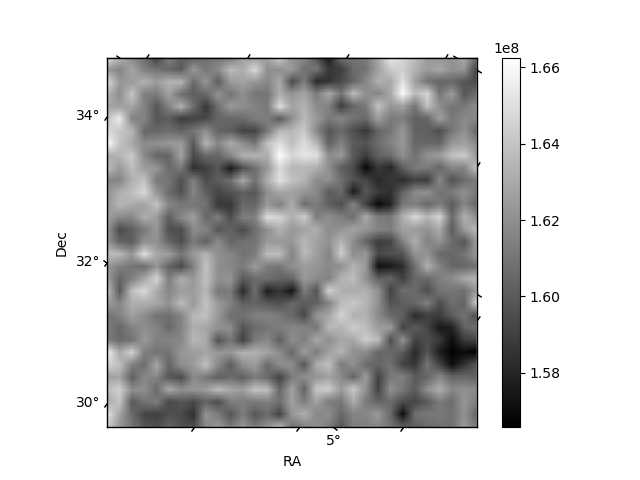
Quadrant B |
|---|---|---|---|
| Quadrant D | 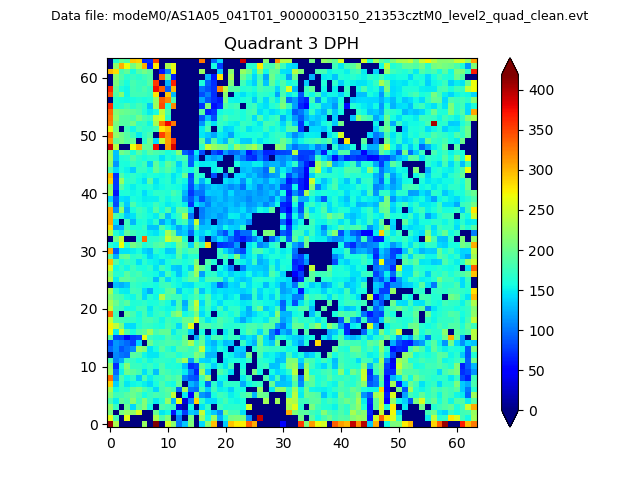 |
 |
Quadrant C |
| Plot type | Count rate plots | Images |
|---|---|---|
| Comparison with Poisson distribution Blue bars denote a histogram of data divided into 1 sec bins. Red curve is a Poisson curve with rate = median count rate of data. |
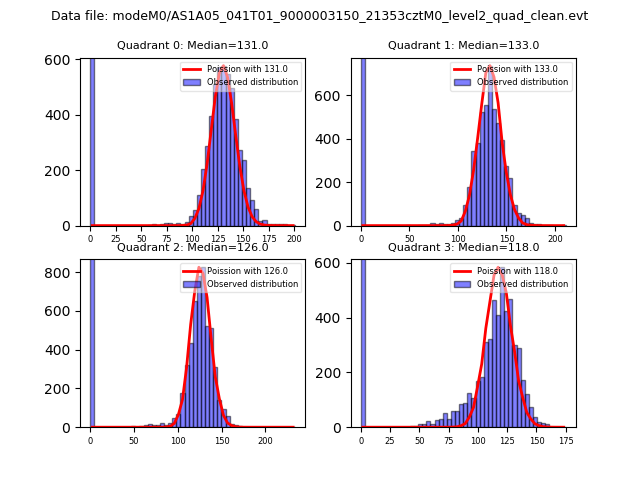 |
 |
| Quadrant-wise count rates Data is divided into 100 sec bins |
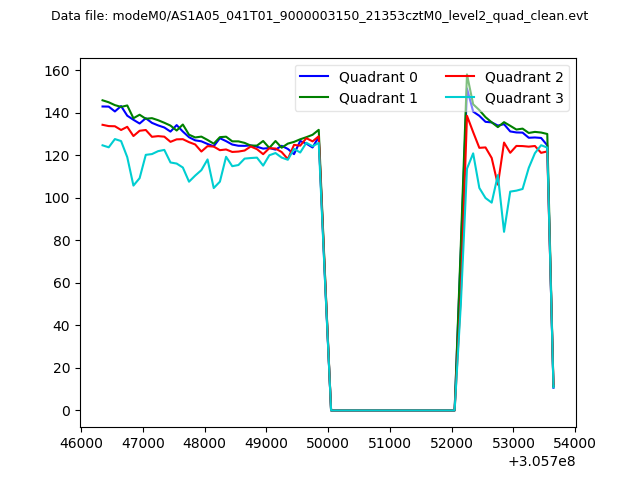 |
|
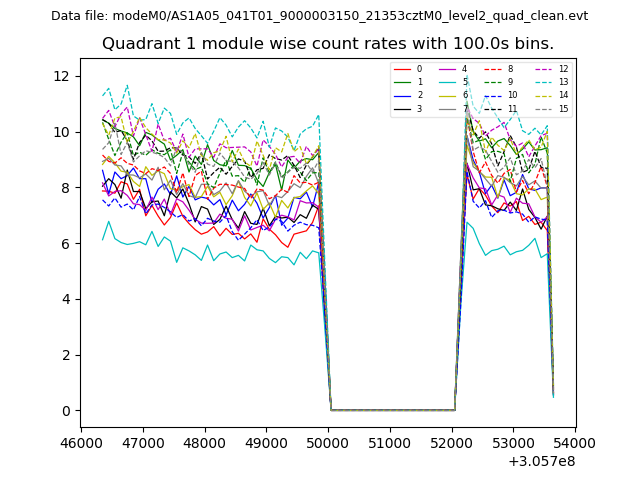
| Module-wise count rates for Quadrant A Data is divided into 100 sec bins |
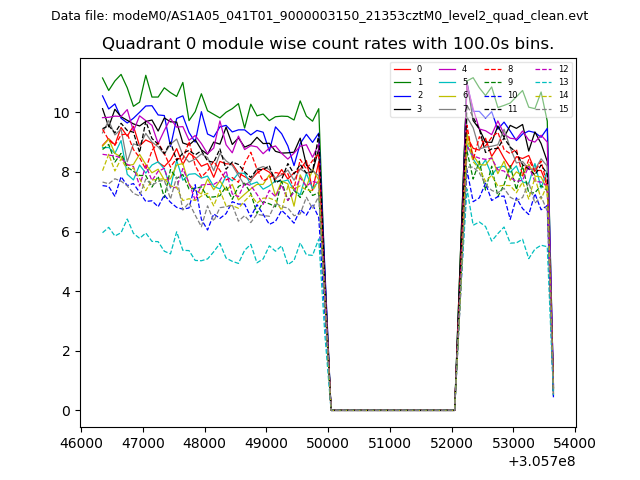 |
 |
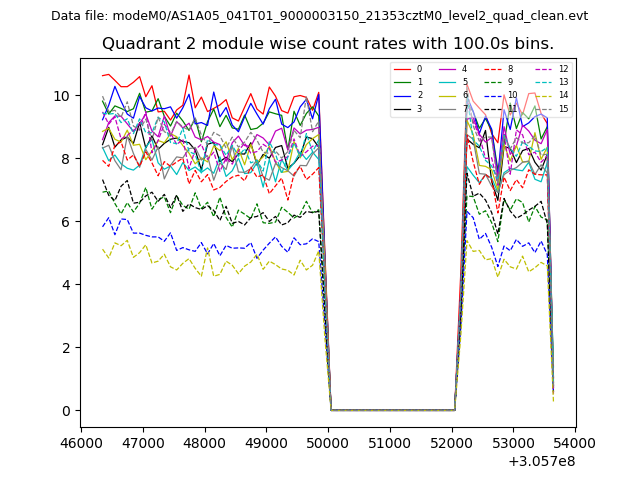
| Module-wise count rates for Quadrant B Data is divided into 100 sec bins |
 |
 |
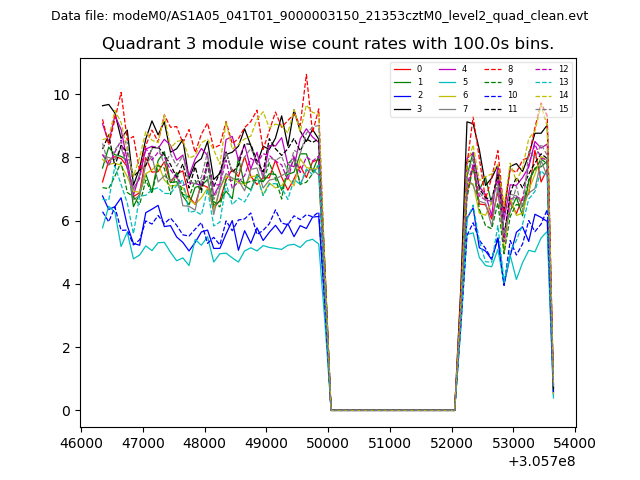
| Module-wise count rates for Quadrant C Data is divided into 100 sec bins |
 |
 |
| Module-wise count rates for Quadrant D Data is divided into 100 sec bins |
 |
 |
| Parameter | Plot |
|---|---|
| CZT HV Monitor | 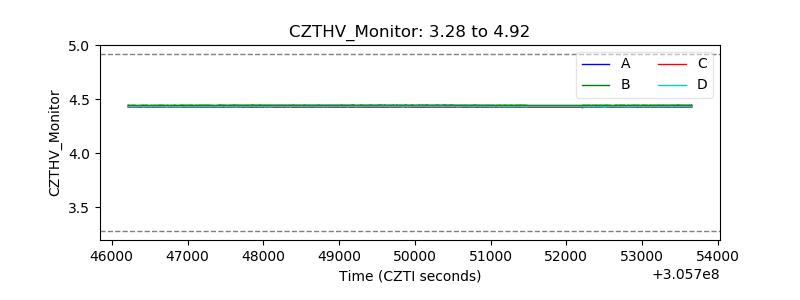 |
| D_VDD | 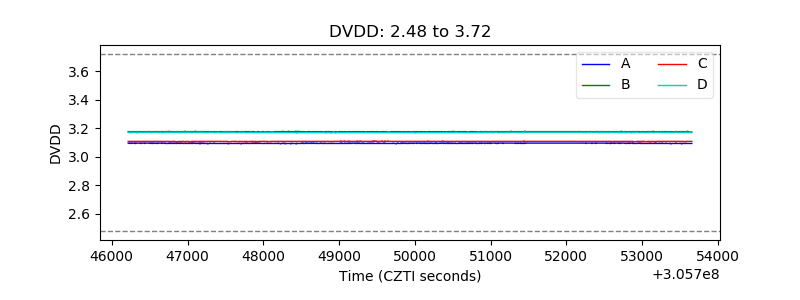 |
| Temperature 1 | 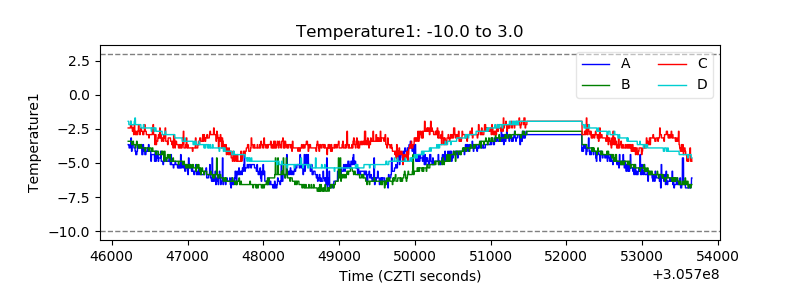 |
| Veto HV Monitor | 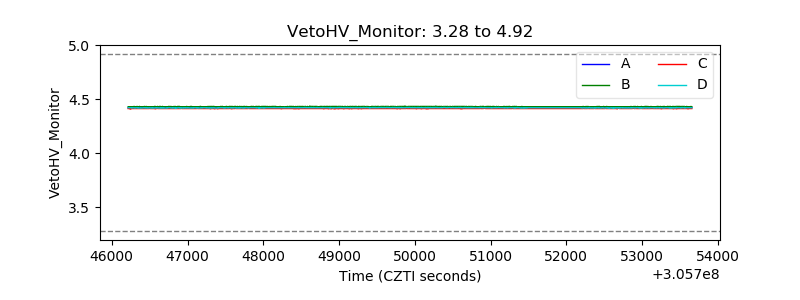 |
| Veto LLD | 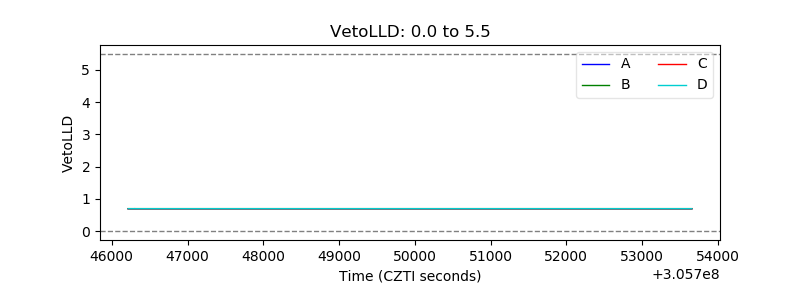 |
| Alpha Counter | 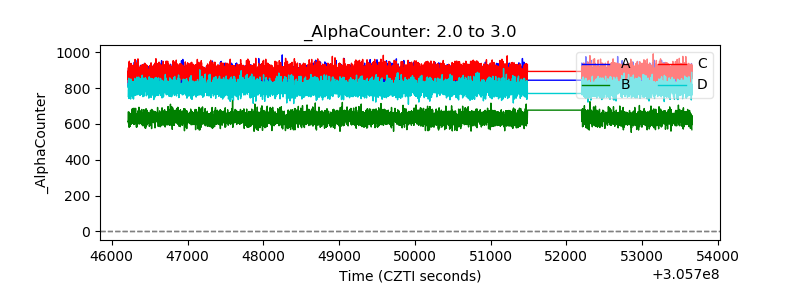 |
| _CPM_Rate | 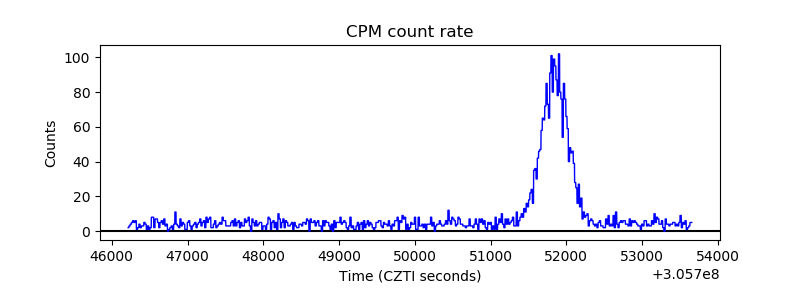 |
| CZT Counter | 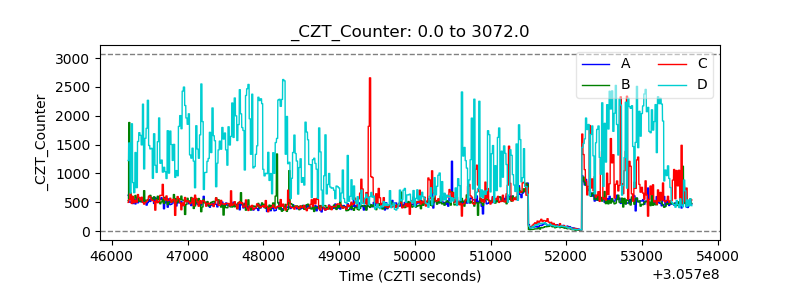 |
| +2.5 Volts monitor |  |
| +5 Volts monitor |  |
| _ROLL_ROT | 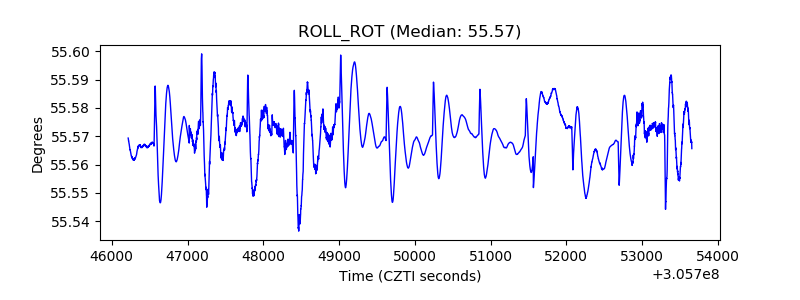 |
| _Roll_DEC | 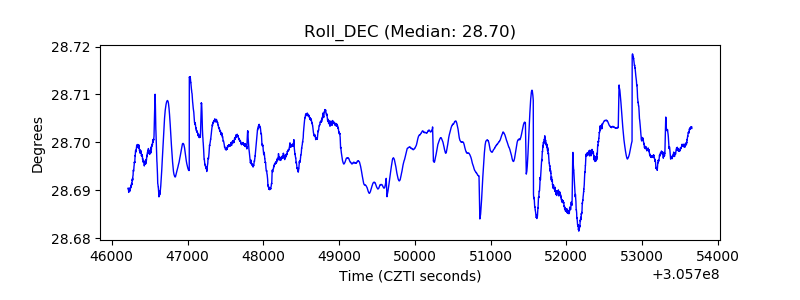 |
| _Roll_RA |  |
| Veto Counter | 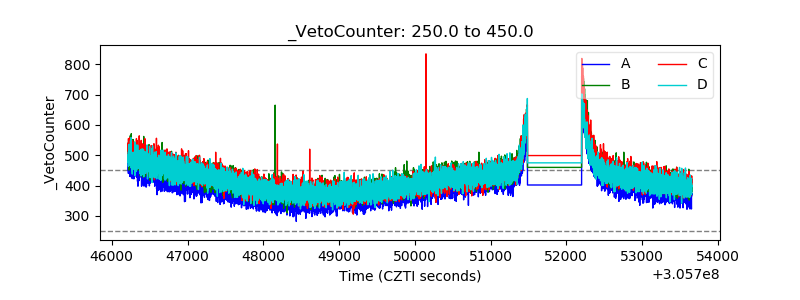 |