| Param | Original file | Final file |
|---|---|---|
| Filename | modeM0/AS1A05_041T01_9000003150_21354cztM0_level2.evt | modeM0/AS1A05_041T01_9000003150_21354cztM0_level2_quad_clean.evt |
| Size (bytes) | 652,152,960 | 102,202,560 |
| Size | 621.9 MB | 97.5 MB |
| Events in quadrant A | 3,822,066 | 662,665 |
| Events in quadrant B | 3,878,092 | 672,951 |
| Events in quadrant C | 4,717,366 | 636,369 |
| Events in quadrant D | 6,815,152 | 591,010 |
| Mode SS | |||
|---|---|---|---|
| Quadrant | BADHDUFLAG | Total packets | Discarded packets |
| A | 0 | 156 | 0 |
| B | 0 | 156 | 0 |
| C | 0 | 156 | 0 |
| D | 0 | 156 | 0 |
| Mode M0 | |||
|---|---|---|---|
| Quadrant | BADHDUFLAG | Total packets | Discarded packets |
| A | 0 | 16174 | 3 |
| B | 0 | 16541 | 2 |
| C | 0 | 19053 | 2 |
| D | 0 | 25449 | 2 |
| Mode M9 | |||
|---|---|---|---|
| Quadrant | BADHDUFLAG | Total packets | Discarded packets |
| A | 0 | 11 | 0 |
| B | 0 | 11 | 0 |
| C | 0 | 11 | 0 |
| D | 0 | 11 | 0 |
| Quadrant | Total seconds | Saturated seconds | Saturation percentage |
|---|---|---|---|
| A | 7646 | 75 | 0.980905% |
| B | 7646 | 146 | 1.909495% |
| C | 7647 | 359 | 4.694651% |
| D | 7647 | 963 | 12.593174% |
Noise dominated data is calculated using 1-second bins in cleaned event files. If a bin has >2000 counts, and if more than 50% of those come from <1% of pixels, then it is considered to be noise-dominated and hence unusable.
| Quadrant | # 1 sec bins | Bins with >0 counts | Bins with >2000 counts | High rate bins dominated by noise | Noise dominated (total time) | Noise dominated (detector-on time) | Marked lightcurve |
|---|---|---|---|---|---|---|---|
| A | 8721 | 7648 | 0 | 0 | 0.00% | 0.00% | 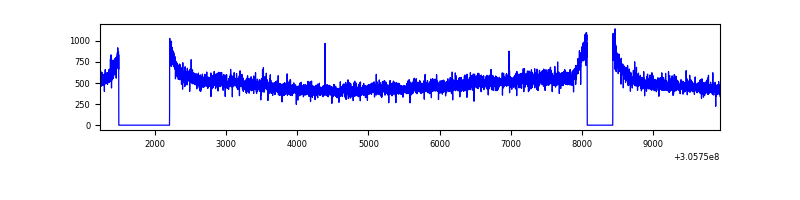 |
| B | 8721 | 7647 | 10 | 10 | 0.11% | 0.13% | 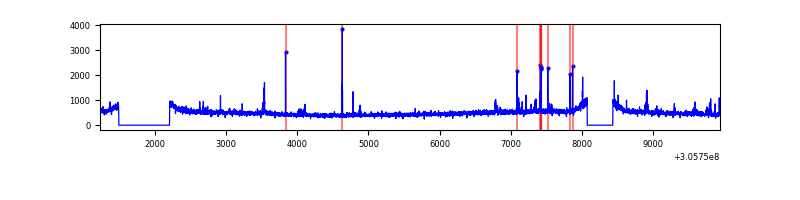 |
| C | 8722 | 7647 | 68 | 68 | 0.78% | 0.89% | 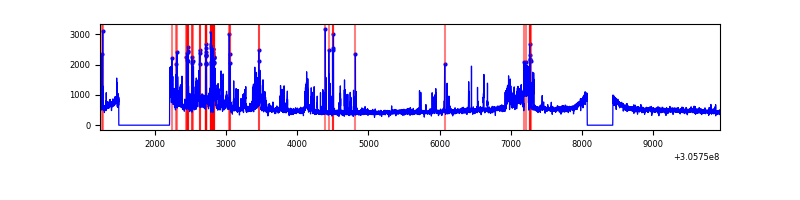 |
| D | 8722 | 7649 | 686 | 686 | 7.87% | 8.97% | 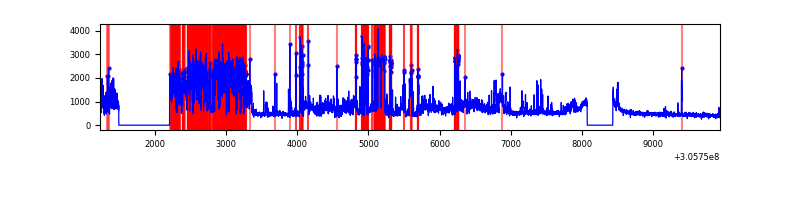 |
Top three noisy pixels from each quadrant. If the there are fewer than three noisy pixels in the level2.evt file, extra rows are filled as -1
| Pixel properties | Quadrant properties | ||||||
|---|---|---|---|---|---|---|---|
| Quadrant | DetID | PixID | Counts | Sigma | Mean | Median | Sigma |
| A | 5 | 168 | 134805 | 692.11 | 954 | 931 | 193.4 |
| A | 11 | 47 | 10751 | 50.77 | 954 | 931 | 193.4 |
| A | 13 | 254 | 9639 | 45.02 | 954 | 931 | 193.4 |
| B | 0 | 230 | 59139 | 315.4 | 949 | 922 | 184.6 |
| B | 6 | 36 | 47484 | 252.25 | 949 | 922 | 184.6 |
| B | 0 | 197 | 36212 | 191.19 | 949 | 922 | 184.6 |
| C | 3 | 233 | 1006392 | 4661.17 | 914 | 920 | 215.7 |
| C | 14 | 238 | 140102 | 645.22 | 914 | 920 | 215.7 |
| C | 13 | 61 | 6297 | 24.93 | 914 | 920 | 215.7 |
| D | 13 | 174 | 2833644 | 12929.31 | 896 | 869 | 219.1 |
| D | 1 | 52 | 524580 | 2390.31 | 896 | 869 | 219.1 |
| D | 12 | 235 | 35314 | 157.21 | 896 | 869 | 219.1 |
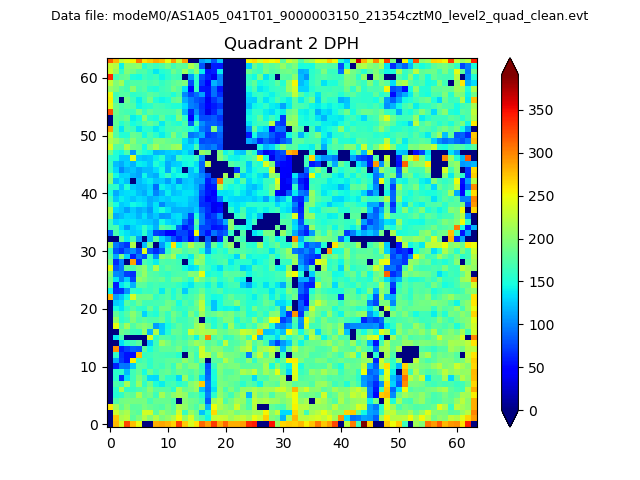
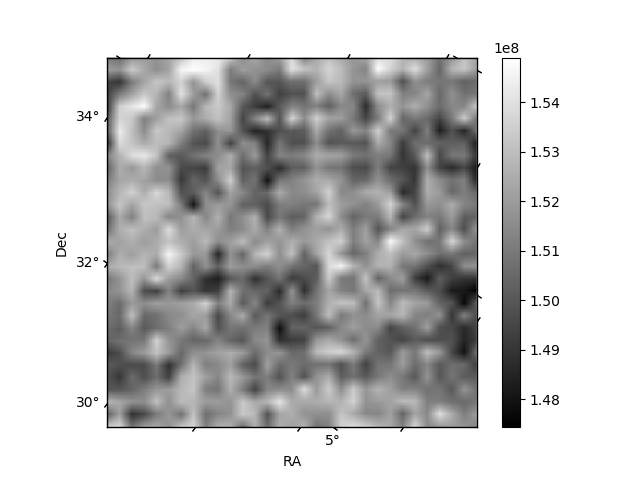
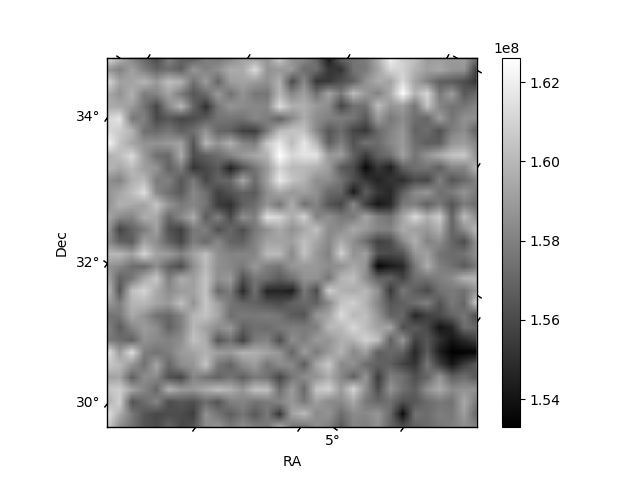
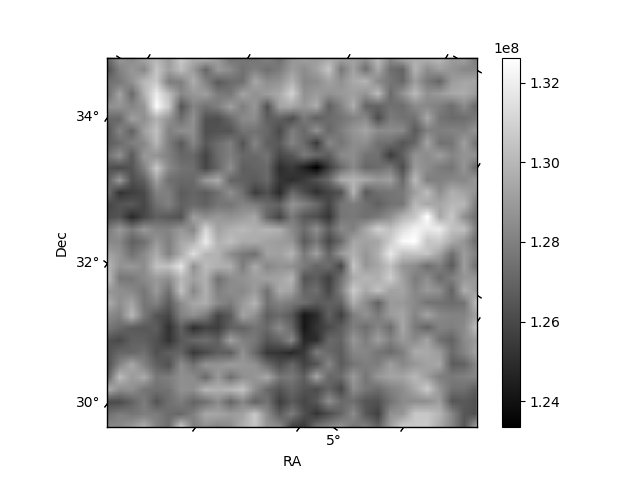
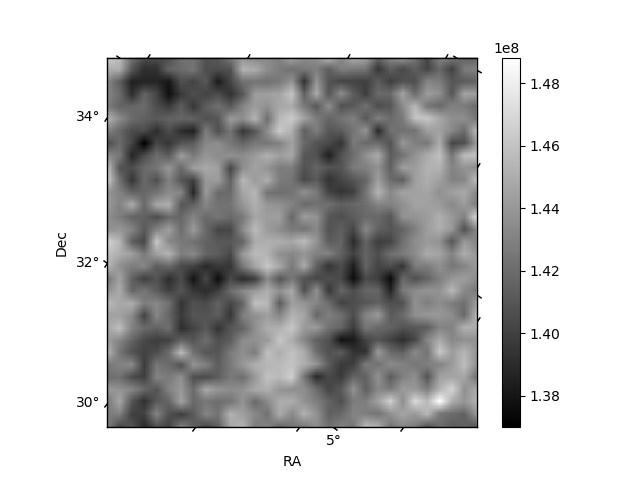
Histogram calculated using DETX and DETY for each event in the final _common_clean file
| Quadrant A | 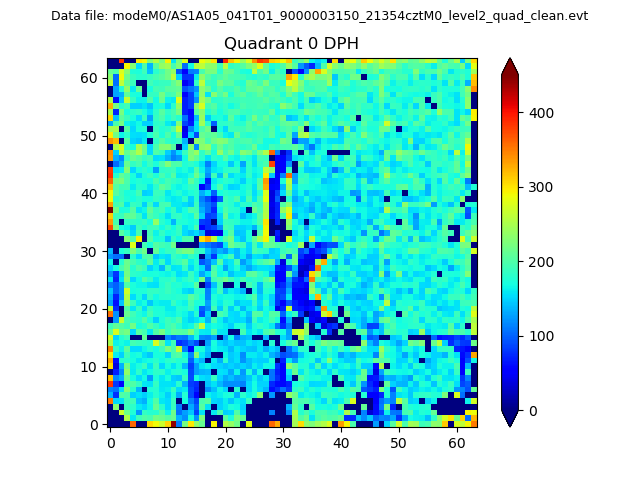 |
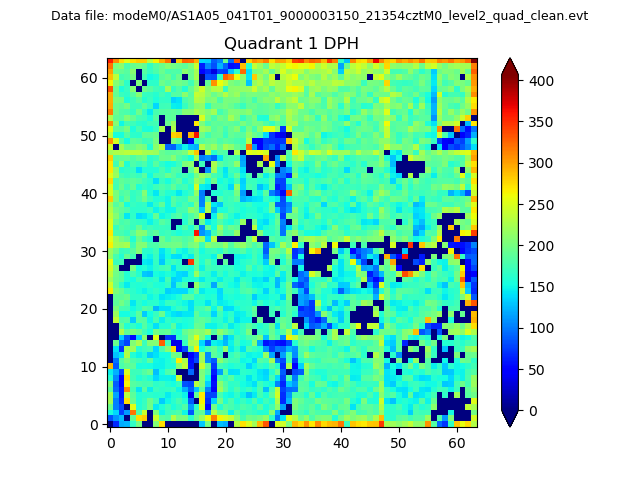 |
Quadrant B |
|---|---|---|---|
| Quadrant D | 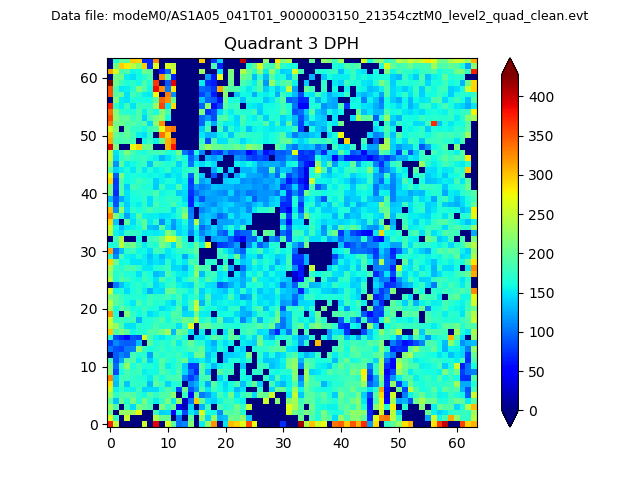 |
 |
Quadrant C |
| Plot type | Count rate plots | Images |
|---|---|---|
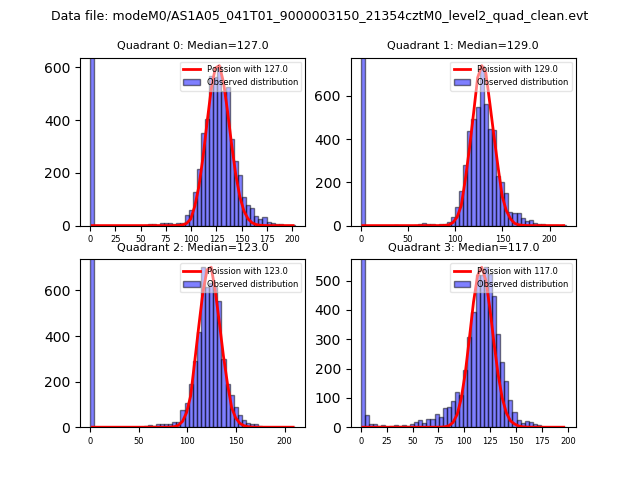
| Comparison with Poisson distribution Blue bars denote a histogram of data divided into 1 sec bins. Red curve is a Poisson curve with rate = median count rate of data. |
 |
 |
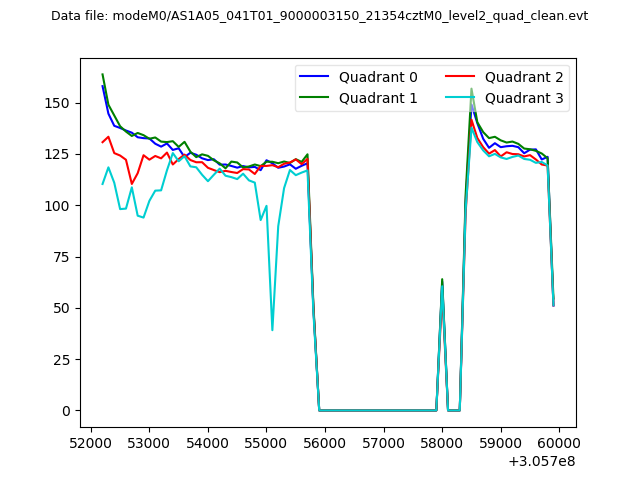
| Quadrant-wise count rates Data is divided into 100 sec bins |
 |
|
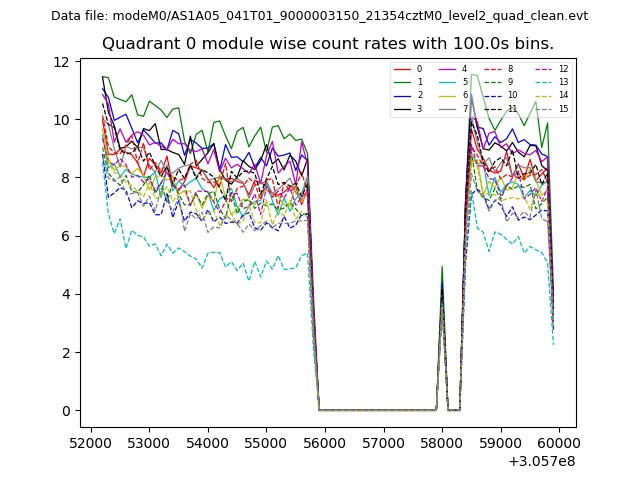
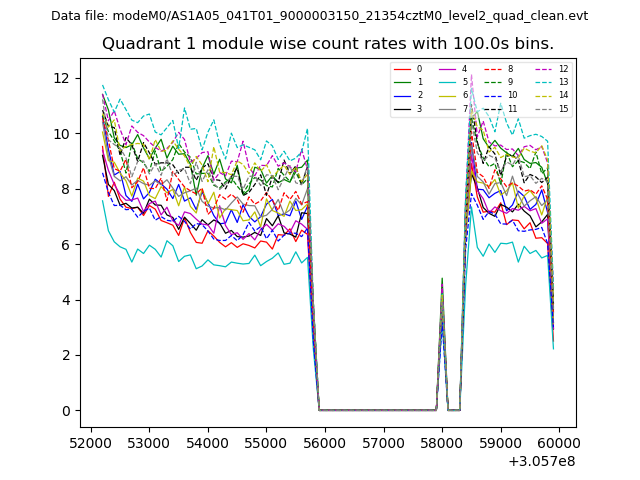
| Module-wise count rates for Quadrant A Data is divided into 100 sec bins |
 |
 |
| Module-wise count rates for Quadrant B Data is divided into 100 sec bins |
 |
 |
| Module-wise count rates for Quadrant C Data is divided into 100 sec bins |
 |
 |
| Module-wise count rates for Quadrant D Data is divided into 100 sec bins |
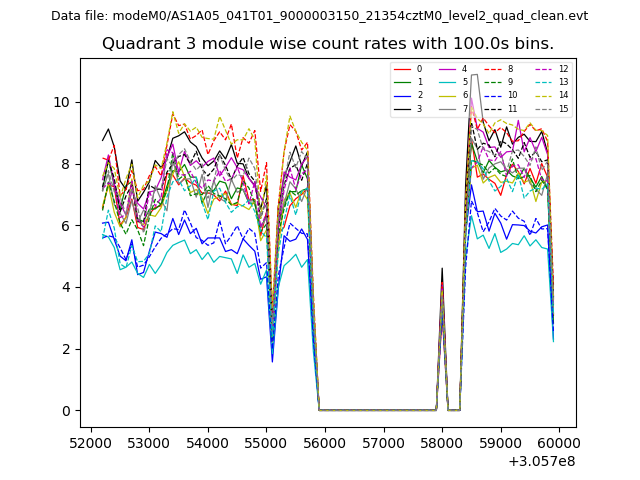 |
 |
| Parameter | Plot |
|---|---|
| CZT HV Monitor | 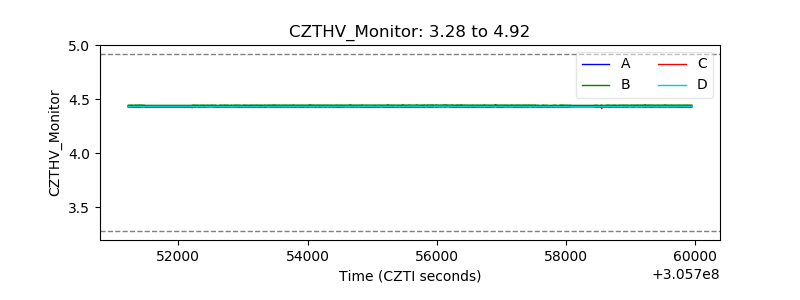 |
| D_VDD | 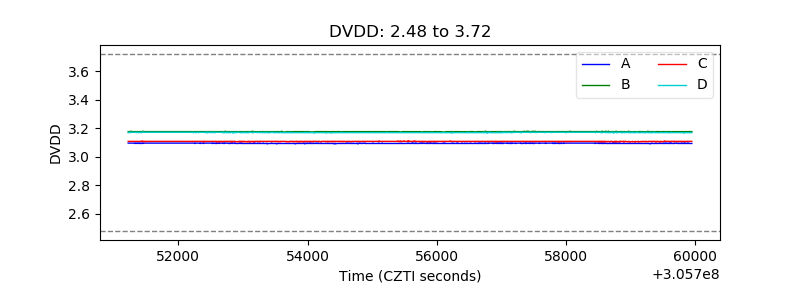 |
| Temperature 1 | 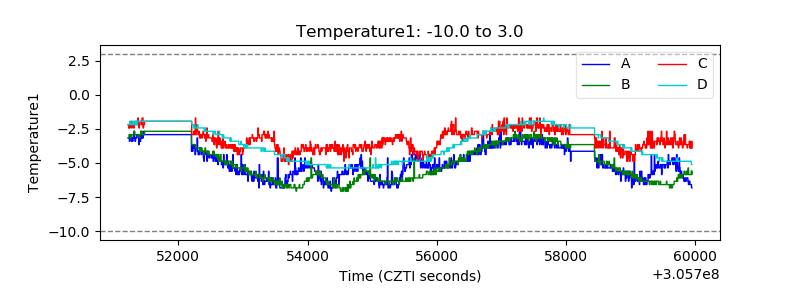 |
| Veto HV Monitor | 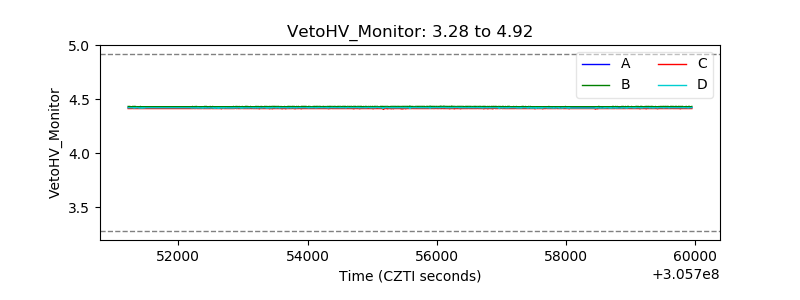 |
| Veto LLD | 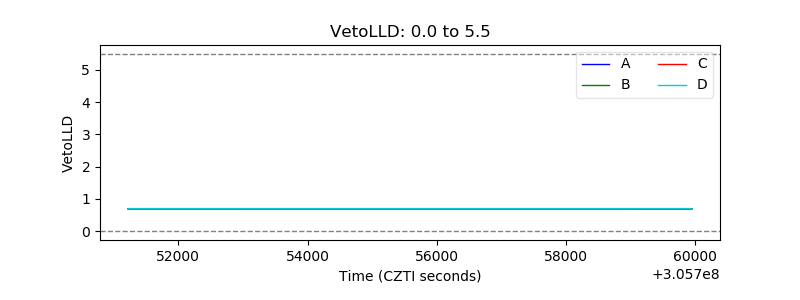 |
| Alpha Counter |  |
| _CPM_Rate | 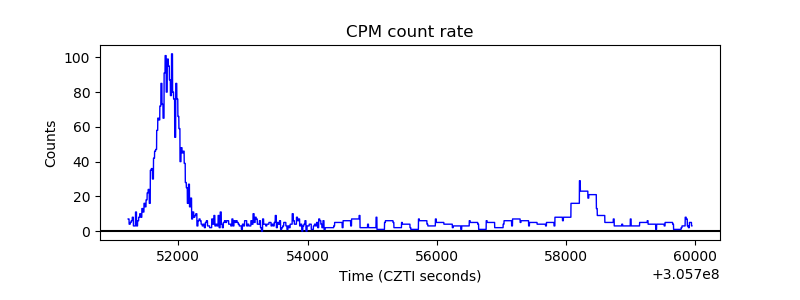 |
| CZT Counter |  |
| +2.5 Volts monitor |  |
| +5 Volts monitor |  |
| _ROLL_ROT | 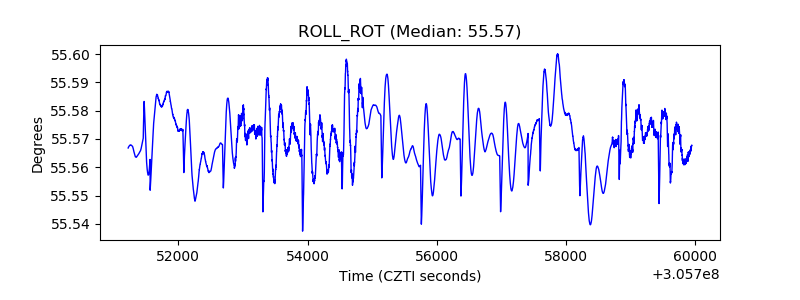 |
| _Roll_DEC | 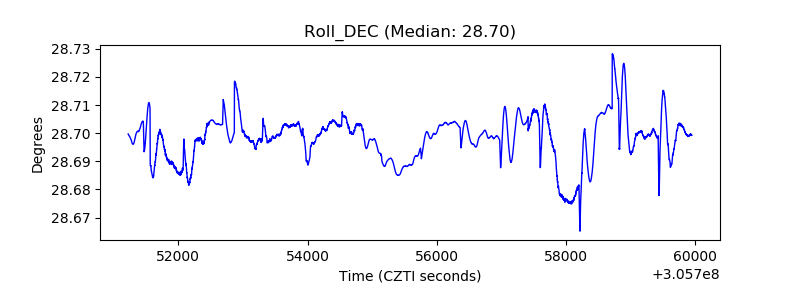 |
| _Roll_RA |  |
| Veto Counter | 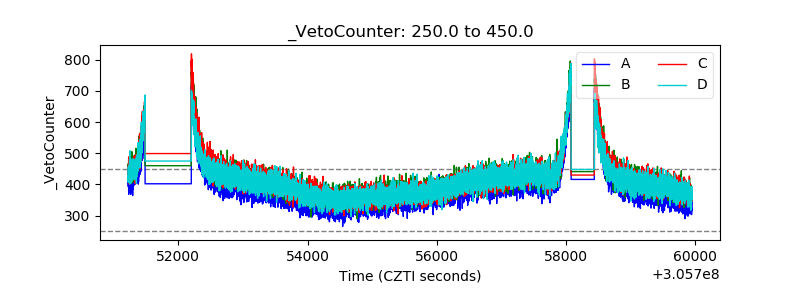 |