| Param | Original file | Final file |
|---|---|---|
| Filename | modeM0/AS1A05_041T01_9000003150_21355cztM0_level2.evt | modeM0/AS1A05_041T01_9000003150_21355cztM0_level2_quad_clean.evt |
| Size (bytes) | 558,371,520 | 104,932,800 |
| Size | 532.5 MB | 100.1 MB |
| Events in quadrant A | 3,710,539 | 674,586 |
| Events in quadrant B | 3,769,780 | 680,937 |
| Events in quadrant C | 3,744,661 | 657,477 |
| Events in quadrant D | 5,173,848 | 640,356 |
| Mode SS | |||
|---|---|---|---|
| Quadrant | BADHDUFLAG | Total packets | Discarded packets |
| A | 0 | 154 | 0 |
| B | 0 | 154 | 0 |
| C | 0 | 154 | 0 |
| D | 0 | 154 | 0 |
| Mode M0 | |||
|---|---|---|---|
| Quadrant | BADHDUFLAG | Total packets | Discarded packets |
| A | 0 | 15953 | 2 |
| B | 0 | 16195 | 2 |
| C | 0 | 16010 | 2 |
| D | 0 | 20770 | 2 |
| Mode M9 | |||
|---|---|---|---|
| Quadrant | BADHDUFLAG | Total packets | Discarded packets |
| A | 0 | 7 | 0 |
| B | 0 | 7 | 0 |
| C | 0 | 7 | 0 |
| D | 0 | 7 | 0 |
| Quadrant | Total seconds | Saturated seconds | Saturation percentage |
|---|---|---|---|
| A | 7537 | 97 | 1.286984% |
| B | 7538 | 187 | 2.480764% |
| C | 7538 | 190 | 2.520562% |
| D | 7538 | 522 | 6.924914% |
Noise dominated data is calculated using 1-second bins in cleaned event files. If a bin has >2000 counts, and if more than 50% of those come from <1% of pixels, then it is considered to be noise-dominated and hence unusable.
| Quadrant | # 1 sec bins | Bins with >0 counts | Bins with >2000 counts | High rate bins dominated by noise | Noise dominated (total time) | Noise dominated (detector-on time) | Marked lightcurve |
|---|---|---|---|---|---|---|---|
| A | 8162 | 7539 | 0 | 0 | 0.00% | 0.00% | 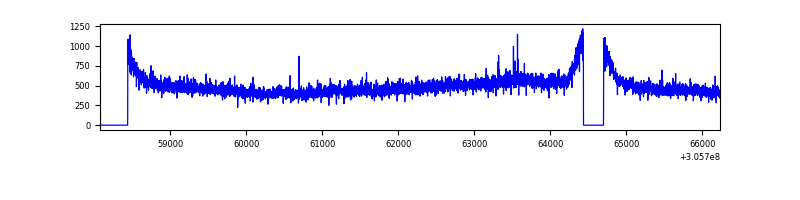 |
| B | 8163 | 7538 | 33 | 33 | 0.40% | 0.44% | 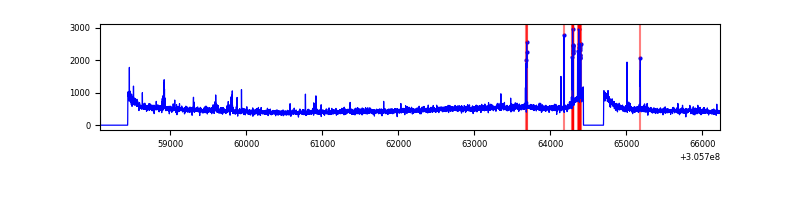 |
| C | 8163 | 7538 | 0 | 0 | 0.00% | 0.00% | 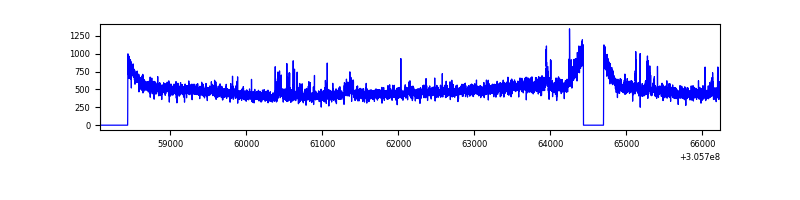 |
| D | 8163 | 7540 | 371 | 371 | 4.54% | 4.92% | 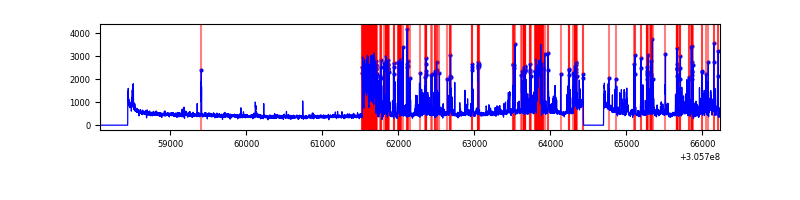 |
Top three noisy pixels from each quadrant. If the there are fewer than three noisy pixels in the level2.evt file, extra rows are filled as -1
| Pixel properties | Quadrant properties | ||||||
|---|---|---|---|---|---|---|---|
| Quadrant | DetID | PixID | Counts | Sigma | Mean | Median | Sigma |
| A | 5 | 168 | 120319 | 635.42 | 926 | 906 | 187.9 |
| A | 11 | 47 | 19712 | 100.07 | 926 | 906 | 187.9 |
| A | 13 | 254 | 8538 | 40.61 | 926 | 906 | 187.9 |
| B | 3 | 64 | 115281 | 644.41 | 915 | 889 | 177.5 |
| B | 0 | 230 | 45180 | 249.51 | 915 | 889 | 177.5 |
| B | 6 | 36 | 23865 | 129.43 | 915 | 889 | 177.5 |
| C | 14 | 238 | 137245 | 643.26 | 893 | 898 | 212.0 |
| C | 3 | 233 | 125079 | 585.86 | 893 | 898 | 212.0 |
| C | 13 | 61 | 6037 | 24.24 | 893 | 898 | 212.0 |
| D | 12 | 235 | 871381 | 3992.7 | 884 | 856 | 218.0 |
| D | 1 | 52 | 642325 | 2942.12 | 884 | 856 | 218.0 |
| D | 15 | 35 | 187153 | 854.46 | 884 | 856 | 218.0 |
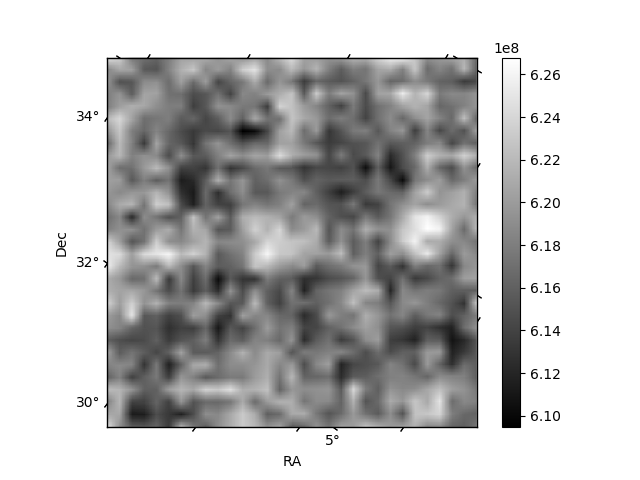
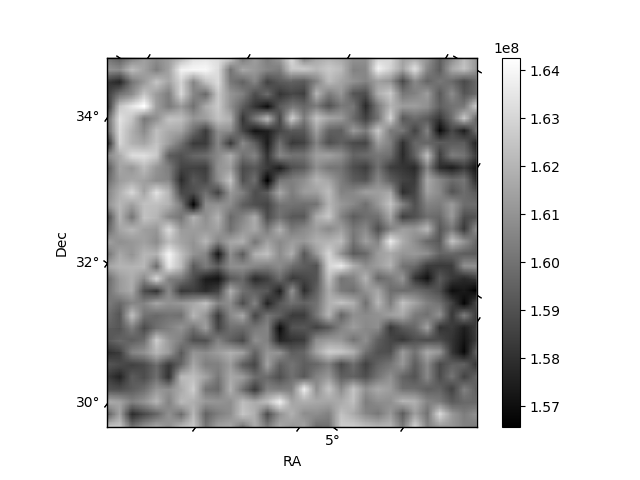
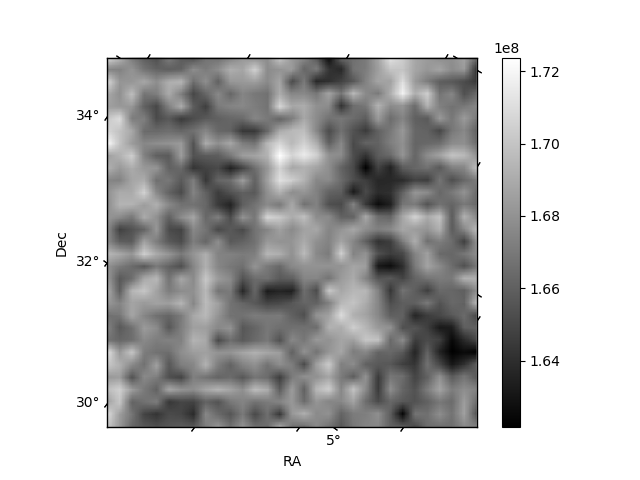
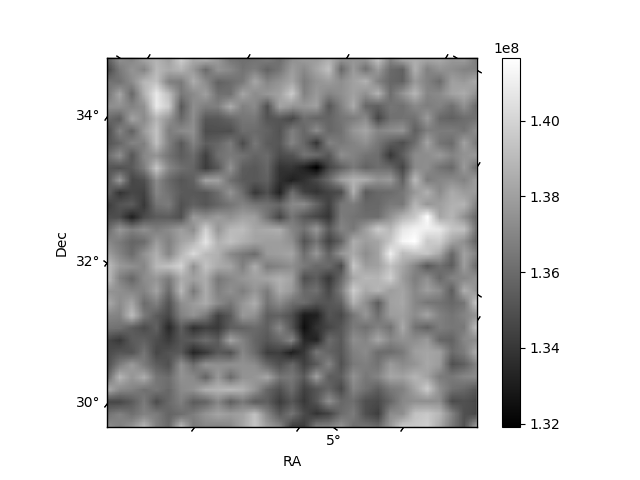
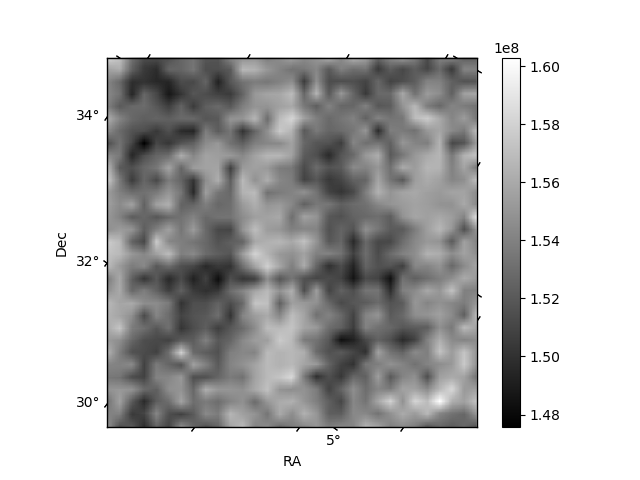
Histogram calculated using DETX and DETY for each event in the final _common_clean file
| Quadrant A | 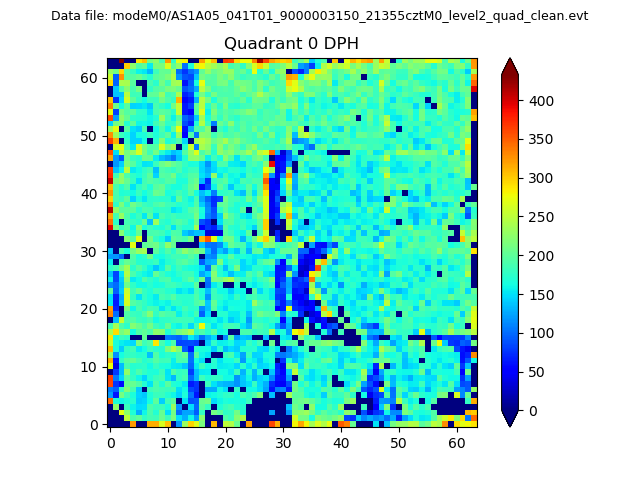 |
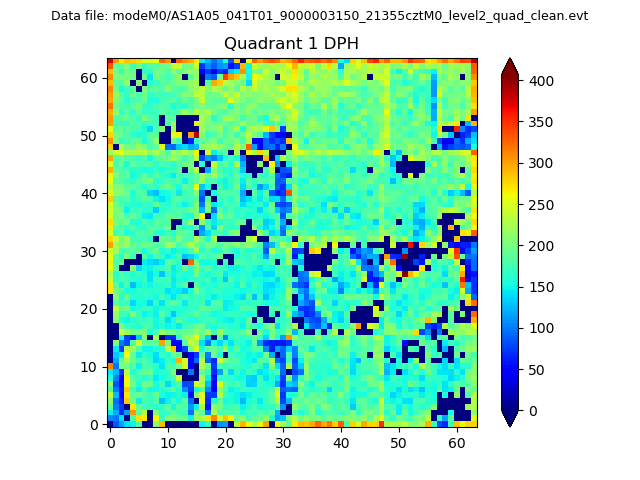 |
Quadrant B |
|---|---|---|---|
| Quadrant D |  |
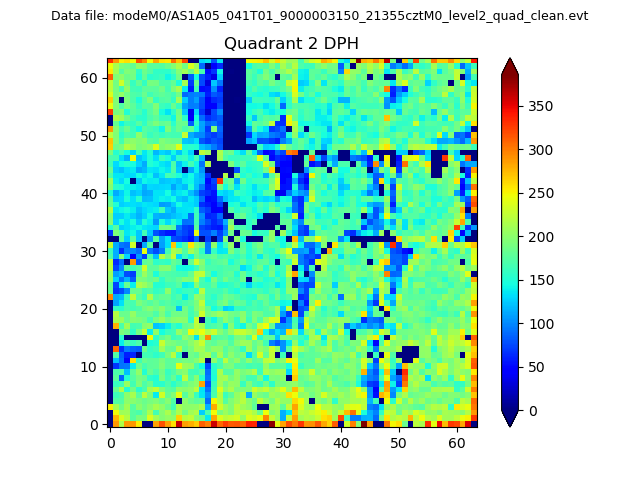 |
Quadrant C |
| Plot type | Count rate plots | Images |
|---|---|---|
| Comparison with Poisson distribution Blue bars denote a histogram of data divided into 1 sec bins. Red curve is a Poisson curve with rate = median count rate of data. |
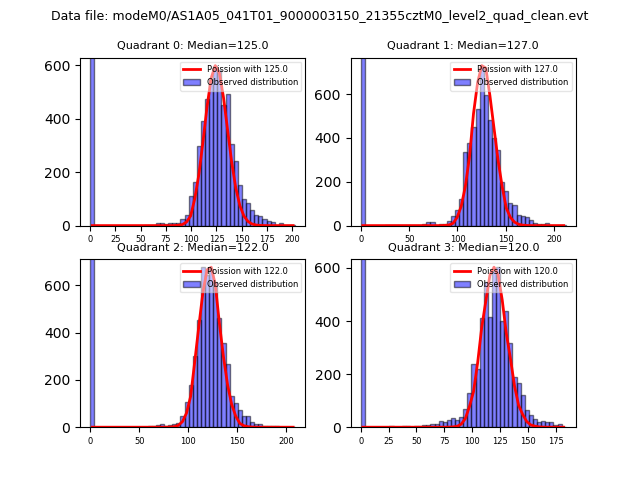 |
 |
| Quadrant-wise count rates Data is divided into 100 sec bins |
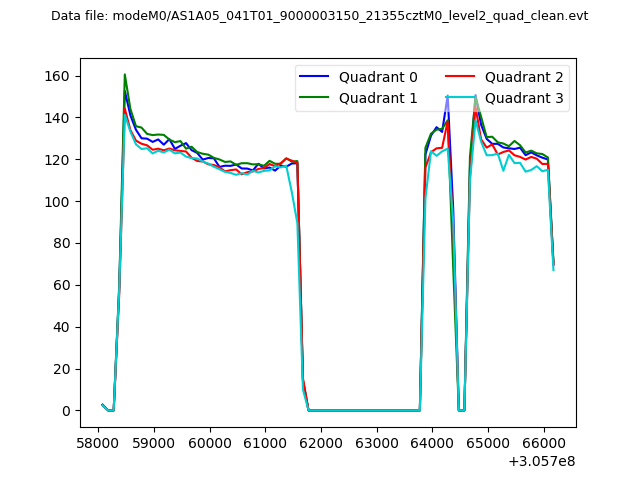 |
|
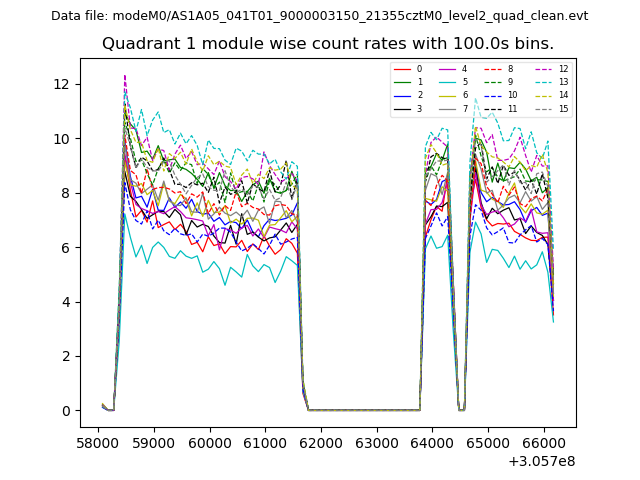
| Module-wise count rates for Quadrant A Data is divided into 100 sec bins |
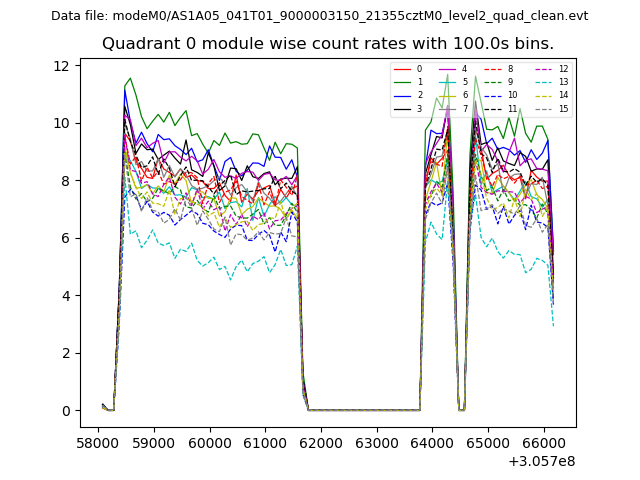 |
 |
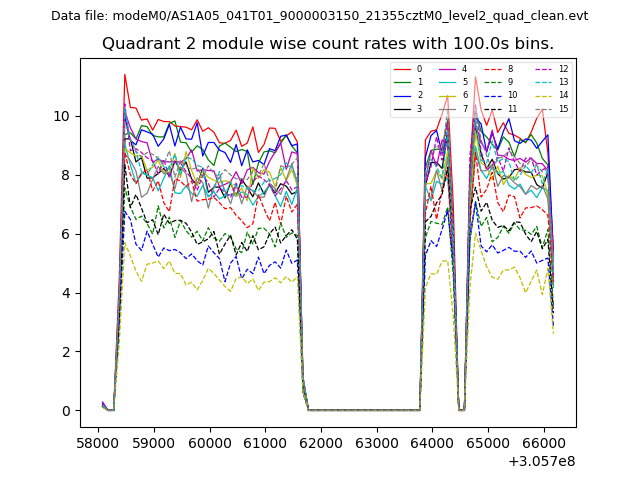
| Module-wise count rates for Quadrant B Data is divided into 100 sec bins |
 |
 |
| Module-wise count rates for Quadrant C Data is divided into 100 sec bins |
 |
 |
| Module-wise count rates for Quadrant D Data is divided into 100 sec bins |
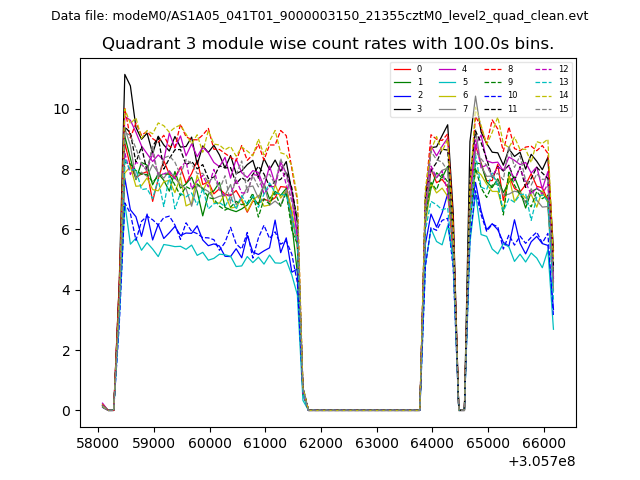 |
 |
| Parameter | Plot |
|---|---|
| CZT HV Monitor | 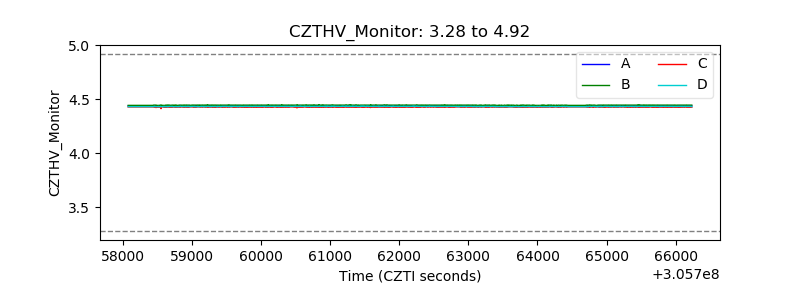 |
| D_VDD | 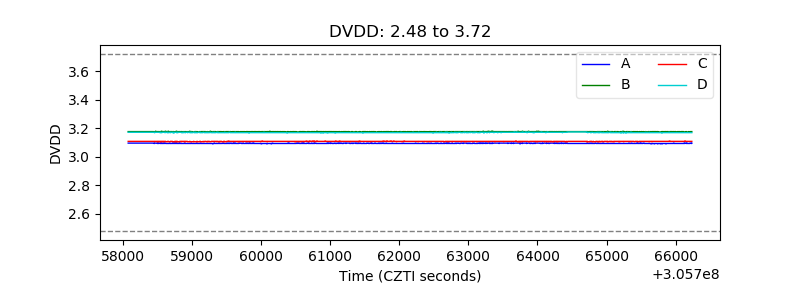 |
| Temperature 1 | 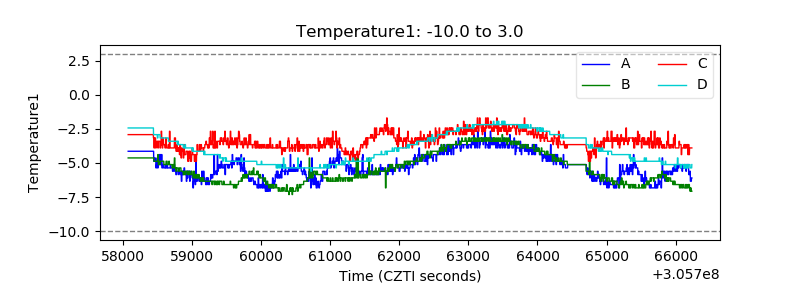 |
| Veto HV Monitor | 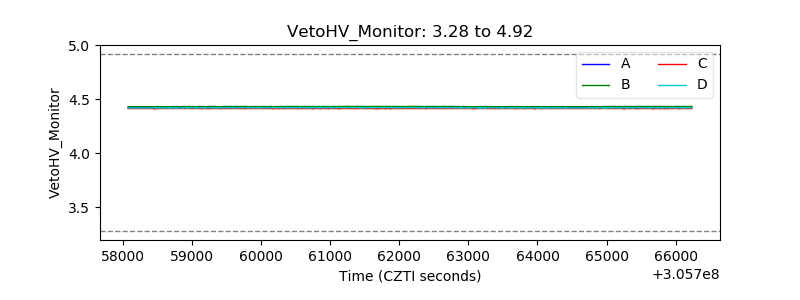 |
| Veto LLD | 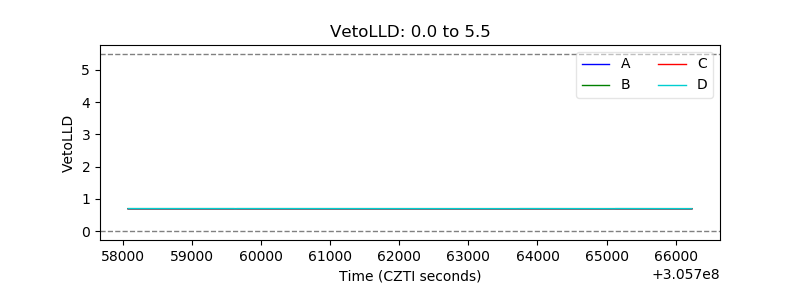 |
| Alpha Counter | 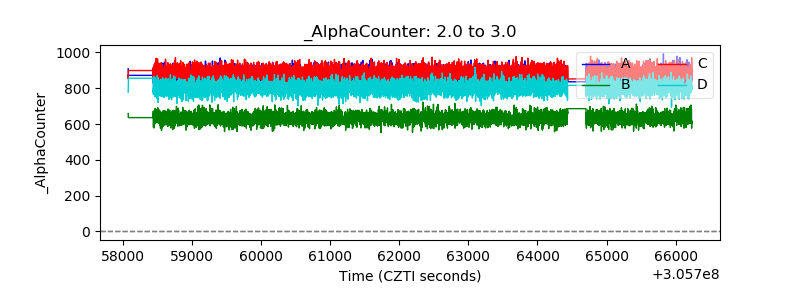 |
| _CPM_Rate | 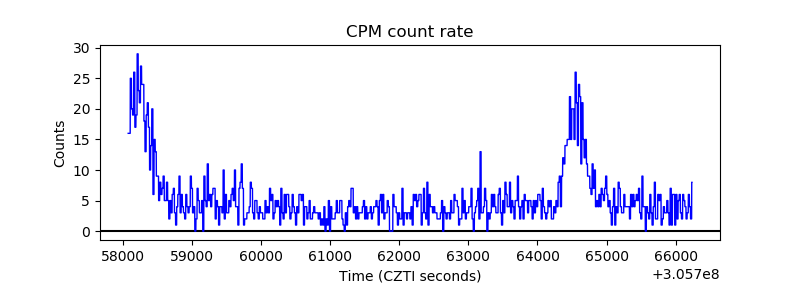 |
| CZT Counter | 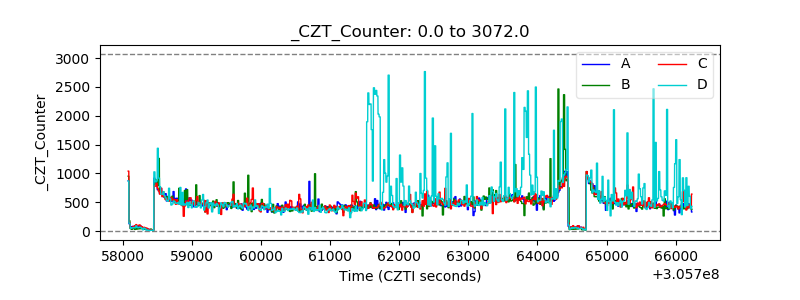 |
| +2.5 Volts monitor |  |
| +5 Volts monitor |  |
| _ROLL_ROT | 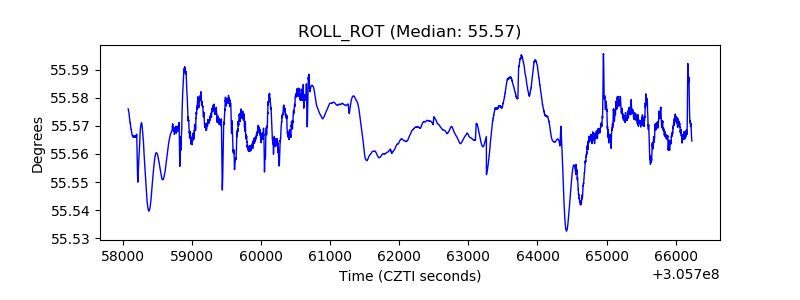 |
| _Roll_DEC | 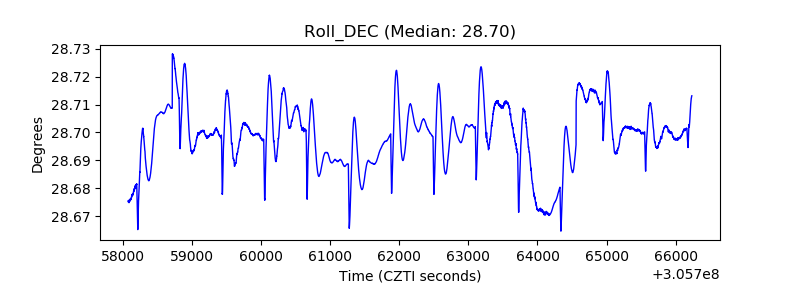 |
| _Roll_RA | 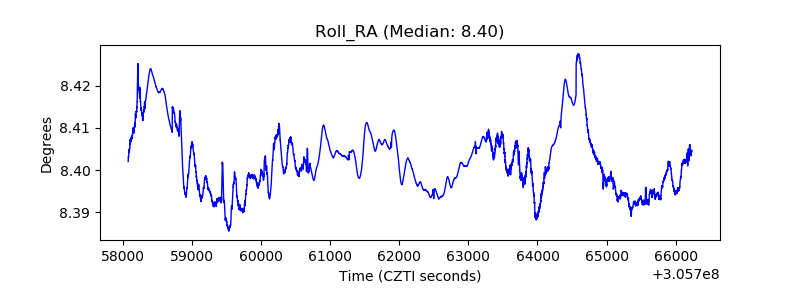 |
| Veto Counter | 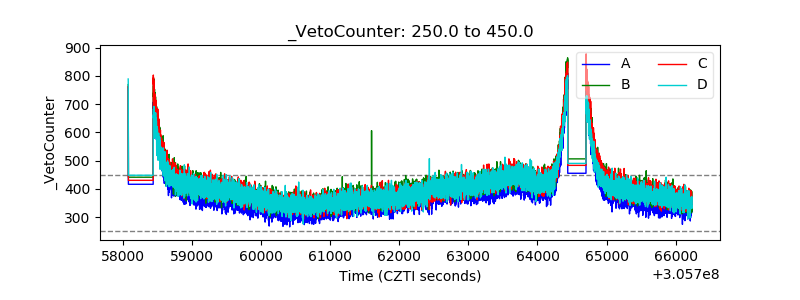 |