| Param | Original file | Final file |
|---|---|---|
| Filename | modeM0/AS1A05_041T01_9000003150_21358cztM0_level2.evt | modeM0/AS1A05_041T01_9000003150_21358cztM0_level2_quad_clean.evt |
| Size (bytes) | 1,312,810,560 | 239,921,280 |
| Size | 1.2 GB | 228.8 MB |
| Events in quadrant A | 8,991,520 | 1,518,470 |
| Events in quadrant B | 9,094,350 | 1,532,511 |
| Events in quadrant C | 9,286,554 | 1,480,393 |
| Events in quadrant D | 11,123,772 | 1,448,327 |
| Mode SS | |||
|---|---|---|---|
| Quadrant | BADHDUFLAG | Total packets | Discarded packets |
| A | 0 | 394 | 10 |
| B | 0 | 394 | 14 |
| C | 0 | 394 | 16 |
| D | 0 | 394 | 16 |
| Mode M0 | |||
|---|---|---|---|
| Quadrant | BADHDUFLAG | Total packets | Discarded packets |
| A | 0 | 39876 | 1182 |
| B | 0 | 40462 | 1207 |
| C | 0 | 41009 | 1260 |
| D | 0 | 47385 | 1474 |
| Mode M9 | |||
|---|---|---|---|
| Quadrant | BADHDUFLAG | Total packets | Discarded packets |
| A | 0 | 20 | 0 |
| B | 0 | 20 | 0 |
| C | 0 | 20 | 1 |
| D | 0 | 20 | 1 |
| Quadrant | Total seconds | Saturated seconds | Saturation percentage |
|---|---|---|---|
| A | 18690 | 163 | 0.872124% |
| B | 18684 | 281 | 1.503961% |
| C | 18670 | 352 | 1.885378% |
| D | 18631 | 529 | 2.839354% |
Noise dominated data is calculated using 1-second bins in cleaned event files. If a bin has >2000 counts, and if more than 50% of those come from <1% of pixels, then it is considered to be noise-dominated and hence unusable.
| Quadrant | # 1 sec bins | Bins with >0 counts | Bins with >2000 counts | High rate bins dominated by noise | Noise dominated (total time) | Noise dominated (detector-on time) | Marked lightcurve |
|---|---|---|---|---|---|---|---|
| A | 21288 | 19041 | 0 | 0 | 0.00% | 0.00% | 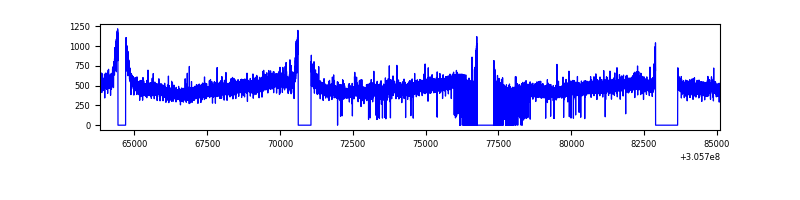 |
| B | 21288 | 19030 | 30 | 30 | 0.14% | 0.16% | 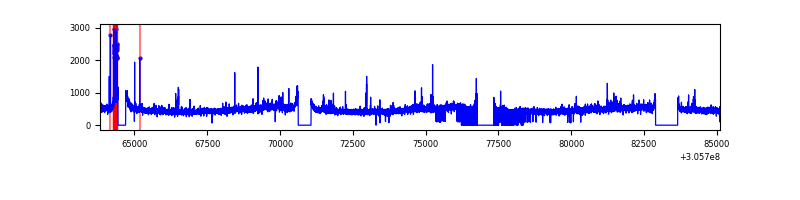 |
| C | 21289 | 19036 | 32 | 32 | 0.15% | 0.17% | 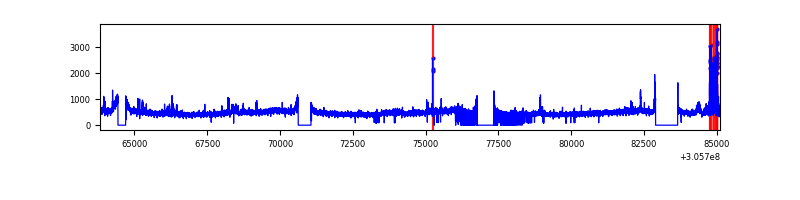 |
| D | 21289 | 19003 | 367 | 367 | 1.72% | 1.93% | 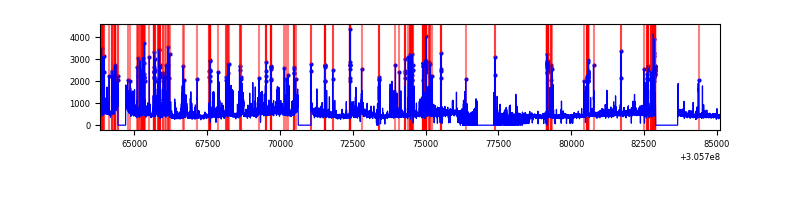 |
Top three noisy pixels from each quadrant. If the there are fewer than three noisy pixels in the level2.evt file, extra rows are filled as -1
| Pixel properties | Quadrant properties | ||||||
|---|---|---|---|---|---|---|---|
| Quadrant | DetID | PixID | Counts | Sigma | Mean | Median | Sigma |
| A | 5 | 168 | 213079 | 466.63 | 2257 | 2207 | 451.9 |
| A | 11 | 47 | 59996 | 127.88 | 2257 | 2207 | 451.9 |
| A | 15 | 174 | 29776 | 61.01 | 2257 | 2207 | 451.9 |
| B | 0 | 230 | 130754 | 298.56 | 2241 | 2183 | 430.6 |
| B | 3 | 64 | 117694 | 268.23 | 2241 | 2183 | 430.6 |
| B | 0 | 197 | 58447 | 130.65 | 2241 | 2183 | 430.6 |
| C | 3 | 233 | 497268 | 976.79 | 2159 | 2172 | 506.9 |
| C | 14 | 238 | 334629 | 655.91 | 2159 | 2172 | 506.9 |
| C | 10 | 91 | 39829 | 74.29 | 2159 | 2172 | 506.9 |
| D | 12 | 235 | 1787127 | 3408.55 | 2169 | 2108 | 523.7 |
| D | 1 | 52 | 808446 | 1539.73 | 2169 | 2108 | 523.7 |
| D | 15 | 35 | 164914 | 310.88 | 2169 | 2108 | 523.7 |
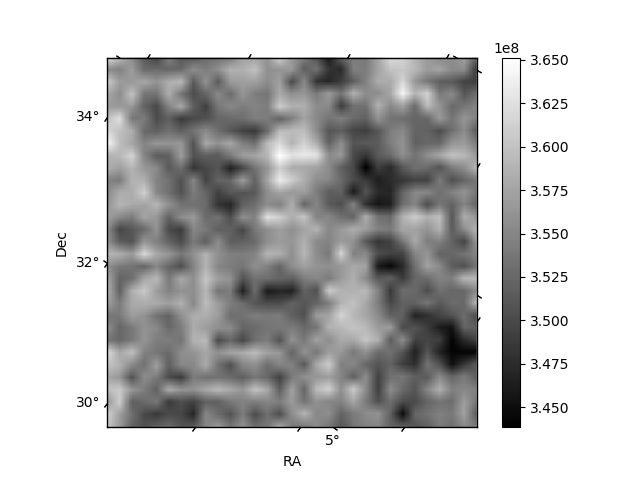
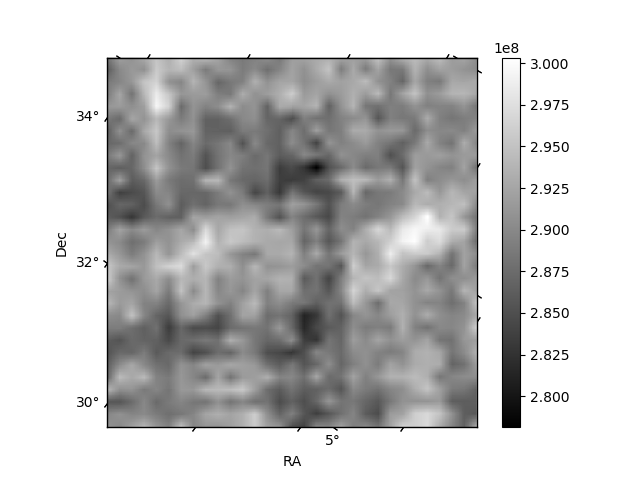
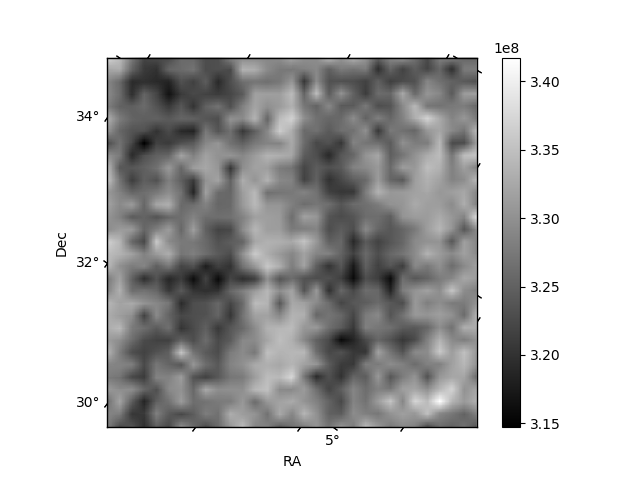
Histogram calculated using DETX and DETY for each event in the final _common_clean file
| Quadrant A | 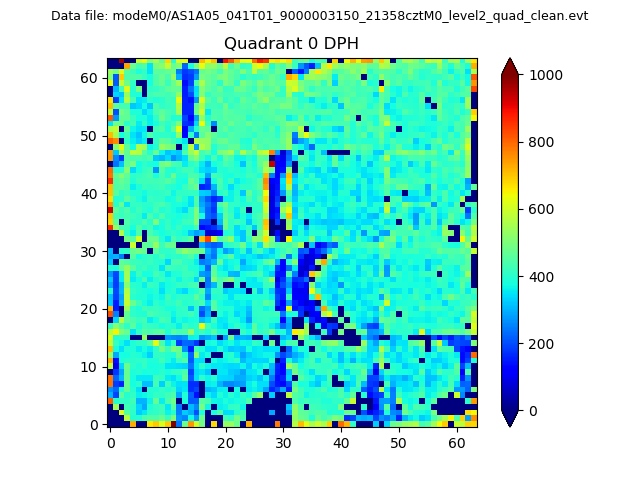 |
 |
Quadrant B |
|---|---|---|---|
| Quadrant D | 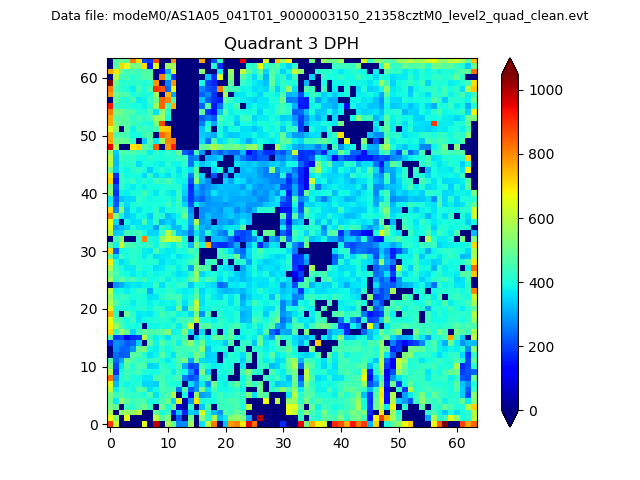 |
 |
Quadrant C |
| Plot type | Count rate plots | Images |
|---|---|---|
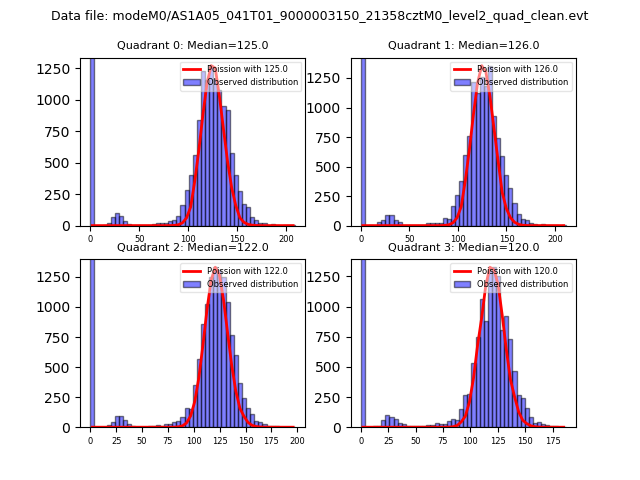
| Comparison with Poisson distribution Blue bars denote a histogram of data divided into 1 sec bins. Red curve is a Poisson curve with rate = median count rate of data. |
 |
 |
| Quadrant-wise count rates Data is divided into 100 sec bins |
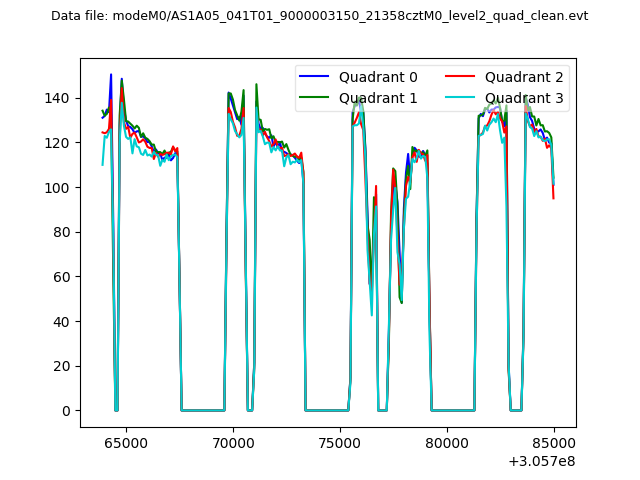 |
|
| Module-wise count rates for Quadrant A Data is divided into 100 sec bins |
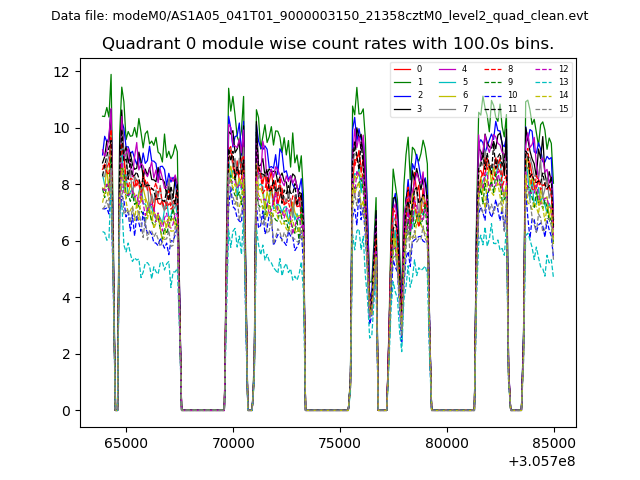 |
 |
| Module-wise count rates for Quadrant B Data is divided into 100 sec bins |
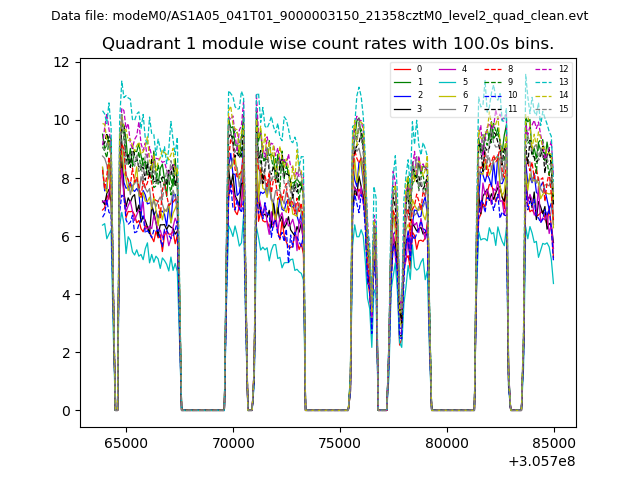 |
 |
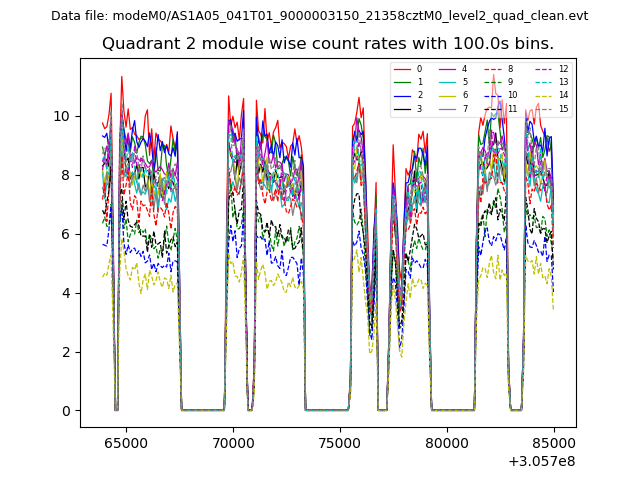
| Module-wise count rates for Quadrant C Data is divided into 100 sec bins |
 |
 |
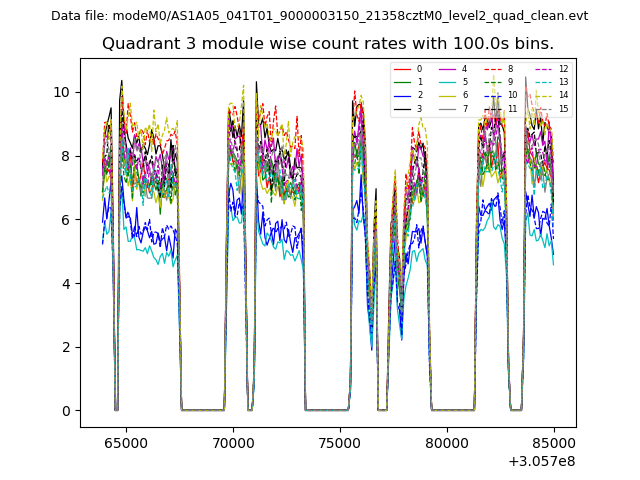
| Module-wise count rates for Quadrant D Data is divided into 100 sec bins |
 |
 |
| Parameter | Plot |
|---|---|
| CZT HV Monitor | 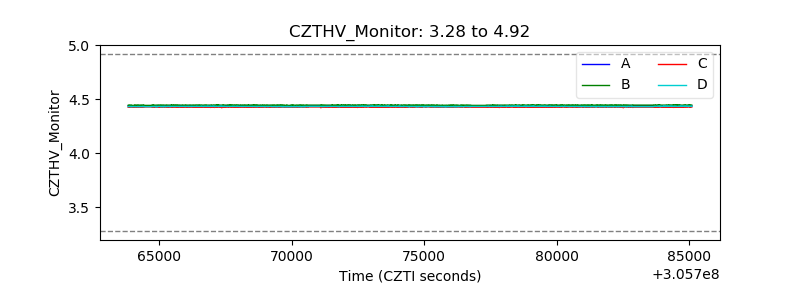 |
| D_VDD | 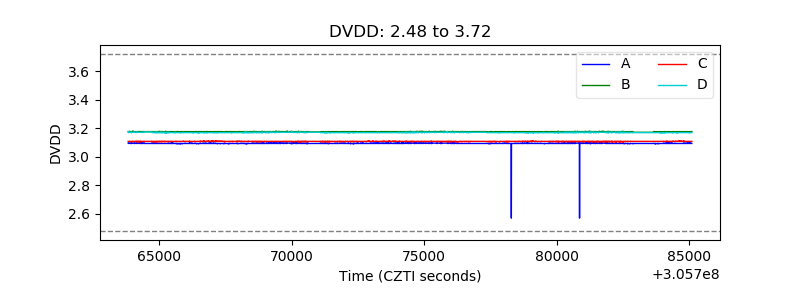 |
| Temperature 1 | 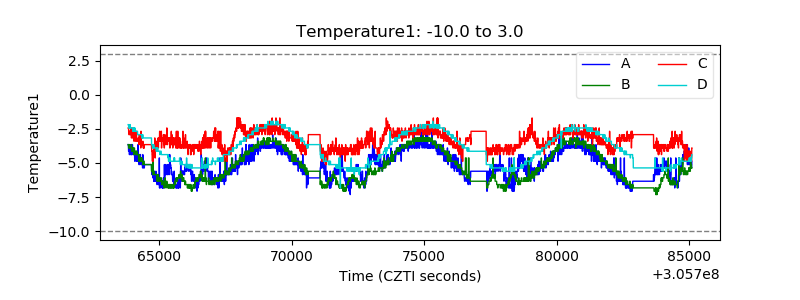 |
| Veto HV Monitor | 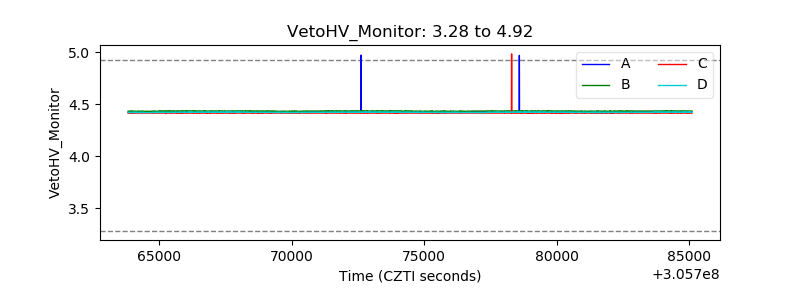 |
| Veto LLD | 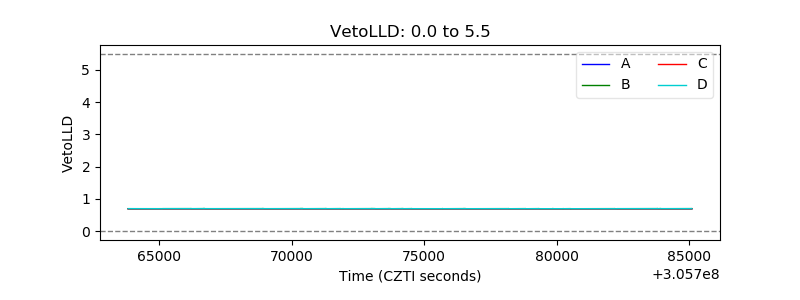 |
| Alpha Counter | 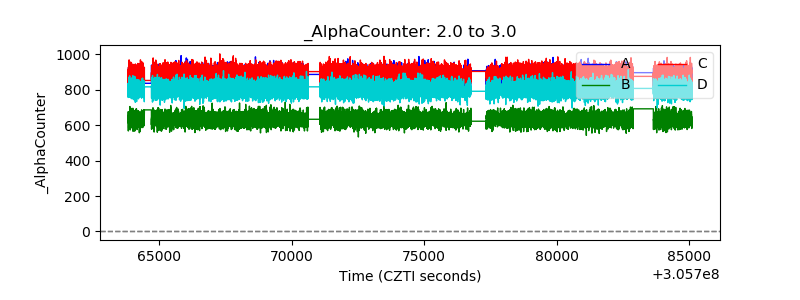 |
| _CPM_Rate | 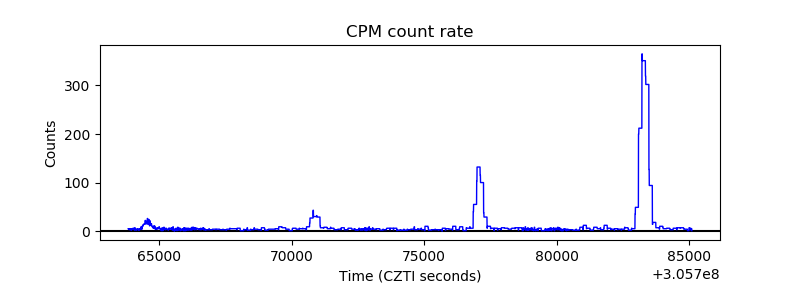 |
| CZT Counter |  |
| +2.5 Volts monitor |  |
| +5 Volts monitor |  |
| _ROLL_ROT | 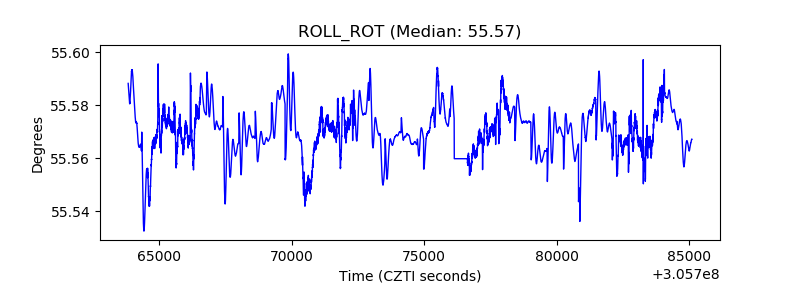 |
| _Roll_DEC | 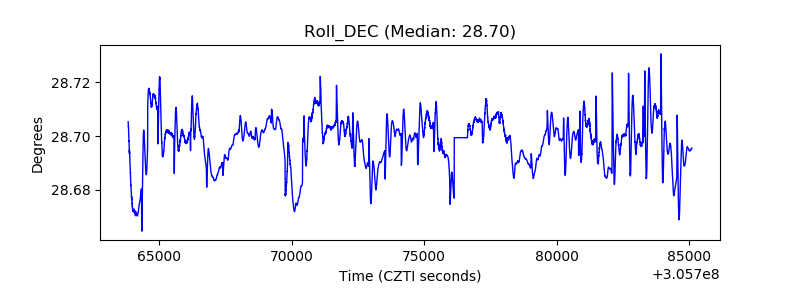 |
| _Roll_RA | 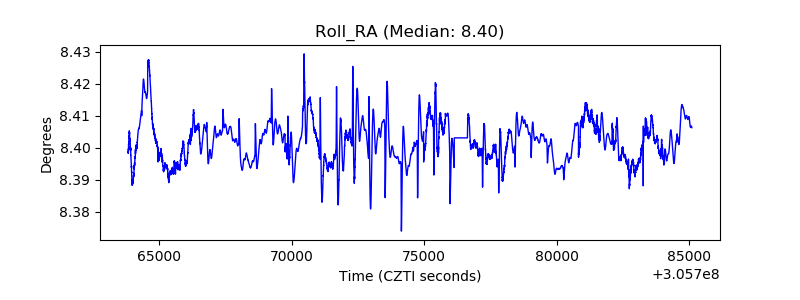 |
| Veto Counter | 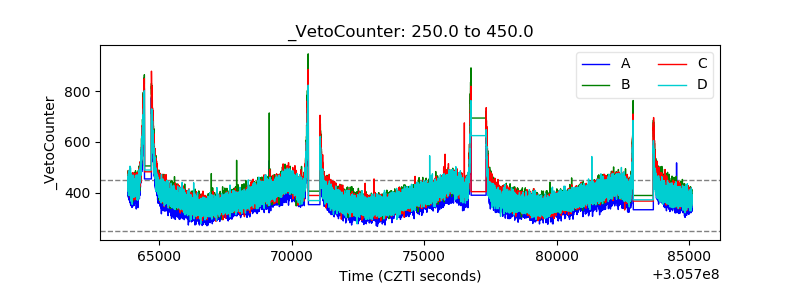 |