| Param | Original file | Final file |
|---|---|---|
| Filename | modeM0/AS1A05_041T01_9000003150_21359cztM0_level2.evt | modeM0/AS1A05_041T01_9000003150_21359cztM0_level2_quad_clean.evt |
| Size (bytes) | 476,640,000 | 78,338,880 |
| Size | 454.6 MB | 74.7 MB |
| Events in quadrant A | 3,071,840 | 491,557 |
| Events in quadrant B | 3,028,833 | 501,817 |
| Events in quadrant C | 4,412,370 | 468,073 |
| Events in quadrant D | 3,493,658 | 470,470 |
| Mode SS | |||
|---|---|---|---|
| Quadrant | BADHDUFLAG | Total packets | Discarded packets |
| A | 0 | 130 | 0 |
| B | 0 | 130 | 0 |
| C | 0 | 130 | 0 |
| D | 0 | 130 | 0 |
| Mode M0 | |||
|---|---|---|---|
| Quadrant | BADHDUFLAG | Total packets | Discarded packets |
| A | 0 | 12847 | 1 |
| B | 0 | 12898 | 1 |
| C | 0 | 17297 | 1 |
| D | 0 | 14564 | 1 |
| Mode M9 | |||
|---|---|---|---|
| Quadrant | BADHDUFLAG | Total packets | Discarded packets |
| A | 0 | 9 | 0 |
| B | 0 | 9 | 0 |
| C | 0 | 9 | 0 |
| D | 0 | 9 | 0 |
| Quadrant | Total seconds | Saturated seconds | Saturation percentage |
|---|---|---|---|
| A | 6301 | 46 | 0.730043% |
| B | 6301 | 52 | 0.825266% |
| C | 6301 | 294 | 4.665926% |
| D | 6301 | 159 | 2.523409% |
Noise dominated data is calculated using 1-second bins in cleaned event files. If a bin has >2000 counts, and if more than 50% of those come from <1% of pixels, then it is considered to be noise-dominated and hence unusable.
| Quadrant | # 1 sec bins | Bins with >0 counts | Bins with >2000 counts | High rate bins dominated by noise | Noise dominated (total time) | Noise dominated (detector-on time) | Marked lightcurve |
|---|---|---|---|---|---|---|---|
| A | 7211 | 6301 | 0 | 0 | 0.00% | 0.00% | 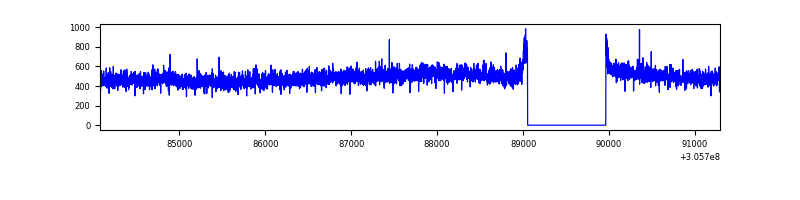 |
| B | 7211 | 6301 | 1 | 1 | 0.01% | 0.02% | 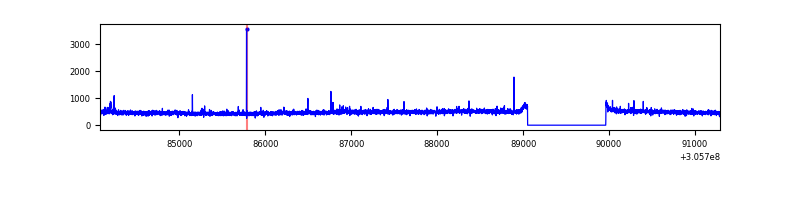 |
| C | 7211 | 6301 | 130 | 130 | 1.80% | 2.06% | 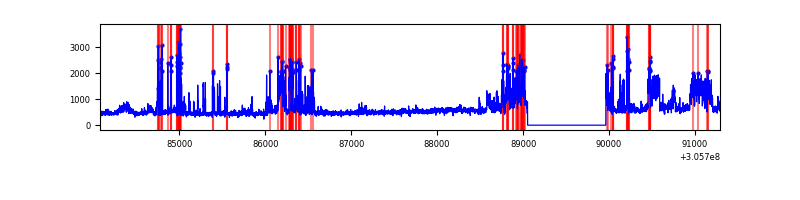 |
| D | 7211 | 6301 | 104 | 104 | 1.44% | 1.65% | 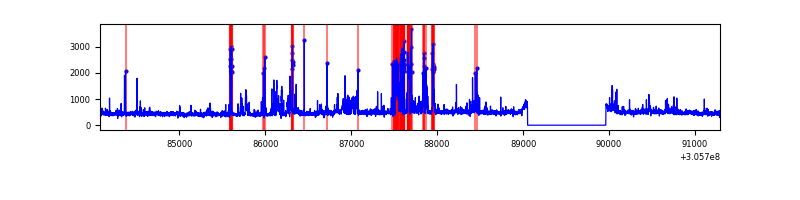 |
Top three noisy pixels from each quadrant. If the there are fewer than three noisy pixels in the level2.evt file, extra rows are filled as -1
| Pixel properties | Quadrant properties | ||||||
|---|---|---|---|---|---|---|---|
| Quadrant | DetID | PixID | Counts | Sigma | Mean | Median | Sigma |
| A | 5 | 168 | 131572 | 845.3 | 763 | 746 | 154.8 |
| A | 13 | 254 | 7684 | 44.83 | 763 | 746 | 154.8 |
| A | 3 | 137 | 6605 | 37.86 | 763 | 746 | 154.8 |
| B | 0 | 230 | 30151 | 200.66 | 759 | 741 | 146.6 |
| B | 12 | 111 | 18346 | 120.11 | 759 | 741 | 146.6 |
| B | 11 | 111 | 16082 | 104.67 | 759 | 741 | 146.6 |
| C | 3 | 233 | 1456332 | 8595.28 | 719 | 722 | 169.3 |
| C | 14 | 238 | 111859 | 656.26 | 719 | 722 | 169.3 |
| C | 10 | 91 | 41875 | 243.01 | 719 | 722 | 169.3 |
| D | 12 | 235 | 472834 | 2647.46 | 736 | 714 | 178.3 |
| D | 13 | 174 | 168150 | 938.91 | 736 | 714 | 178.3 |
| D | 1 | 52 | 38631 | 212.62 | 736 | 714 | 178.3 |
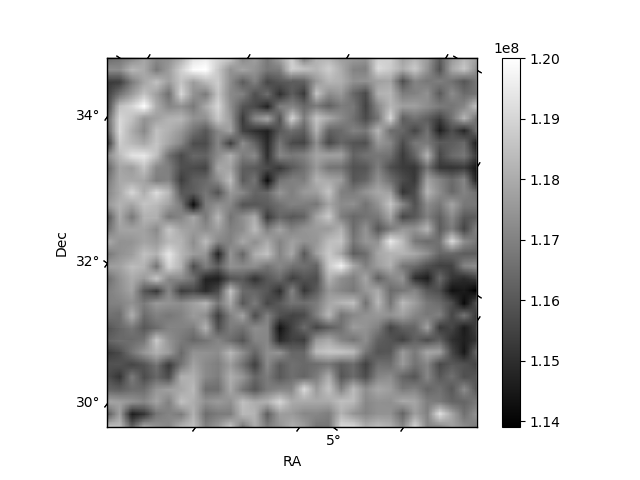
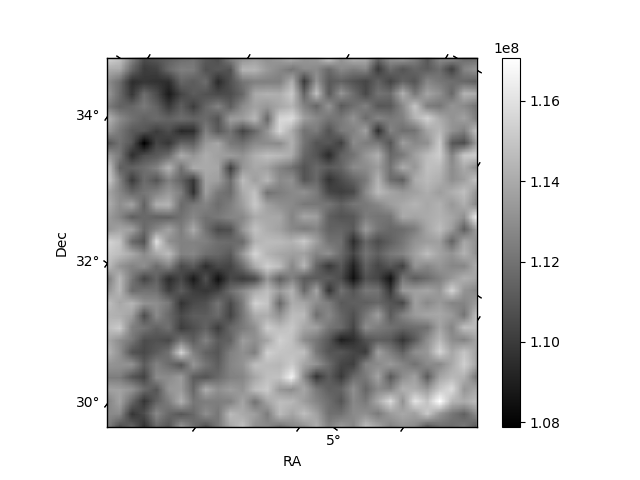
Histogram calculated using DETX and DETY for each event in the final _common_clean file
| Quadrant A | 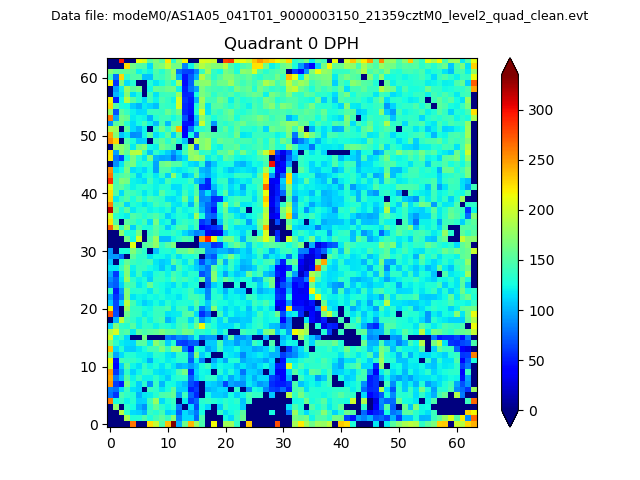 |
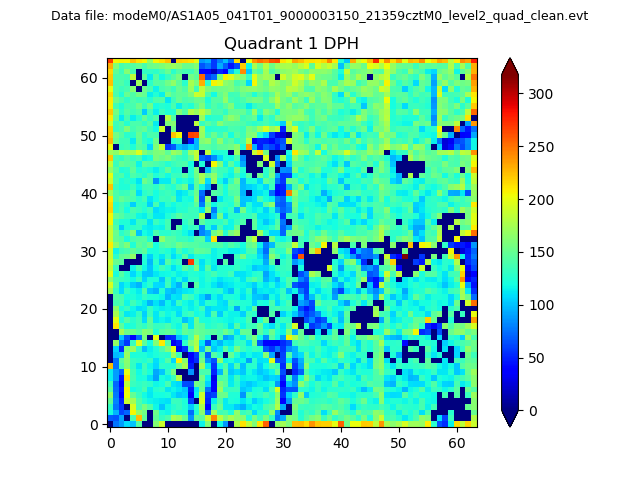 |
Quadrant B |
|---|---|---|---|
| Quadrant D |  |
 |
Quadrant C |
| Plot type | Count rate plots | Images |
|---|---|---|
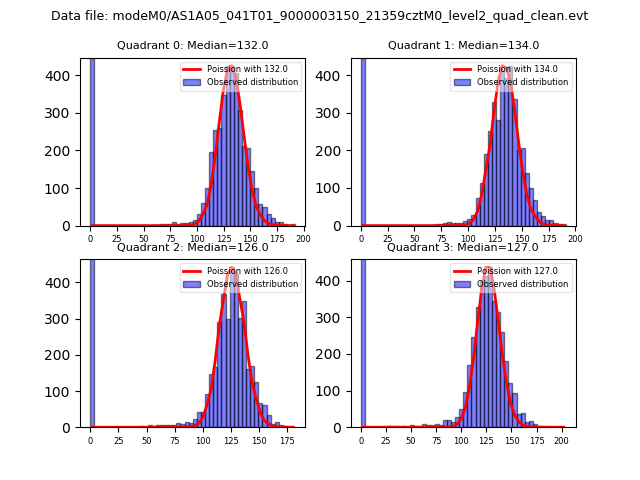
| Comparison with Poisson distribution Blue bars denote a histogram of data divided into 1 sec bins. Red curve is a Poisson curve with rate = median count rate of data. |
 |
 |
| Quadrant-wise count rates Data is divided into 100 sec bins |
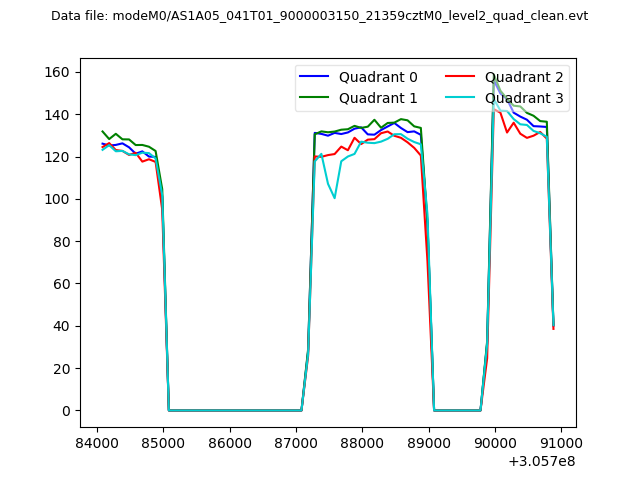 |
|
| Module-wise count rates for Quadrant A Data is divided into 100 sec bins |
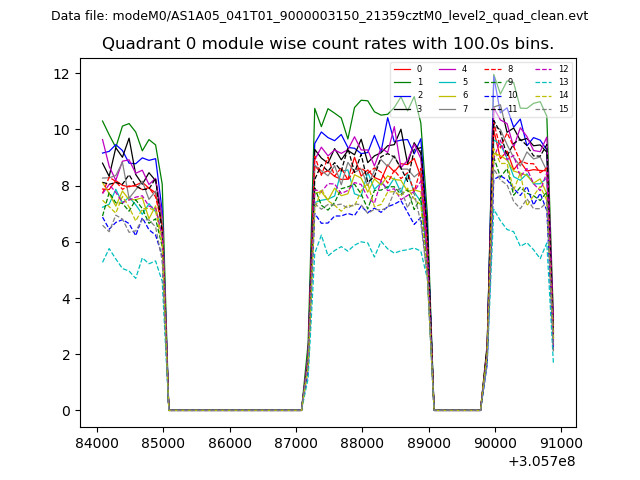 |
 |
| Module-wise count rates for Quadrant B Data is divided into 100 sec bins |
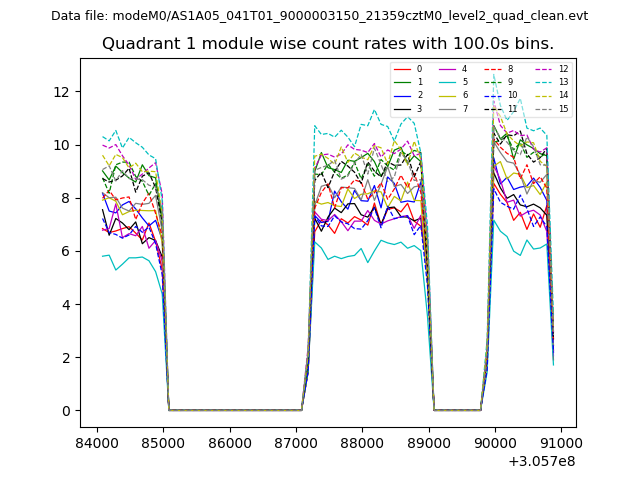 |
 |
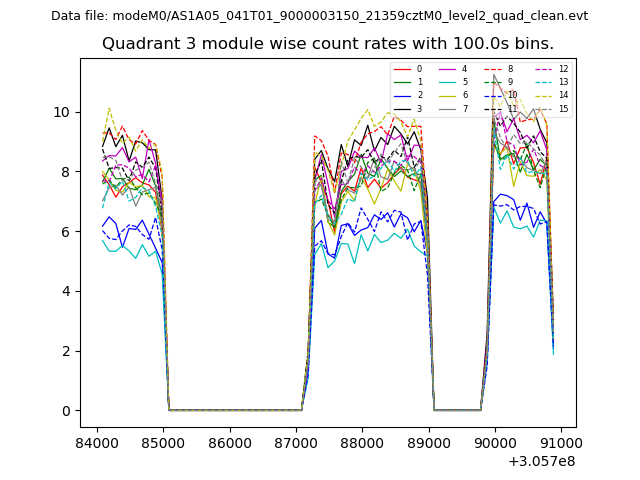
| Module-wise count rates for Quadrant C Data is divided into 100 sec bins |
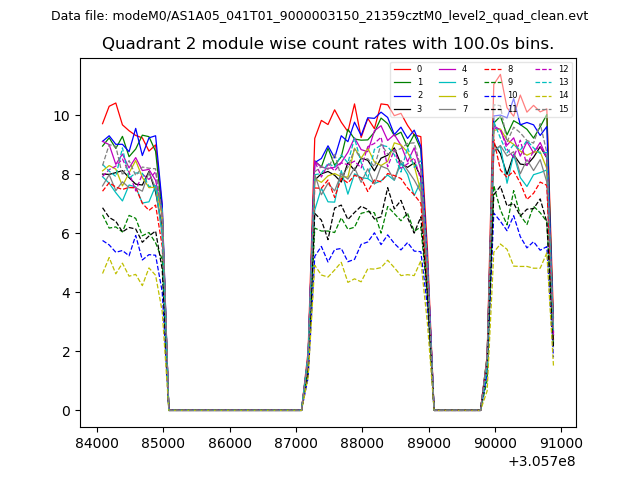 |
 |
| Module-wise count rates for Quadrant D Data is divided into 100 sec bins |
 |
 |
| Parameter | Plot |
|---|---|
| CZT HV Monitor | 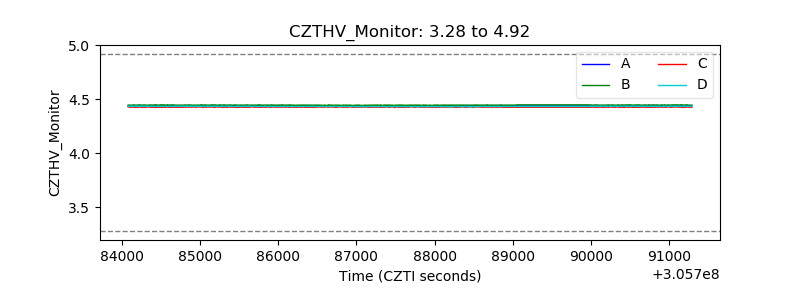 |
| D_VDD | 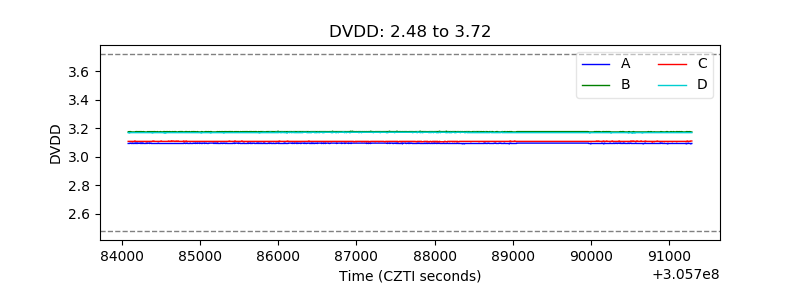 |
| Temperature 1 | 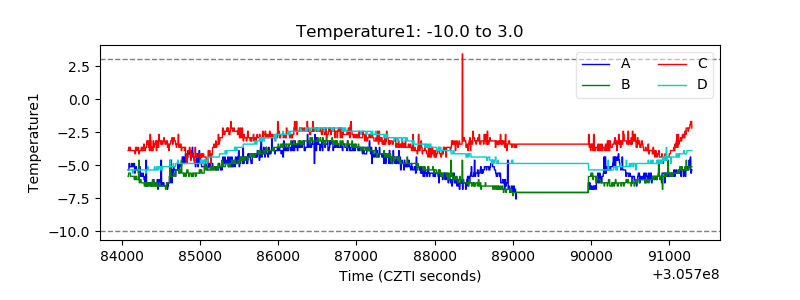 |
| Veto HV Monitor | 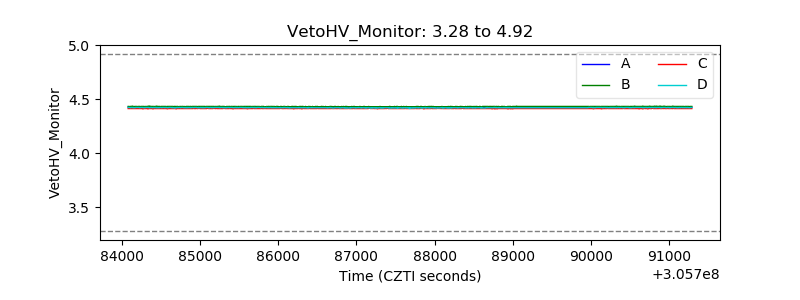 |
| Veto LLD | 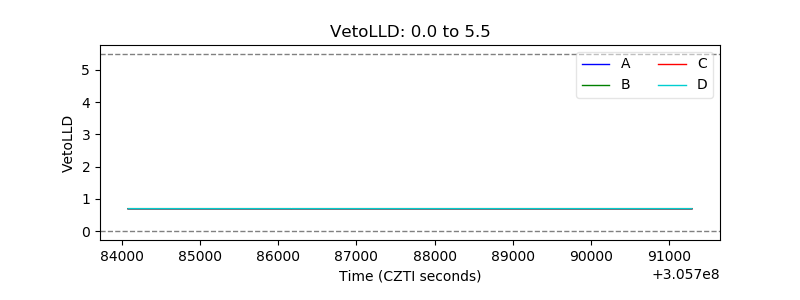 |
| Alpha Counter | 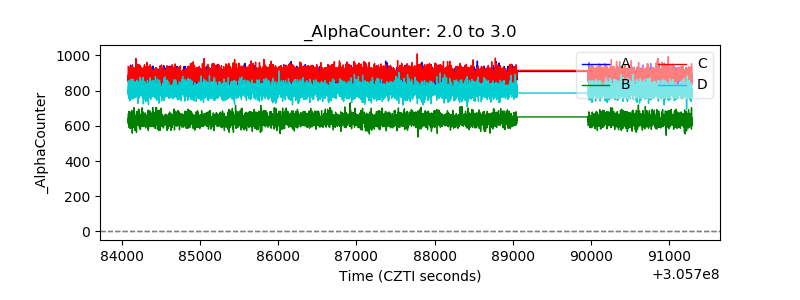 |
| _CPM_Rate | 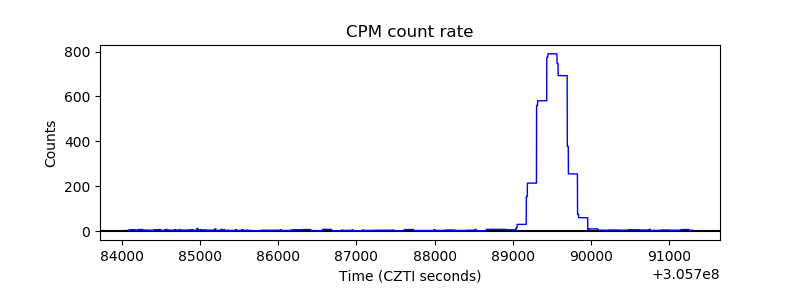 |
| CZT Counter |  |
| +2.5 Volts monitor |  |
| +5 Volts monitor | 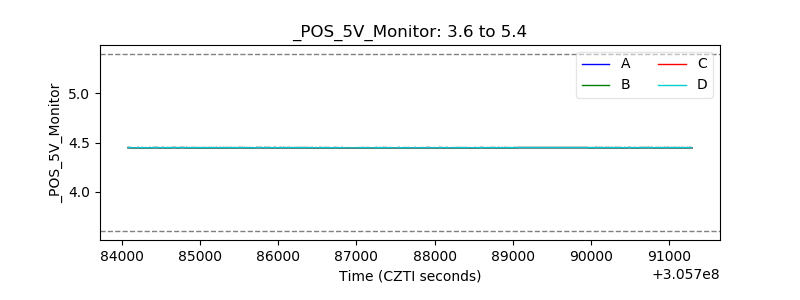 |
| _ROLL_ROT | 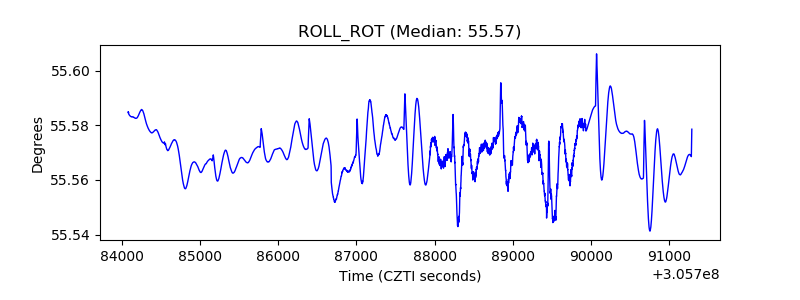 |
| _Roll_DEC | 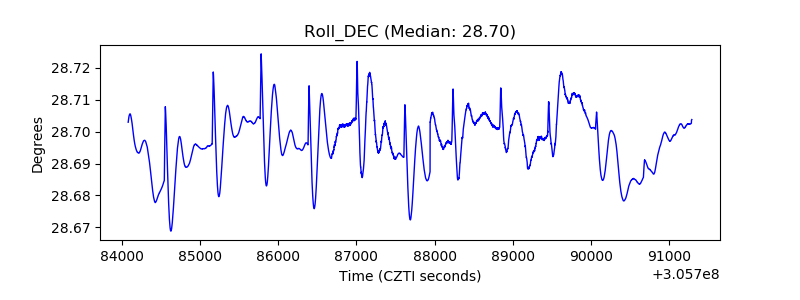 |
| _Roll_RA | 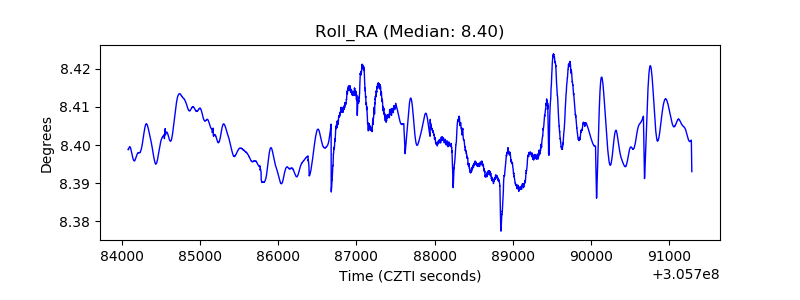 |
| Veto Counter | 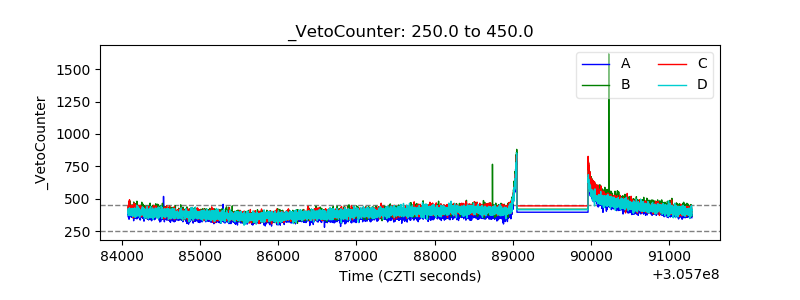 |