| Param | Original file | Final file |
|---|---|---|
| Filename | modeM0/AS1A05_041T01_9000003150_21360cztM0_level2.evt | modeM0/AS1A05_041T01_9000003150_21360cztM0_level2_quad_clean.evt |
| Size (bytes) | 535,835,520 | 79,692,480 |
| Size | 511.0 MB | 76.0 MB |
| Events in quadrant A | 3,314,885 | 501,731 |
| Events in quadrant B | 3,366,673 | 507,963 |
| Events in quadrant C | 4,822,846 | 476,442 |
| Events in quadrant D | 4,276,523 | 466,920 |
| Mode SS | |||
|---|---|---|---|
| Quadrant | BADHDUFLAG | Total packets | Discarded packets |
| A | 0 | 134 | 0 |
| B | 0 | 134 | 0 |
| C | 0 | 134 | 0 |
| D | 0 | 134 | 0 |
| Mode M0 | |||
|---|---|---|---|
| Quadrant | BADHDUFLAG | Total packets | Discarded packets |
| A | 0 | 13697 | 2 |
| B | 0 | 13963 | 2 |
| C | 0 | 18750 | 2 |
| D | 0 | 17019 | 2 |
| Mode M9 | |||
|---|---|---|---|
| Quadrant | BADHDUFLAG | Total packets | Discarded packets |
| A | 0 | 15 | 0 |
| B | 0 | 16 | 0 |
| C | 0 | 16 | 0 |
| D | 0 | 16 | 0 |
| Quadrant | Total seconds | Saturated seconds | Saturation percentage |
|---|---|---|---|
| A | 6593 | 60 | 0.910056% |
| B | 6593 | 67 | 1.016229% |
| C | 6593 | 272 | 4.125588% |
| D | 6593 | 187 | 2.836342% |
Noise dominated data is calculated using 1-second bins in cleaned event files. If a bin has >2000 counts, and if more than 50% of those come from <1% of pixels, then it is considered to be noise-dominated and hence unusable.
| Quadrant | # 1 sec bins | Bins with >0 counts | Bins with >2000 counts | High rate bins dominated by noise | Noise dominated (total time) | Noise dominated (detector-on time) | Marked lightcurve |
|---|---|---|---|---|---|---|---|
| A | 7633 | 6593 | 0 | 0 | 0.00% | 0.00% | 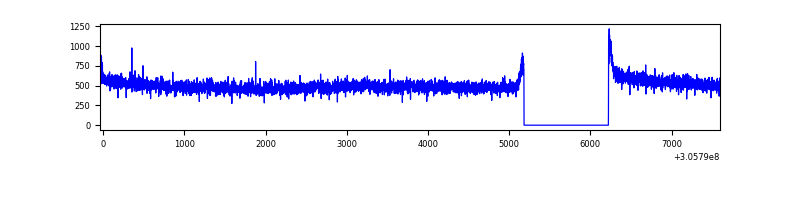 |
| B | 7633 | 6593 | 5 | 5 | 0.07% | 0.08% | 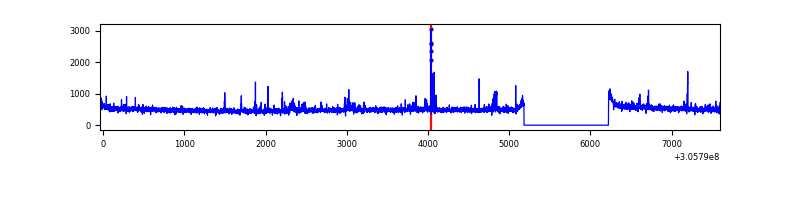 |
| C | 7633 | 6593 | 105 | 105 | 1.38% | 1.59% | 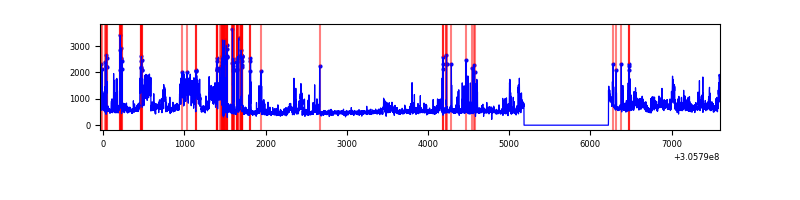 |
| D | 7633 | 6593 | 145 | 145 | 1.90% | 2.20% | 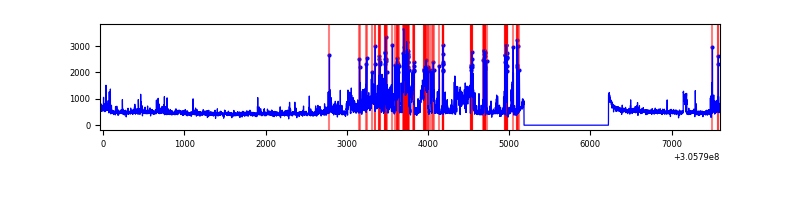 |
Top three noisy pixels from each quadrant. If the there are fewer than three noisy pixels in the level2.evt file, extra rows are filled as -1
| Pixel properties | Quadrant properties | ||||||
|---|---|---|---|---|---|---|---|
| Quadrant | DetID | PixID | Counts | Sigma | Mean | Median | Sigma |
| A | 5 | 168 | 91480 | 540.05 | 837 | 819 | 167.9 |
| A | 13 | 254 | 8543 | 46.01 | 837 | 819 | 167.9 |
| A | 0 | 226 | 7193 | 37.97 | 837 | 819 | 167.9 |
| B | 0 | 230 | 52311 | 323.45 | 830 | 811 | 159.2 |
| B | 0 | 197 | 43996 | 271.22 | 830 | 811 | 159.2 |
| B | 3 | 64 | 25146 | 152.84 | 830 | 811 | 159.2 |
| C | 3 | 233 | 1629815 | 8899.54 | 787 | 795 | 183.0 |
| C | 14 | 238 | 123444 | 670.05 | 787 | 795 | 183.0 |
| C | 13 | 61 | 5448 | 25.42 | 787 | 795 | 183.0 |
| D | 12 | 235 | 830165 | 4235.31 | 805 | 784 | 195.8 |
| D | 1 | 52 | 331136 | 1686.97 | 805 | 784 | 195.8 |
| D | 13 | 172 | 54800 | 275.84 | 805 | 784 | 195.8 |
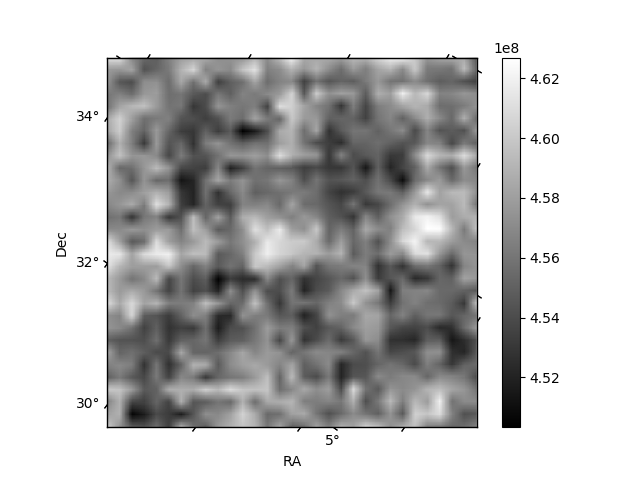
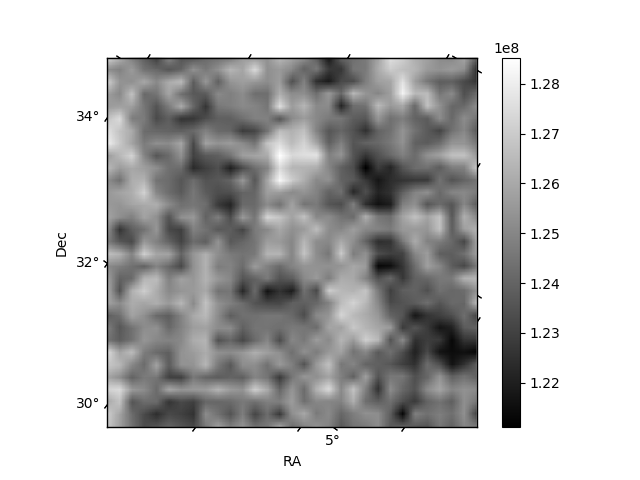
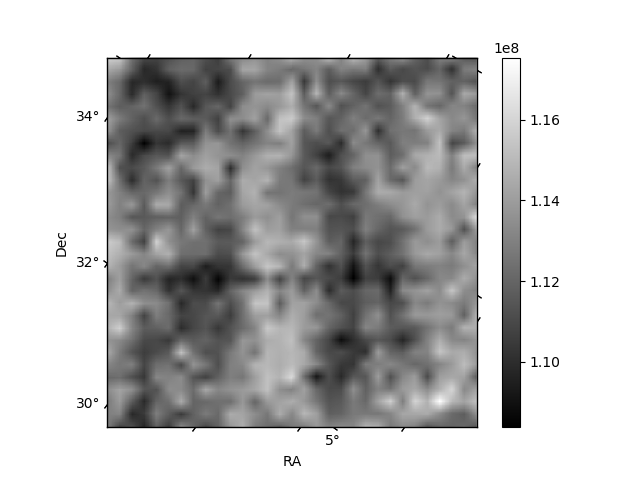
Histogram calculated using DETX and DETY for each event in the final _common_clean file
| Quadrant A | 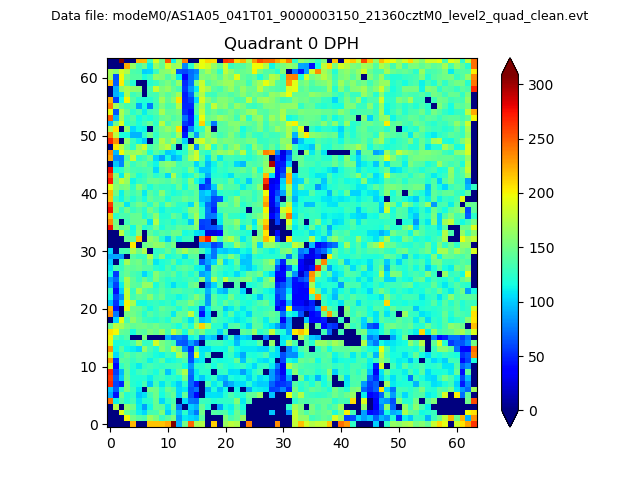 |
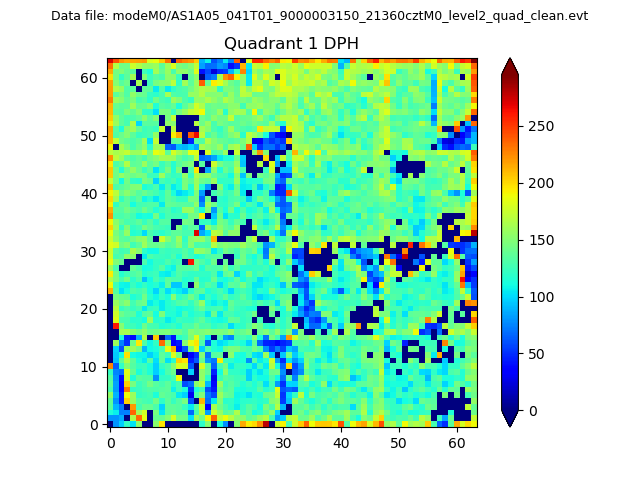 |
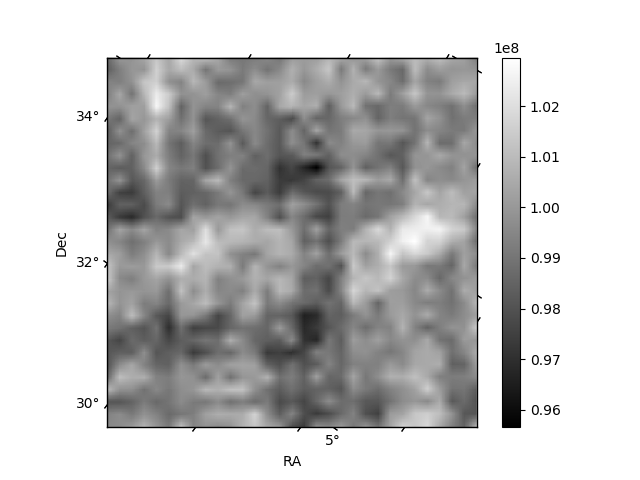
Quadrant B |
|---|---|---|---|
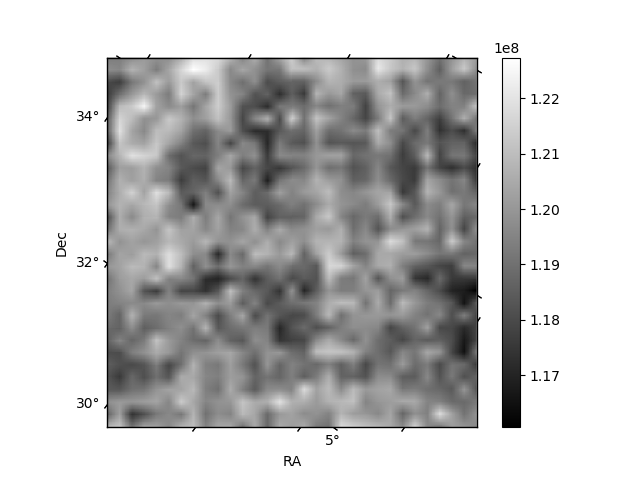
| Quadrant D | 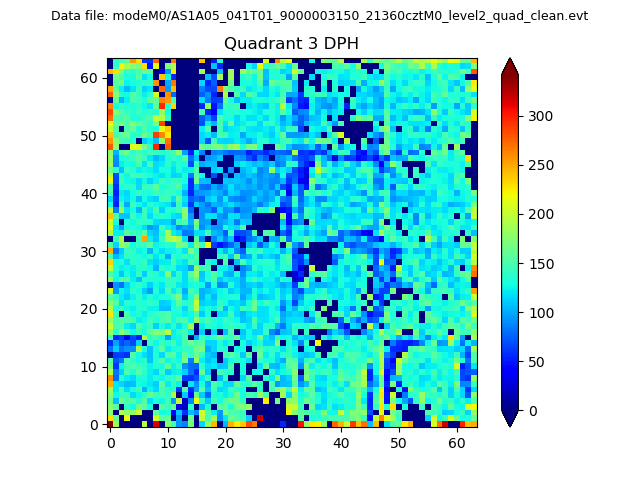 |
 |
Quadrant C |
| Plot type | Count rate plots | Images |
|---|---|---|
| Comparison with Poisson distribution Blue bars denote a histogram of data divided into 1 sec bins. Red curve is a Poisson curve with rate = median count rate of data. |
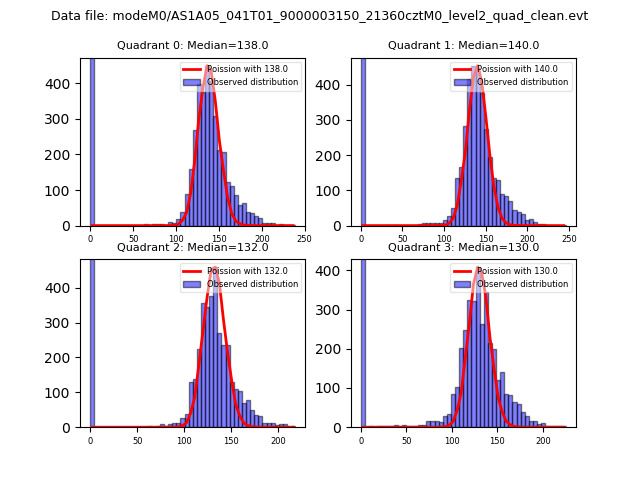 |
 |
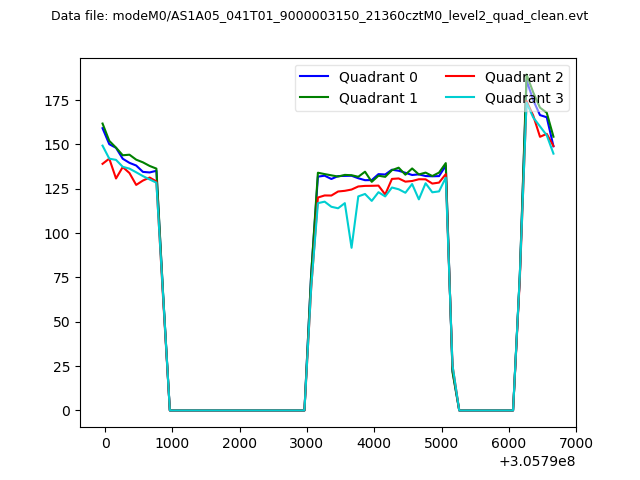
| Quadrant-wise count rates Data is divided into 100 sec bins |
 |
|
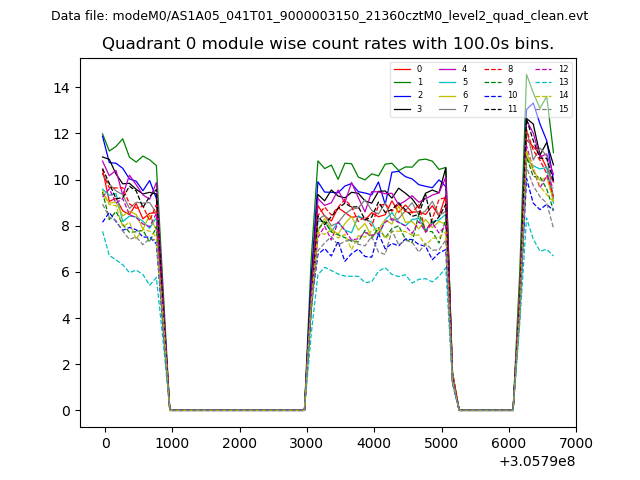
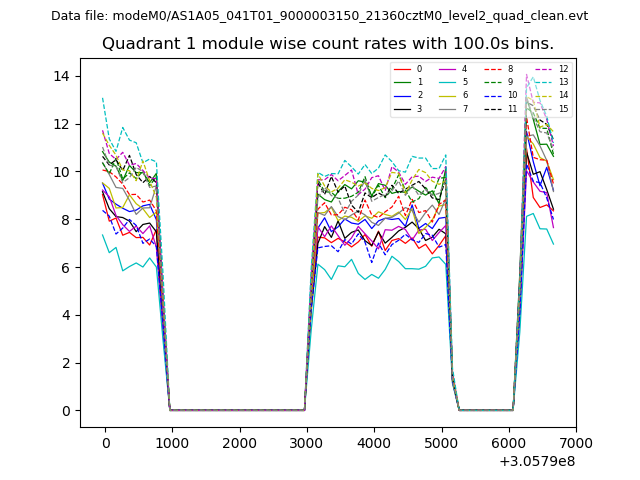
| Module-wise count rates for Quadrant A Data is divided into 100 sec bins |
 |
 |
| Module-wise count rates for Quadrant B Data is divided into 100 sec bins |
 |
 |
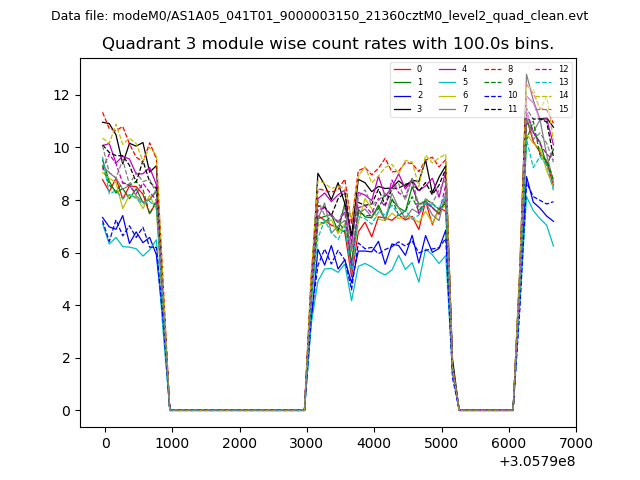
| Module-wise count rates for Quadrant C Data is divided into 100 sec bins |
 |
 |
| Module-wise count rates for Quadrant D Data is divided into 100 sec bins |
 |
 |
| Parameter | Plot |
|---|---|
| CZT HV Monitor | 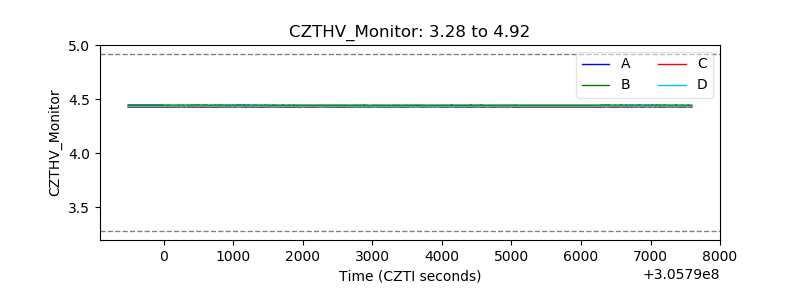 |
| D_VDD | 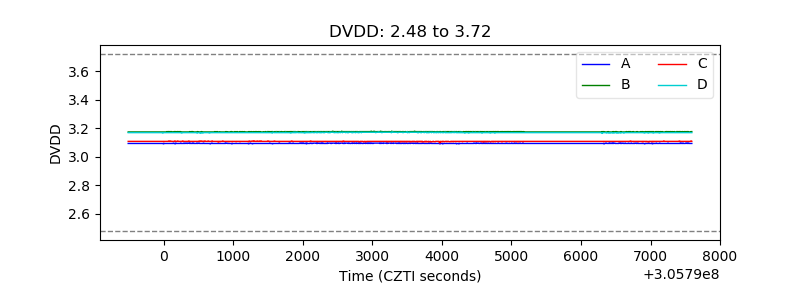 |
| Temperature 1 | 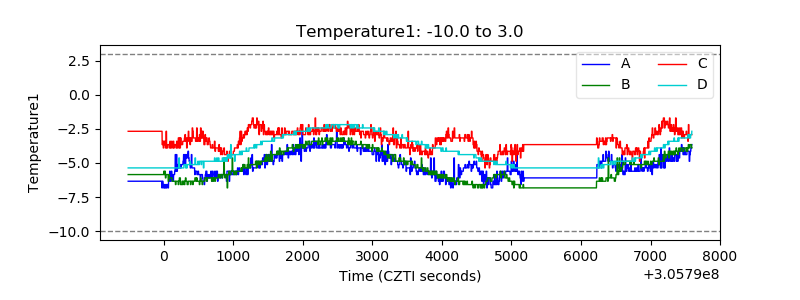 |
| Veto HV Monitor |  |
| Veto LLD | 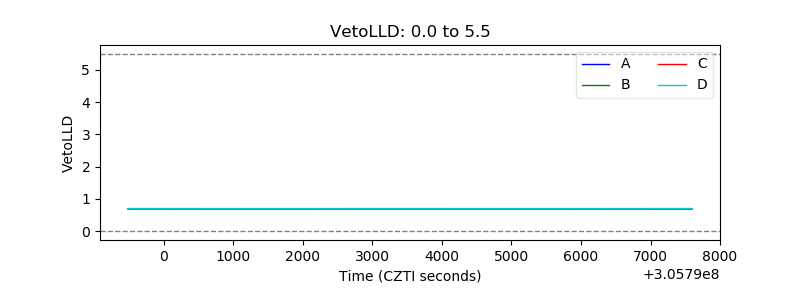 |
| Alpha Counter |  |
| _CPM_Rate | 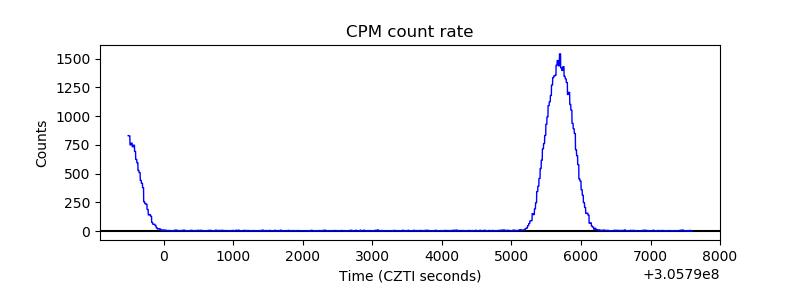 |
| CZT Counter |  |
| +2.5 Volts monitor |  |
| +5 Volts monitor |  |
| _ROLL_ROT | 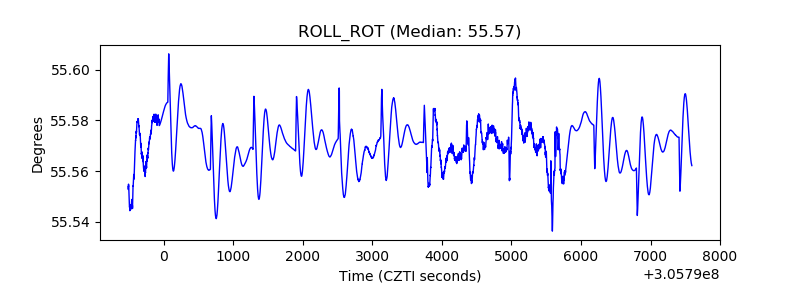 |
| _Roll_DEC | 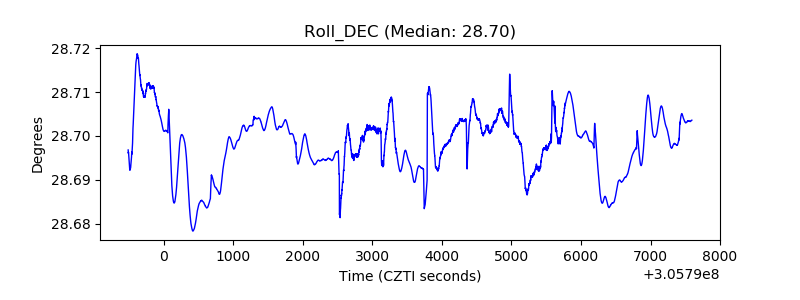 |
| _Roll_RA |  |
| Veto Counter | 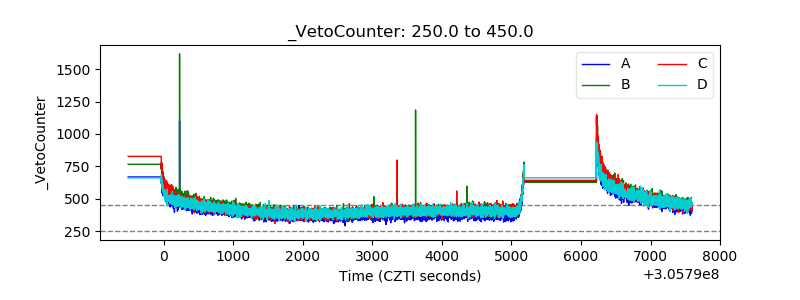 |