| Param | Original file | Final file |
|---|---|---|
| Filename | modeM0/AS1A05_041T01_9000003150_21362cztM0_level2.evt | modeM0/AS1A05_041T01_9000003150_21362cztM0_level2_quad_clean.evt |
| Size (bytes) | 516,136,320 | 71,498,880 |
| Size | 492.2 MB | 68.2 MB |
| Events in quadrant A | 3,423,468 | 437,856 |
| Events in quadrant B | 3,542,468 | 443,340 |
| Events in quadrant C | 4,282,153 | 419,805 |
| Events in quadrant D | 3,942,513 | 410,647 |
| Mode SS | |||
|---|---|---|---|
| Quadrant | BADHDUFLAG | Total packets | Discarded packets |
| A | 0 | 130 | 0 |
| B | 0 | 130 | 0 |
| C | 0 | 130 | 0 |
| D | 0 | 130 | 0 |
| Mode M0 | |||
|---|---|---|---|
| Quadrant | BADHDUFLAG | Total packets | Discarded packets |
| A | 0 | 14129 | 2 |
| B | 0 | 14443 | 4 |
| C | 0 | 16897 | 2 |
| D | 0 | 15750 | 2 |
| Mode M9 | |||
|---|---|---|---|
| Quadrant | BADHDUFLAG | Total packets | Discarded packets |
| A | 0 | 12 | 0 |
| B | 0 | 13 | 0 |
| C | 0 | 13 | 0 |
| D | 0 | 13 | 0 |
| Quadrant | Total seconds | Saturated seconds | Saturation percentage |
|---|---|---|---|
| A | 6504 | 86 | 1.322263% |
| B | 6503 | 112 | 1.722282% |
| C | 6503 | 155 | 2.383515% |
| D | 6503 | 170 | 2.614178% |
Noise dominated data is calculated using 1-second bins in cleaned event files. If a bin has >2000 counts, and if more than 50% of those come from <1% of pixels, then it is considered to be noise-dominated and hence unusable.
| Quadrant | # 1 sec bins | Bins with >0 counts | Bins with >2000 counts | High rate bins dominated by noise | Noise dominated (total time) | Noise dominated (detector-on time) | Marked lightcurve |
|---|---|---|---|---|---|---|---|
| A | 7659 | 6504 | 0 | 0 | 0.00% | 0.00% | 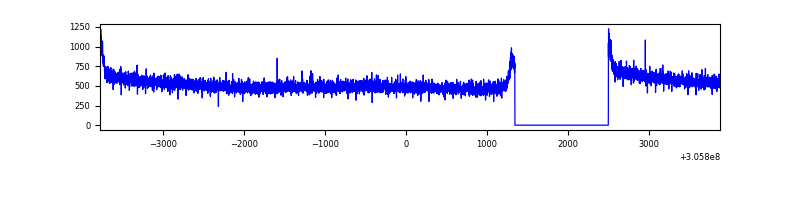 |
| B | 7658 | 6503 | 16 | 16 | 0.21% | 0.25% | 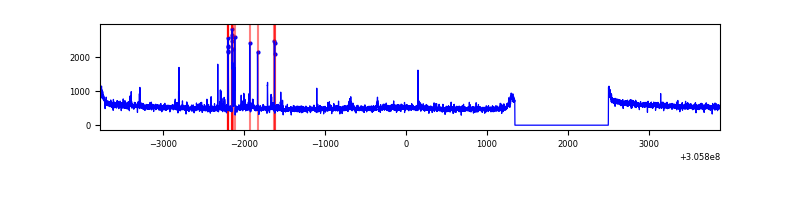 |
| C | 7658 | 6503 | 11 | 11 | 0.14% | 0.17% | 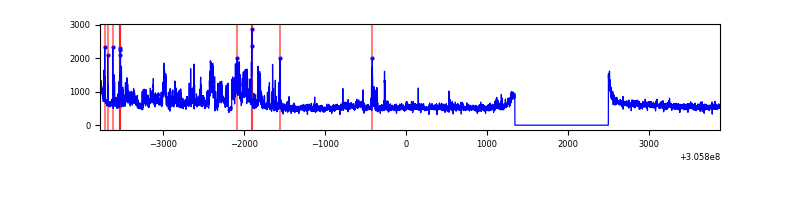 |
| D | 7658 | 6503 | 111 | 111 | 1.45% | 1.71% | 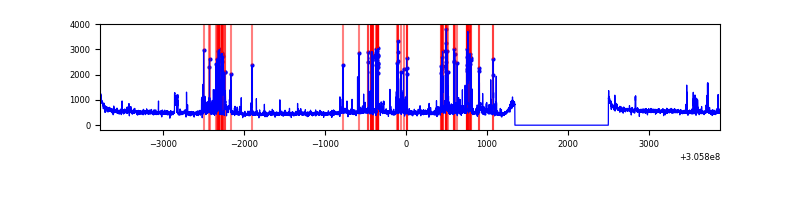 |
Top three noisy pixels from each quadrant. If the there are fewer than three noisy pixels in the level2.evt file, extra rows are filled as -1
| Pixel properties | Quadrant properties | ||||||
|---|---|---|---|---|---|---|---|
| Quadrant | DetID | PixID | Counts | Sigma | Mean | Median | Sigma |
| A | 5 | 168 | 33730 | 186.95 | 880 | 864 | 175.8 |
| A | 13 | 254 | 9350 | 48.27 | 880 | 864 | 175.8 |
| A | 0 | 226 | 7499 | 37.74 | 880 | 864 | 175.8 |
| B | 3 | 64 | 79755 | 485.17 | 864 | 845 | 162.6 |
| B | 0 | 197 | 46363 | 279.86 | 864 | 845 | 162.6 |
| B | 0 | 230 | 41426 | 249.51 | 864 | 845 | 162.6 |
| C | 3 | 233 | 933961 | 4877.39 | 825 | 834 | 191.3 |
| C | 14 | 238 | 130148 | 675.92 | 825 | 834 | 191.3 |
| C | 13 | 61 | 5773 | 25.82 | 825 | 834 | 191.3 |
| D | 12 | 235 | 668408 | 3288.87 | 843 | 819 | 203.0 |
| D | 13 | 172 | 30559 | 146.51 | 843 | 819 | 203.0 |
| D | 2 | 234 | 24034 | 114.37 | 843 | 819 | 203.0 |
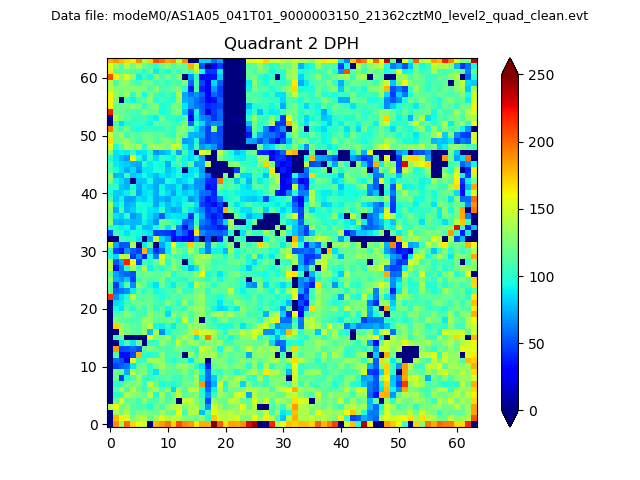
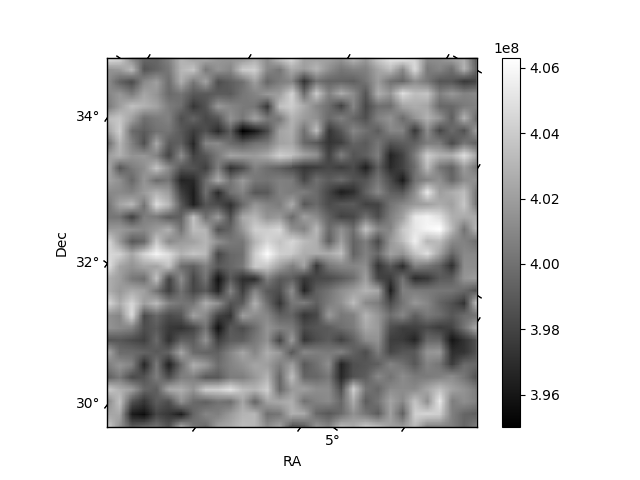
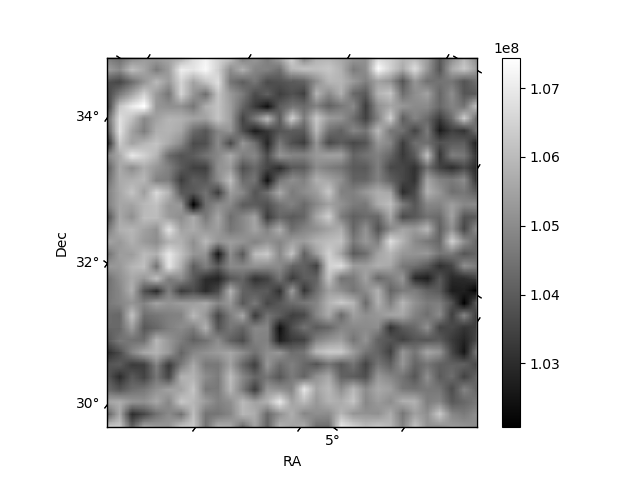
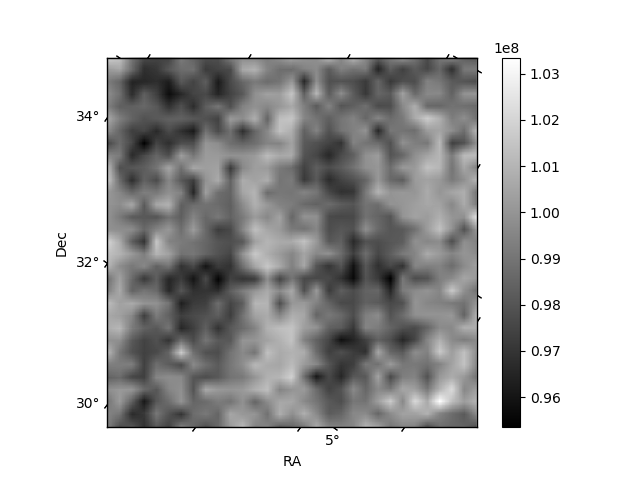
Histogram calculated using DETX and DETY for each event in the final _common_clean file
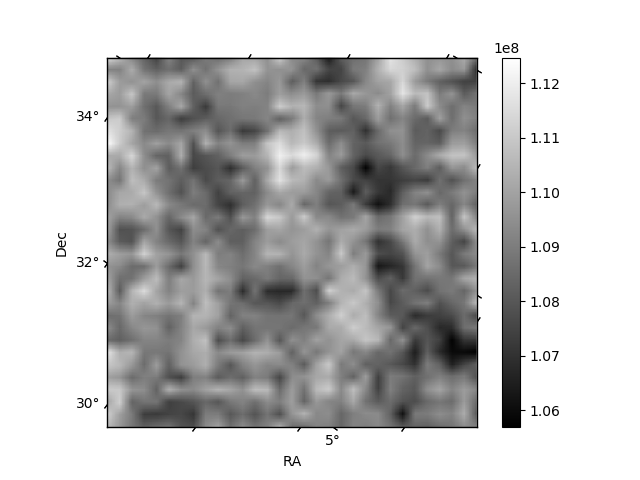
| Quadrant A |  |
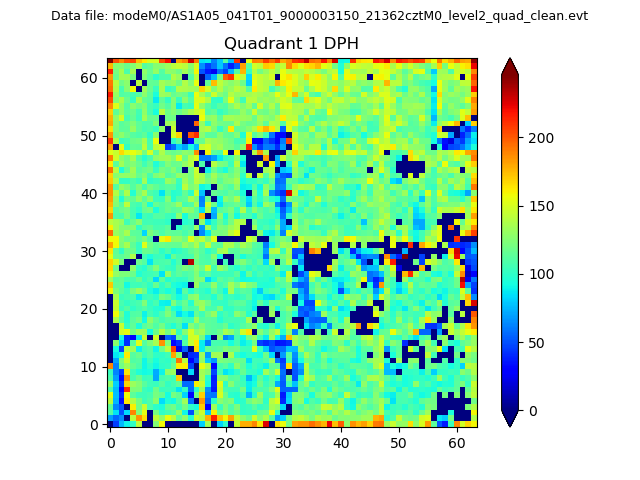 |
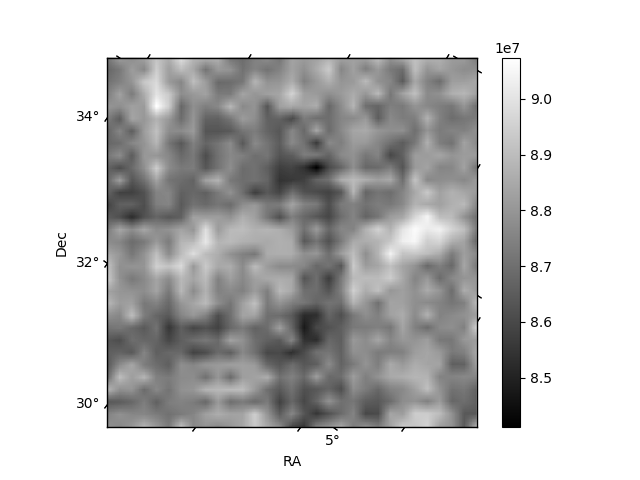
Quadrant B |
|---|---|---|---|
| Quadrant D | 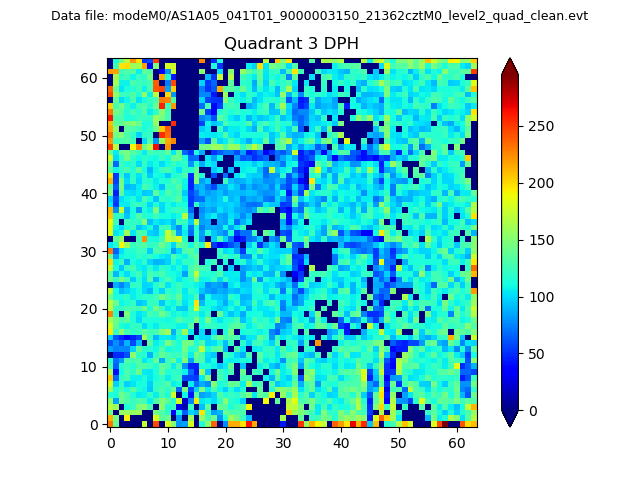 |
 |
Quadrant C |
| Plot type | Count rate plots | Images |
|---|---|---|
| Comparison with Poisson distribution Blue bars denote a histogram of data divided into 1 sec bins. Red curve is a Poisson curve with rate = median count rate of data. |
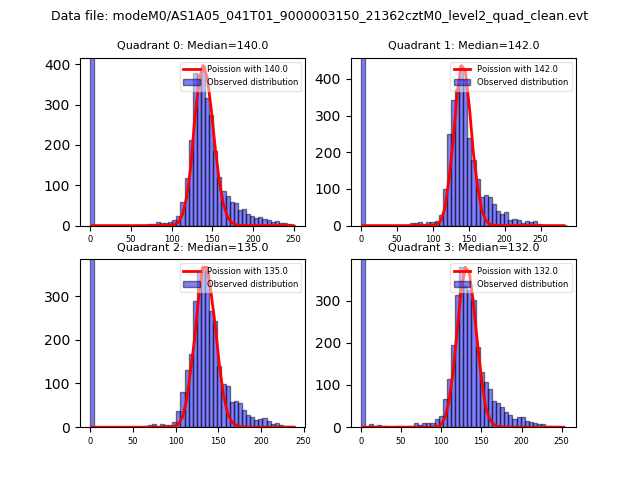 |
 |
| Quadrant-wise count rates Data is divided into 100 sec bins |
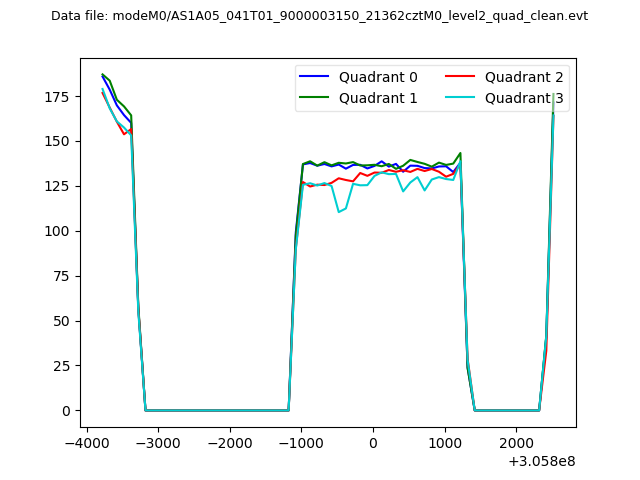 |
|
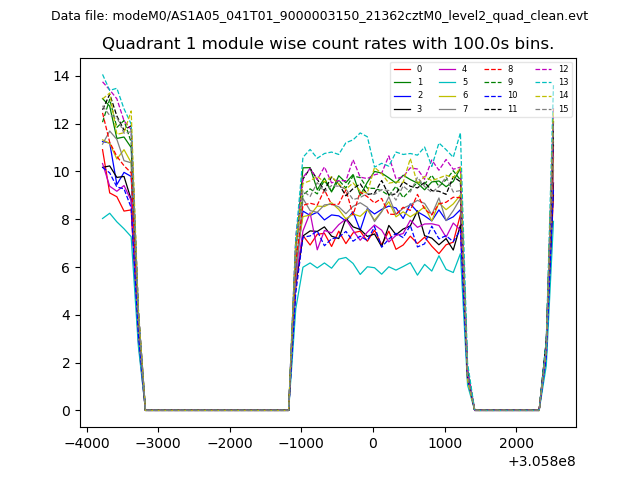
| Module-wise count rates for Quadrant A Data is divided into 100 sec bins |
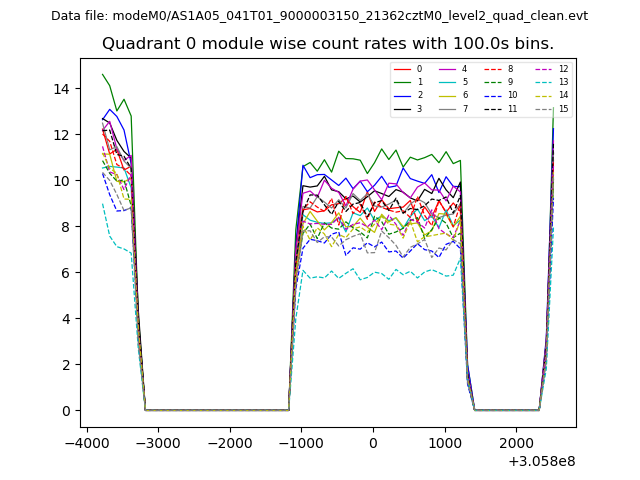 |
 |
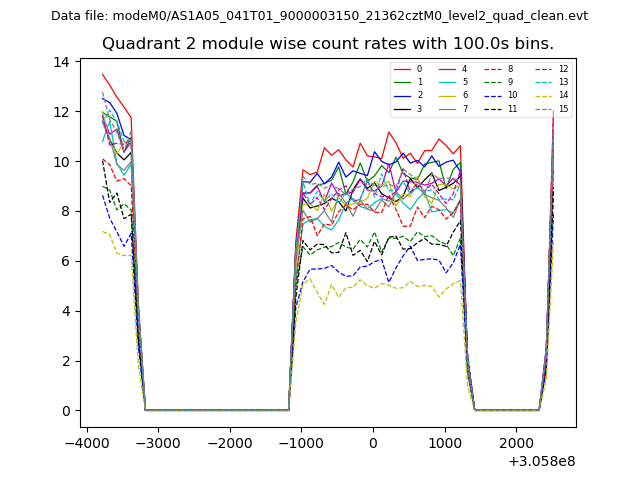
| Module-wise count rates for Quadrant B Data is divided into 100 sec bins |
 |
 |
| Module-wise count rates for Quadrant C Data is divided into 100 sec bins |
 |
 |
| Module-wise count rates for Quadrant D Data is divided into 100 sec bins |
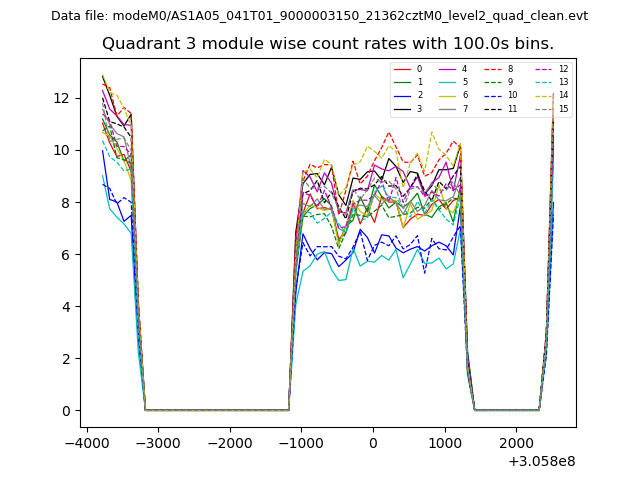 |
 |
| Parameter | Plot |
|---|---|
| CZT HV Monitor | 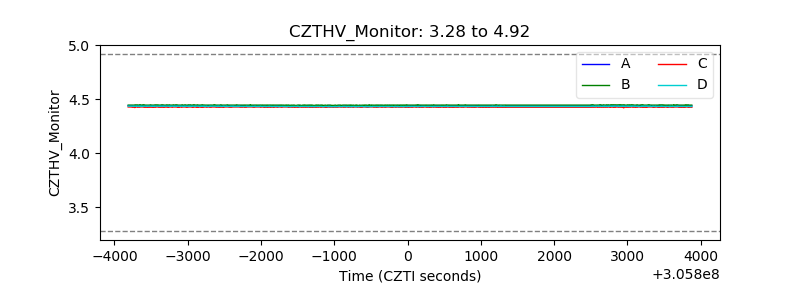 |
| D_VDD | 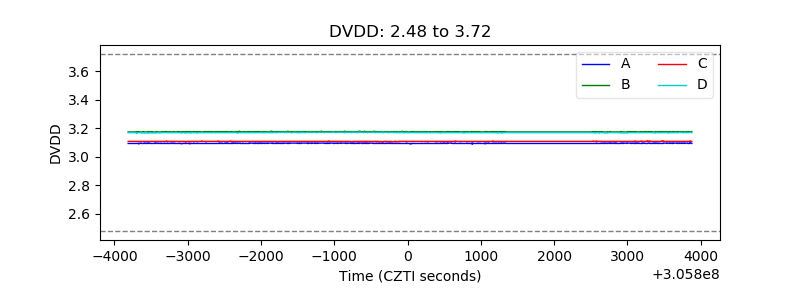 |
| Temperature 1 |  |
| Veto HV Monitor | 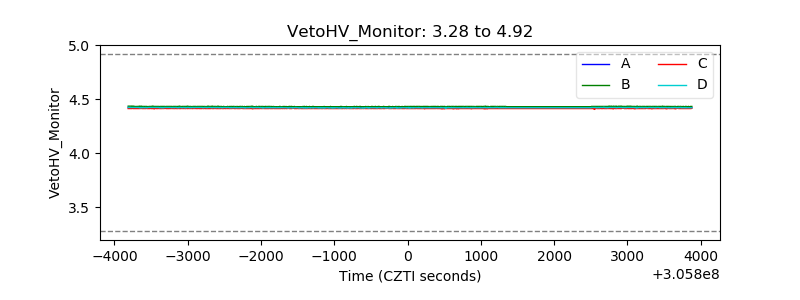 |
| Veto LLD | 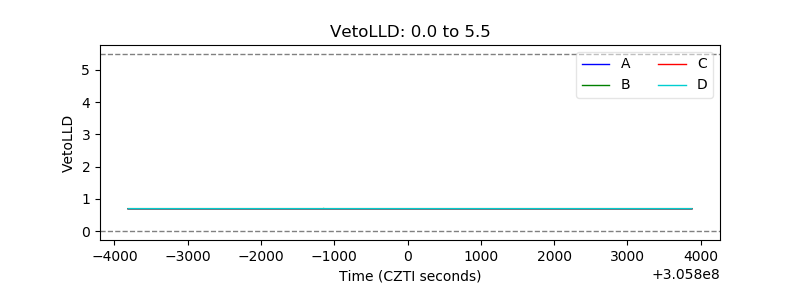 |
| Alpha Counter | 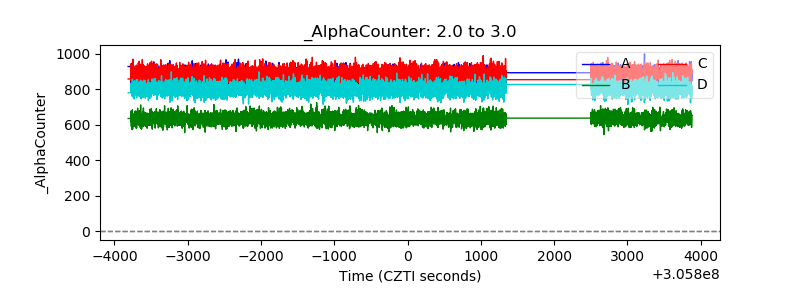 |
| _CPM_Rate | 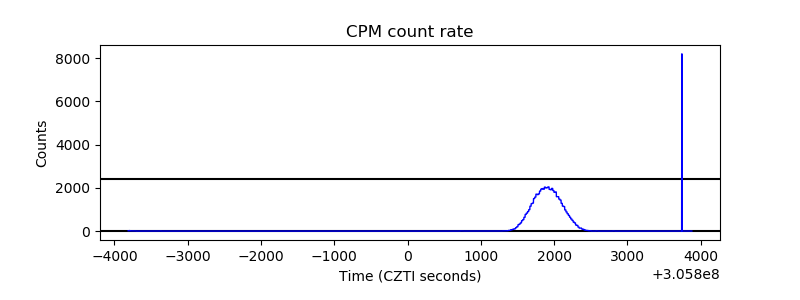 |
| CZT Counter | 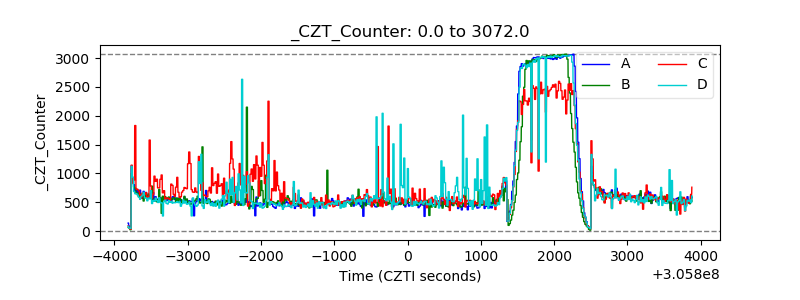 |
| +2.5 Volts monitor |  |
| +5 Volts monitor |  |
| _ROLL_ROT | 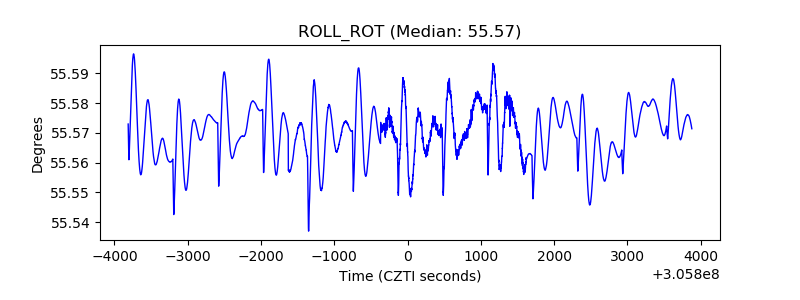 |
| _Roll_DEC | 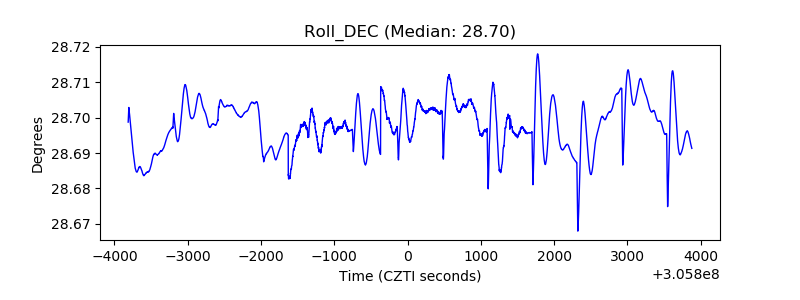 |
| _Roll_RA | 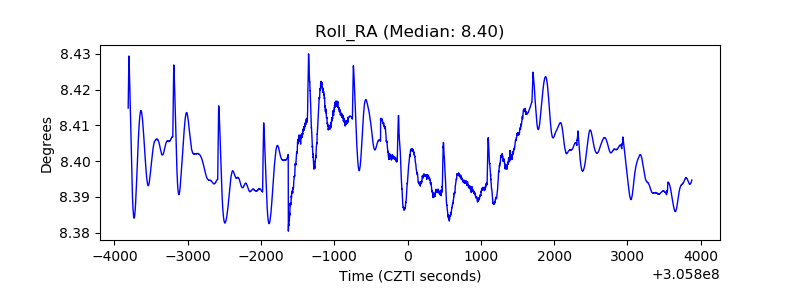 |
| Veto Counter | 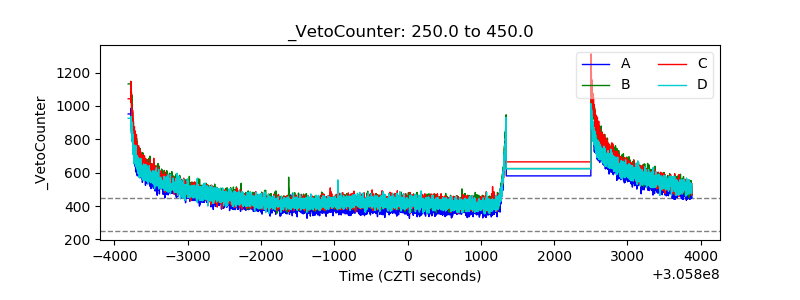 |