| Param | Original file | Final file |
|---|---|---|
| Filename | modeM0/AS1A05_041T01_9000003150_21363cztM0_level2.evt | modeM0/AS1A05_041T01_9000003150_21363cztM0_level2_quad_clean.evt |
| Size (bytes) | 521,032,320 | 67,014,720 |
| Size | 496.9 MB | 63.9 MB |
| Events in quadrant A | 3,550,714 | 405,933 |
| Events in quadrant B | 3,588,227 | 409,148 |
| Events in quadrant C | 4,551,127 | 384,130 |
| Events in quadrant D | 3,657,240 | 384,964 |
| Mode SS | |||
|---|---|---|---|
| Quadrant | BADHDUFLAG | Total packets | Discarded packets |
| A | 0 | 130 | 0 |
| B | 0 | 130 | 0 |
| C | 0 | 130 | 0 |
| D | 0 | 130 | 0 |
| Mode M0 | |||
|---|---|---|---|
| Quadrant | BADHDUFLAG | Total packets | Discarded packets |
| A | 0 | 14575 | 2 |
| B | 0 | 14670 | 2 |
| C | 0 | 17553 | 2 |
| D | 0 | 14806 | 2 |
| Mode M9 | |||
|---|---|---|---|
| Quadrant | BADHDUFLAG | Total packets | Discarded packets |
| A | 0 | 21 | 0 |
| B | 0 | 22 | 0 |
| C | 0 | 22 | 0 |
| D | 0 | 22 | 0 |
| Quadrant | Total seconds | Saturated seconds | Saturation percentage |
|---|---|---|---|
| A | 6372 | 85 | 1.333961% |
| B | 6372 | 119 | 1.867546% |
| C | 6372 | 308 | 4.833647% |
| D | 6372 | 55 | 0.863151% |
Noise dominated data is calculated using 1-second bins in cleaned event files. If a bin has >2000 counts, and if more than 50% of those come from <1% of pixels, then it is considered to be noise-dominated and hence unusable.
| Quadrant | # 1 sec bins | Bins with >0 counts | Bins with >2000 counts | High rate bins dominated by noise | Noise dominated (total time) | Noise dominated (detector-on time) | Marked lightcurve |
|---|---|---|---|---|---|---|---|
| A | 7622 | 6372 | 0 | 0 | 0.00% | 0.00% | 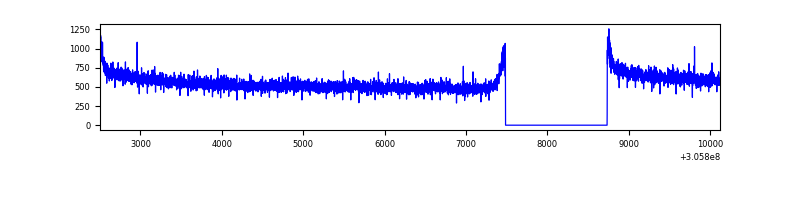 |
| B | 7622 | 6372 | 18 | 18 | 0.24% | 0.28% | 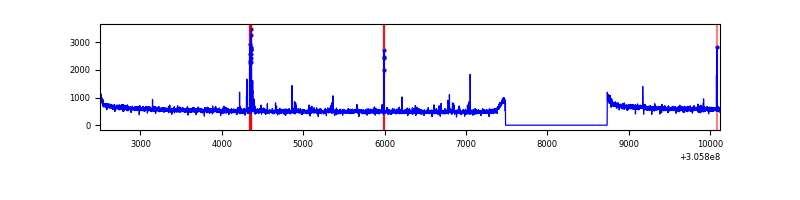 |
| C | 7622 | 6372 | 83 | 83 | 1.09% | 1.30% | 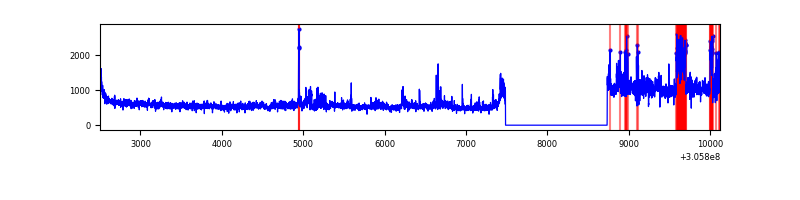 |
| D | 7622 | 6372 | 5 | 5 | 0.07% | 0.08% | 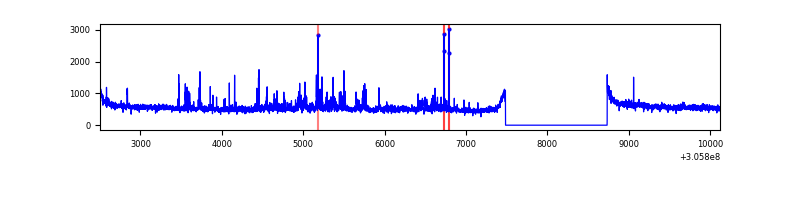 |
Top three noisy pixels from each quadrant. If the there are fewer than three noisy pixels in the level2.evt file, extra rows are filled as -1
| Pixel properties | Quadrant properties | ||||||
|---|---|---|---|---|---|---|---|
| Quadrant | DetID | PixID | Counts | Sigma | Mean | Median | Sigma |
| A | 5 | 168 | 59599 | 326.54 | 905 | 893 | 179.8 |
| A | 13 | 254 | 9147 | 45.91 | 905 | 893 | 179.8 |
| A | 0 | 226 | 7826 | 38.56 | 905 | 893 | 179.8 |
| B | 3 | 64 | 80369 | 479.72 | 887 | 870 | 165.7 |
| B | 0 | 230 | 31801 | 186.65 | 887 | 870 | 165.7 |
| B | 12 | 111 | 19551 | 112.73 | 887 | 870 | 165.7 |
| C | 3 | 233 | 1129071 | 5818.59 | 843 | 851 | 193.9 |
| C | 14 | 238 | 135983 | 696.92 | 843 | 851 | 193.9 |
| C | 13 | 61 | 5845 | 25.76 | 843 | 851 | 193.9 |
| D | 12 | 235 | 306178 | 1459.46 | 874 | 852 | 209.2 |
| D | 2 | 234 | 23176 | 106.71 | 874 | 852 | 209.2 |
| D | 13 | 153 | 23115 | 106.42 | 874 | 852 | 209.2 |
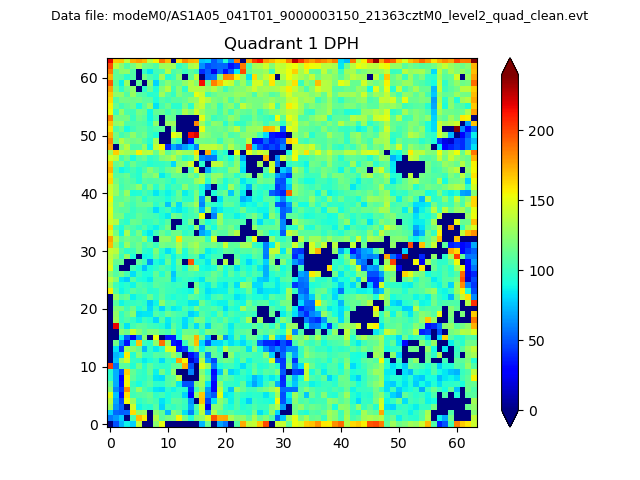
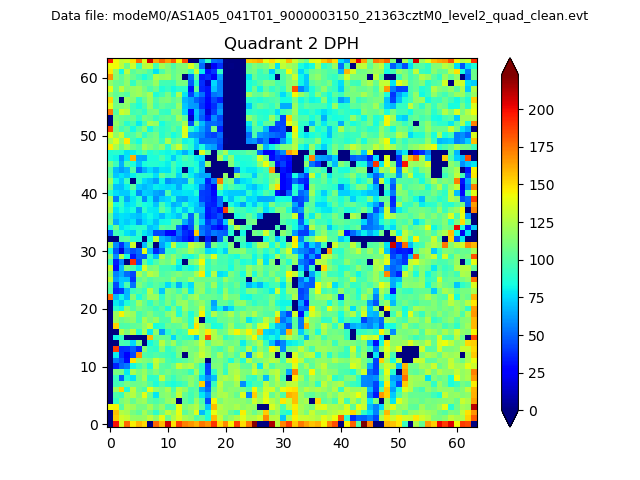
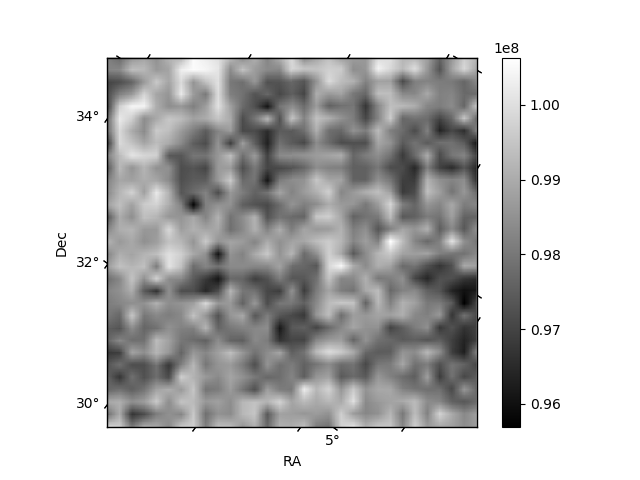
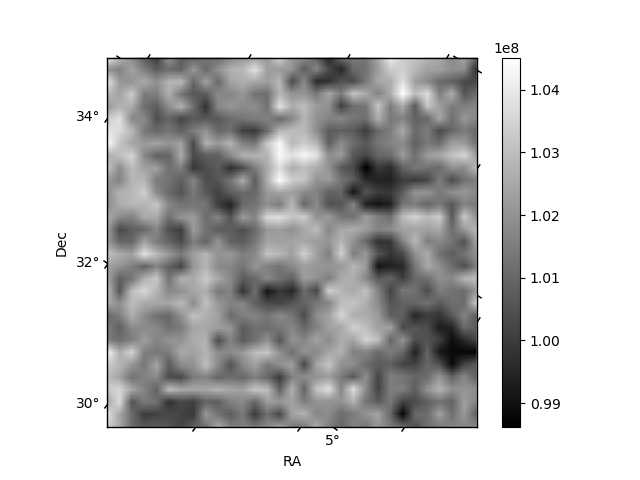
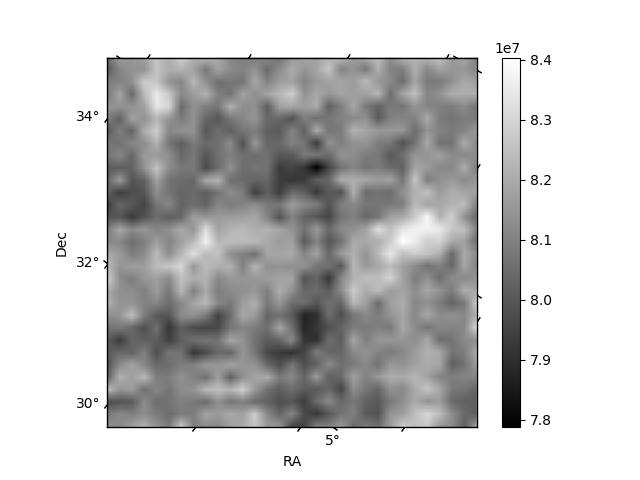
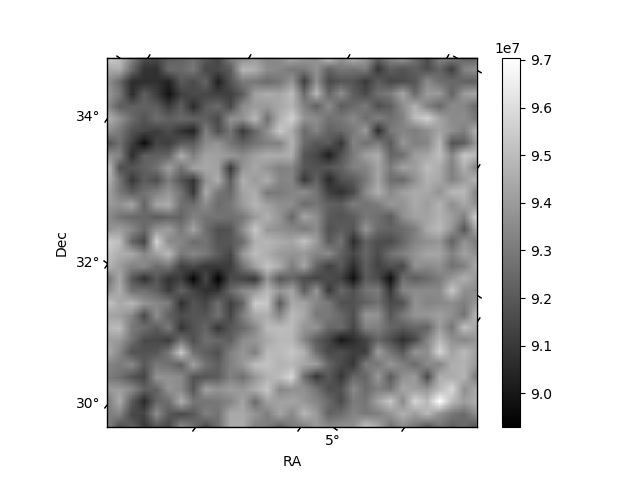
Histogram calculated using DETX and DETY for each event in the final _common_clean file
| Quadrant A |  |
 |
Quadrant B |
|---|---|---|---|
| Quadrant D | 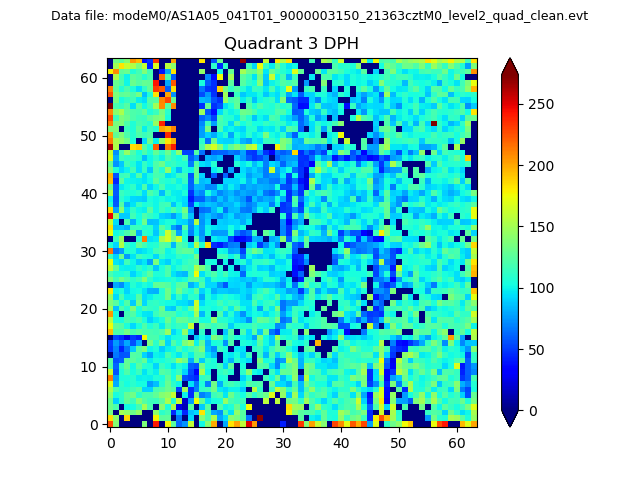 |
 |
Quadrant C |
| Plot type | Count rate plots | Images |
|---|---|---|
| Comparison with Poisson distribution Blue bars denote a histogram of data divided into 1 sec bins. Red curve is a Poisson curve with rate = median count rate of data. |
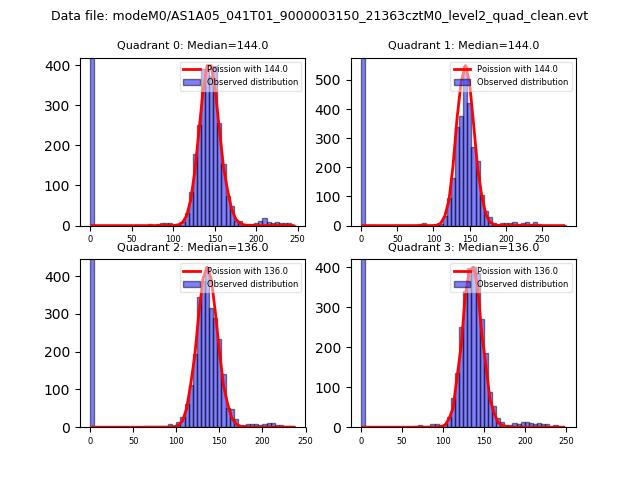 |
 |
| Quadrant-wise count rates Data is divided into 100 sec bins |
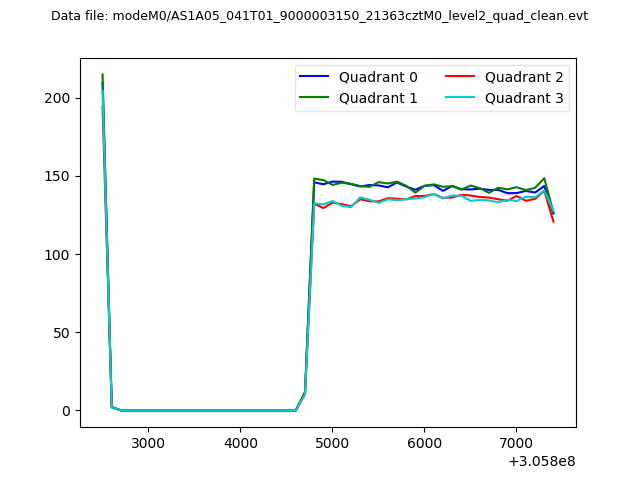 |
|
| Module-wise count rates for Quadrant A Data is divided into 100 sec bins |
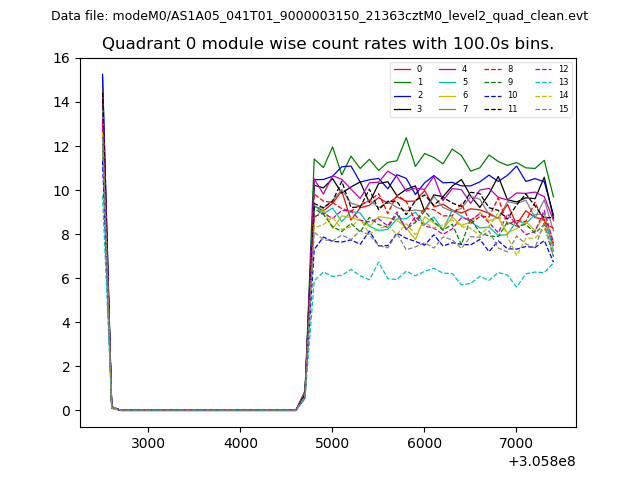 |
 |
| Module-wise count rates for Quadrant B Data is divided into 100 sec bins |
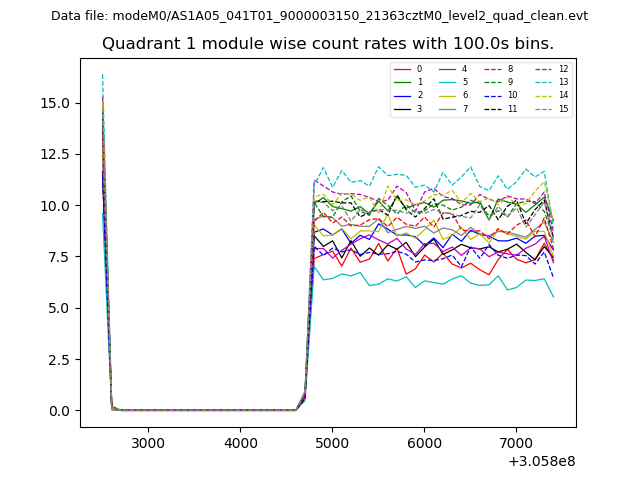 |
 |
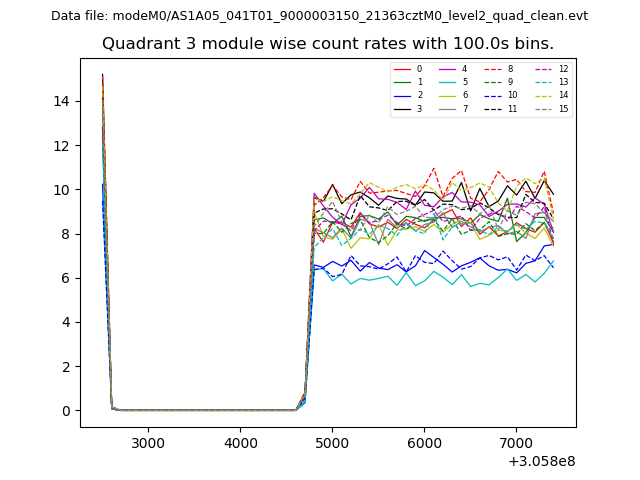
| Module-wise count rates for Quadrant C Data is divided into 100 sec bins |
 |
 |
| Module-wise count rates for Quadrant D Data is divided into 100 sec bins |
 |
 |
| Parameter | Plot |
|---|---|
| CZT HV Monitor | 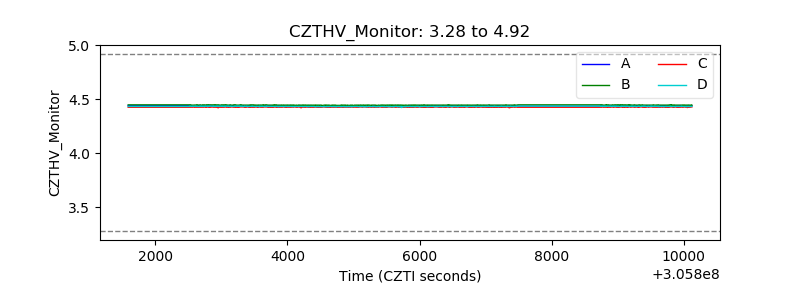 |
| D_VDD | 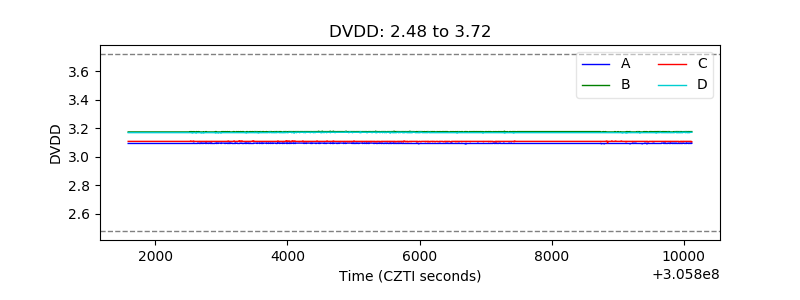 |
| Temperature 1 | 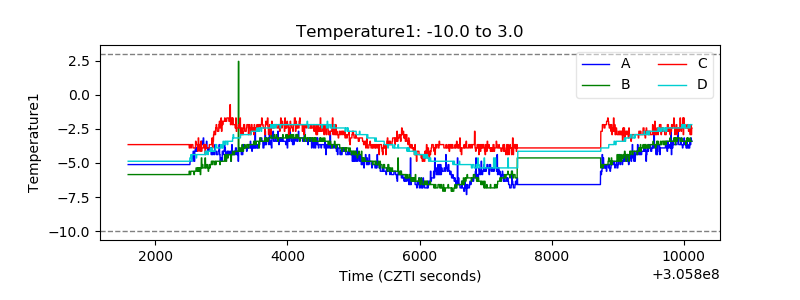 |
| Veto HV Monitor |  |
| Veto LLD | 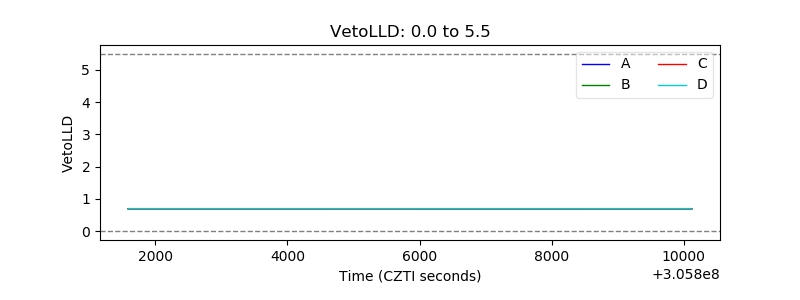 |
| Alpha Counter | 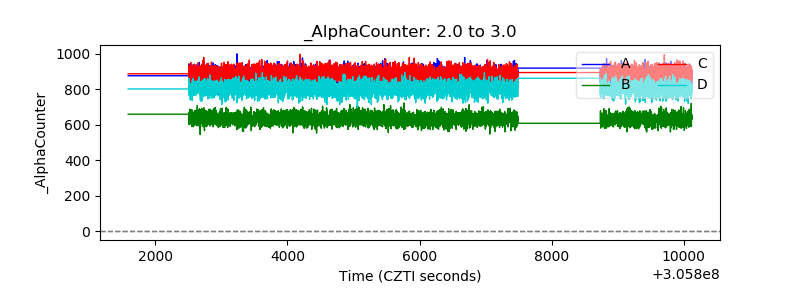 |
| _CPM_Rate | 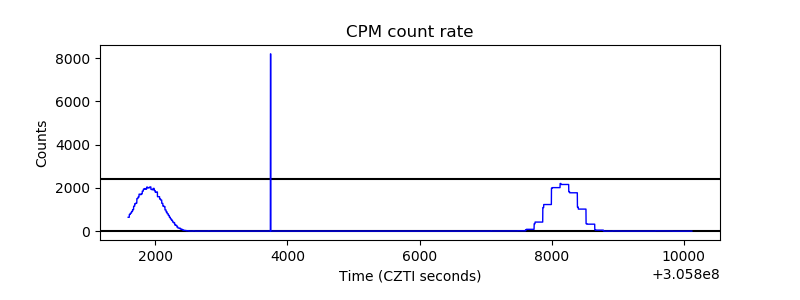 |
| CZT Counter | 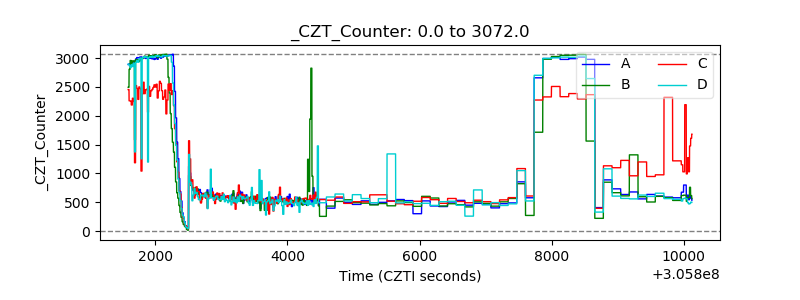 |
| +2.5 Volts monitor | 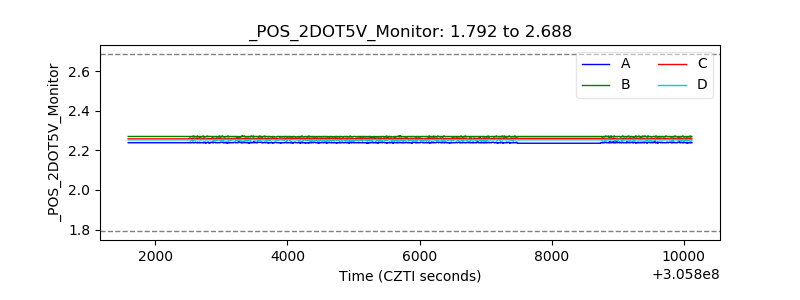 |
| +5 Volts monitor |  |
| _ROLL_ROT | 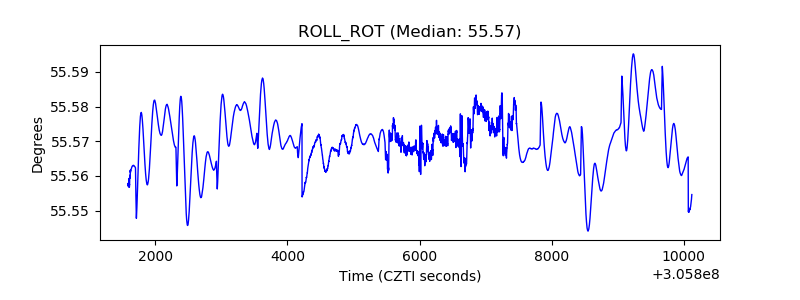 |
| _Roll_DEC | 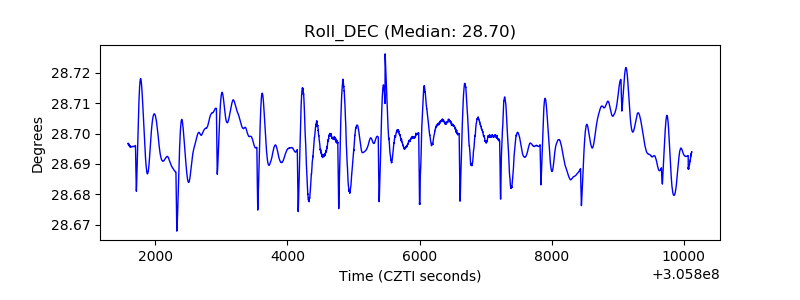 |
| _Roll_RA |  |
| Veto Counter | 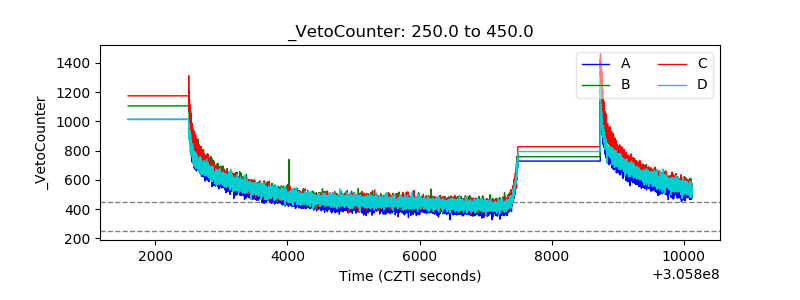 |