| Param | Original file | Final file |
|---|---|---|
| Filename | modeM0/AS1A05_041T01_9000003150_21364cztM0_level2.evt | modeM0/AS1A05_041T01_9000003150_21364cztM0_level2_quad_clean.evt |
| Size (bytes) | 331,738,560 | 44,375,040 |
| Size | 316.4 MB | 42.3 MB |
| Events in quadrant A | 2,103,383 | 277,294 |
| Events in quadrant B | 2,170,408 | 277,473 |
| Events in quadrant C | 3,320,573 | 262,051 |
| Events in quadrant D | 2,196,000 | 260,374 |
| Mode SS | |||
|---|---|---|---|
| Quadrant | BADHDUFLAG | Total packets | Discarded packets |
| A | 0 | 76 | 0 |
| B | 0 | 76 | 0 |
| C | 0 | 76 | 0 |
| D | 0 | 76 | 0 |
| Mode M0 | |||
|---|---|---|---|
| Quadrant | BADHDUFLAG | Total packets | Discarded packets |
| A | 0 | 8636 | 1 |
| B | 0 | 8874 | 1 |
| C | 0 | 12331 | 1 |
| D | 0 | 8832 | 1 |
| Mode M9 | |||
|---|---|---|---|
| Quadrant | BADHDUFLAG | Total packets | Discarded packets |
| A | 0 | 3 | 0 |
| B | 0 | 4 | 0 |
| C | 0 | 4 | 0 |
| D | 0 | 4 | 0 |
| Quadrant | Total seconds | Saturated seconds | Saturation percentage |
|---|---|---|---|
| A | 3761 | 37 | 0.983781% |
| B | 3761 | 56 | 1.488966% |
| C | 3761 | 292 | 7.763893% |
| D | 3761 | 28 | 0.744483% |
Noise dominated data is calculated using 1-second bins in cleaned event files. If a bin has >2000 counts, and if more than 50% of those come from <1% of pixels, then it is considered to be noise-dominated and hence unusable.
| Quadrant | # 1 sec bins | Bins with >0 counts | Bins with >2000 counts | High rate bins dominated by noise | Noise dominated (total time) | Noise dominated (detector-on time) | Marked lightcurve |
|---|---|---|---|---|---|---|---|
| A | 3761 | 3761 | 0 | 0 | 0.00% | 0.00% | 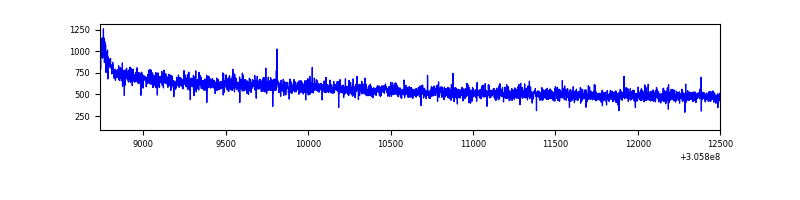 |
| B | 3761 | 3761 | 7 | 7 | 0.19% | 0.19% | 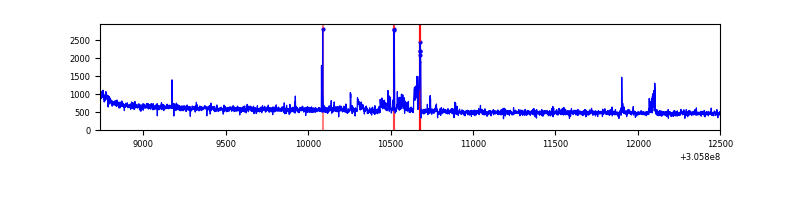 |
| C | 3761 | 3761 | 91 | 91 | 2.42% | 2.42% | 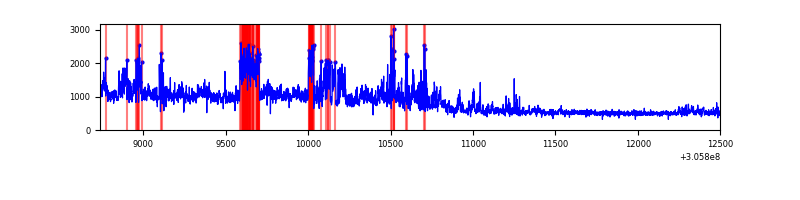 |
| D | 3761 | 3761 | 3 | 3 | 0.08% | 0.08% | 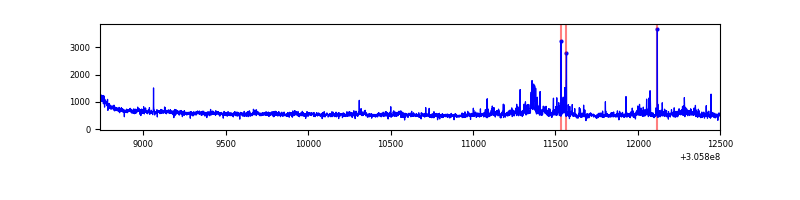 |
Top three noisy pixels from each quadrant. If the there are fewer than three noisy pixels in the level2.evt file, extra rows are filled as -1
| Pixel properties | Quadrant properties | ||||||
|---|---|---|---|---|---|---|---|
| Quadrant | DetID | PixID | Counts | Sigma | Mean | Median | Sigma |
| A | 5 | 168 | 43470 | 401.66 | 533 | 526 | 106.9 |
| A | 13 | 254 | 5614 | 47.59 | 533 | 526 | 106.9 |
| A | 0 | 226 | 4533 | 37.48 | 533 | 526 | 106.9 |
| B | 0 | 197 | 91205 | 924.61 | 523 | 513 | 98.1 |
| B | 0 | 230 | 26035 | 260.2 | 523 | 513 | 98.1 |
| B | 3 | 64 | 12475 | 121.95 | 523 | 513 | 98.1 |
| C | 3 | 233 | 1298921 | 11356.32 | 498 | 504 | 114.3 |
| C | 14 | 238 | 79969 | 695.02 | 498 | 504 | 114.3 |
| C | 13 | 61 | 3362 | 25.0 | 498 | 504 | 114.3 |
| D | 12 | 235 | 223636 | 1790.25 | 517 | 503 | 124.6 |
| D | 2 | 234 | 14425 | 111.7 | 517 | 503 | 124.6 |
| D | 1 | 52 | 8411 | 63.45 | 517 | 503 | 124.6 |
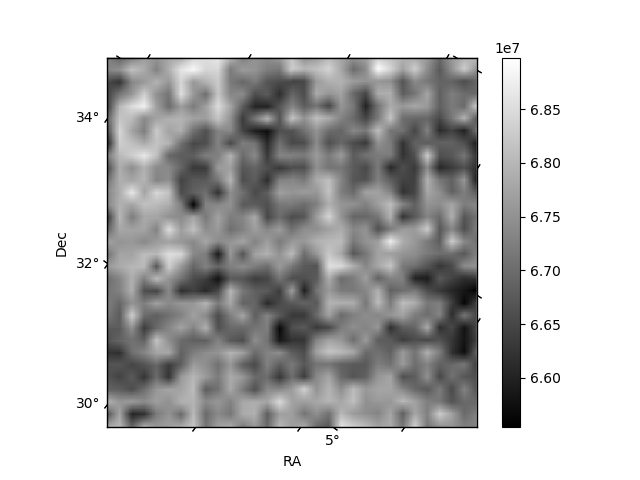
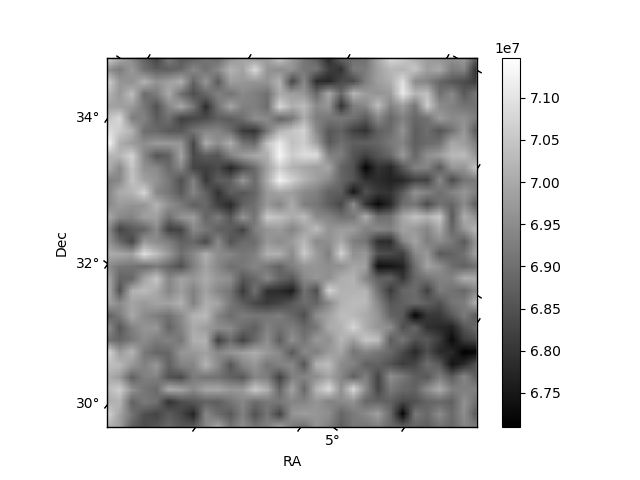
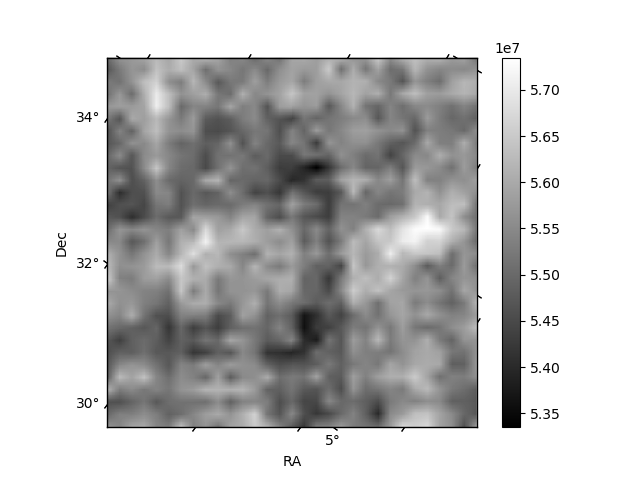
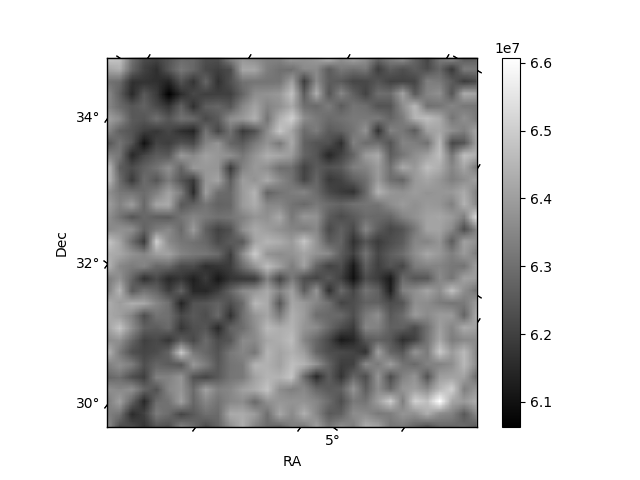
Histogram calculated using DETX and DETY for each event in the final _common_clean file
| Quadrant A |  |
 |
Quadrant B |
|---|---|---|---|
| Quadrant D |  |
 |
Quadrant C |
| Plot type | Count rate plots | Images |
|---|---|---|
| Comparison with Poisson distribution Blue bars denote a histogram of data divided into 1 sec bins. Red curve is a Poisson curve with rate = median count rate of data. |
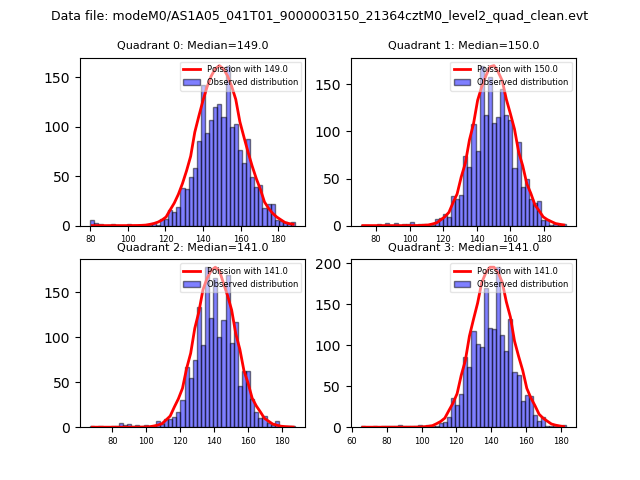 |
 |
| Quadrant-wise count rates Data is divided into 100 sec bins |
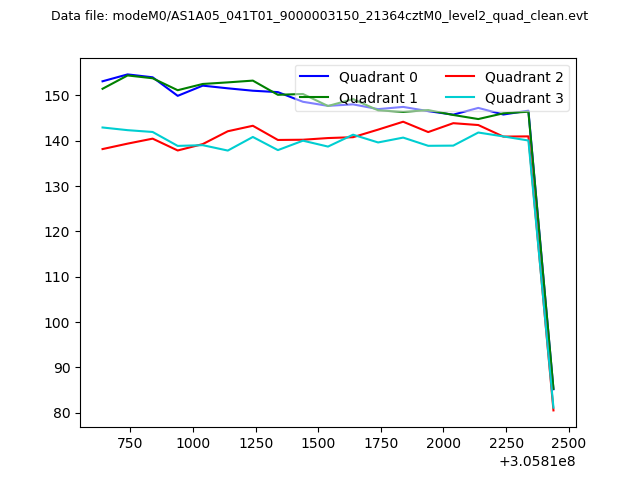 |
|
| Module-wise count rates for Quadrant A Data is divided into 100 sec bins |
 |
 |
| Module-wise count rates for Quadrant B Data is divided into 100 sec bins |
 |
 |
| Module-wise count rates for Quadrant C Data is divided into 100 sec bins |
 |
 |
| Module-wise count rates for Quadrant D Data is divided into 100 sec bins |
 |
 |
| Parameter | Plot |
|---|---|
| CZT HV Monitor |  |
| D_VDD | 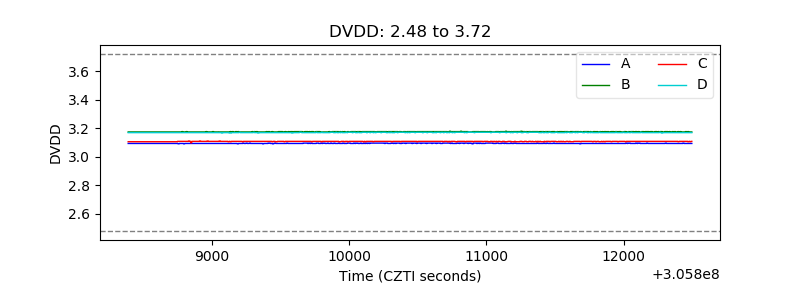 |
| Temperature 1 | 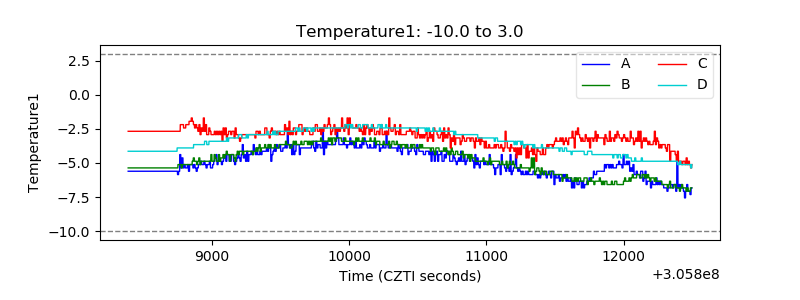 |
| Veto HV Monitor |  |
| Veto LLD |  |
| Alpha Counter |  |
| _CPM_Rate | 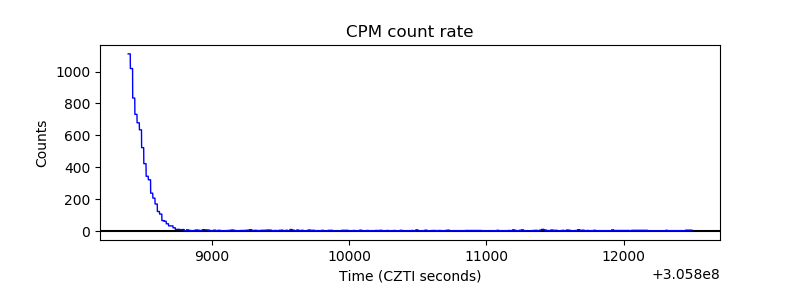 |
| CZT Counter |  |
| +2.5 Volts monitor |  |
| +5 Volts monitor |  |
| _ROLL_ROT |  |
| _Roll_DEC |  |
| _Roll_RA |  |
| Veto Counter |  |