| Param | Original file | Final file |
|---|---|---|
| Filename | modeM0/AS1A05_226T05_9000003148cztM0_level2.fits | modeM0/AS1A05_226T05_9000003148cztM0_level2_quad_clean.evt |
| Size (bytes) | 231,140,160 | 262,414,080 |
| Size | 220.4 MB | 250.3 MB |
| Events in quadrant A | 1,435,612 | 1,660,953 |
| Events in quadrant B | 1,364,004 | 1,648,631 |
| Events in quadrant C | 1,384,954 | 1,561,624 |
| Events in quadrant D | 1,170,006 | 1,430,752 |
| Mode M9 | |||
|---|---|---|---|
| Quadrant | BADHDUFLAG | Total packets | Discarded packets |
| A | 0 | 42 | 0 |
| B | 0 | 42 | 0 |
| C | 0 | 42 | 0 |
| D | 0 | 42 | 0 |
| Mode M0 | |||
|---|---|---|---|
| Quadrant | BADHDUFLAG | Total packets | Discarded packets |
| A | 0 | 49836 | 0 |
| B | 0 | 52267 | 0 |
| C | 0 | 48756 | 0 |
| D | 0 | 65543 | 0 |
| Mode SS | |||
|---|---|---|---|
| Quadrant | BADHDUFLAG | Total packets | Discarded packets |
| A | 0 | 486 | 0 |
| B | 0 | 486 | 0 |
| C | 0 | 486 | 0 |
| D | 0 | 486 | 0 |
| Quadrant | Total seconds | Saturated seconds | Saturation percentage |
|---|---|---|---|
| A | 23910 | 117 | 0.489335% |
| B | 23910 | 279 | 1.166876% |
| C | 23910 | 146 | 0.610623% |
| D | 23910 | 2031 | 8.494354% |
Noise dominated data is calculated using 1-second bins in cleaned event files. If a bin has >2000 counts, and if more than 50% of those come from <1% of pixels, then it is considered to be noise-dominated and hence unusable.
| Quadrant | # 1 sec bins | Bins with >0 counts | Bins with >2000 counts | High rate bins dominated by noise | Noise dominated (total time) | Noise dominated (detector-on time) | Marked lightcurve |
|---|---|---|---|---|---|---|---|
| A | 28125 | 23907 | 0 | 0 | 0.00% | 0.00% | 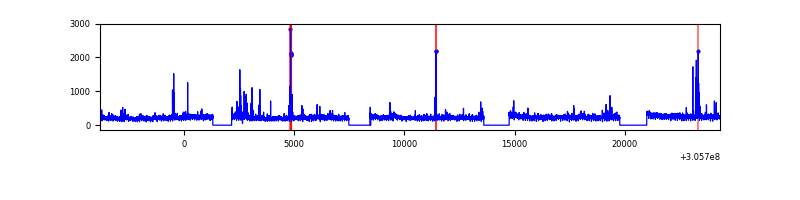 |
| B | 28125 | 23908 | 0 | 0 | 0.00% | 0.00% | 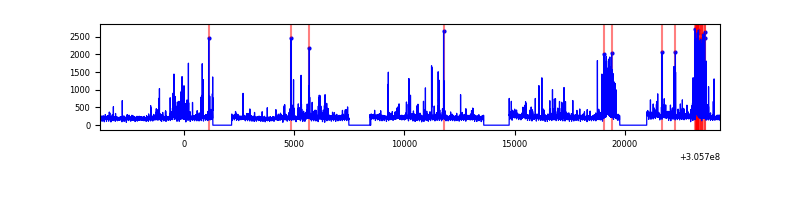 |
| C | 28125 | 23910 | 0 | 0 | 0.00% | 0.00% | 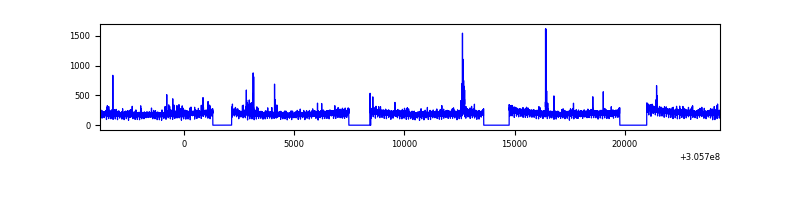 |
| D | 28125 | 23894 | 0 | 0 | 0.00% | 0.00% | 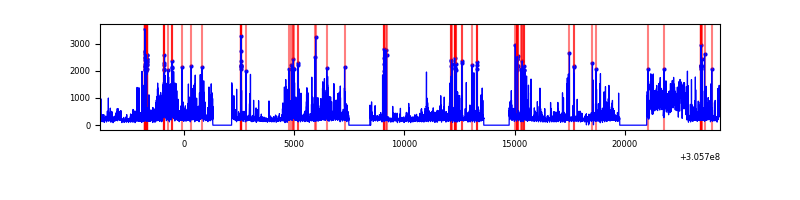 |
Top three noisy pixels from each quadrant. If the there are fewer than three noisy pixels in the level2.evt file, extra rows are filled as -1
| Pixel properties | Quadrant properties | ||||||
|---|---|---|---|---|---|---|---|
| Quadrant | DetID | PixID | Counts | Sigma | Mean | Median | Sigma |
| A | 0 | 29 | 1386 | 11.23 | 374 | 354 | 91.9 |
| A | 7 | 110 | 1246 | 9.71 | 374 | 354 | 91.9 |
| A | 9 | 19 | 1056 | 7.64 | 374 | 354 | 91.9 |
| B | 2 | 9 | 1125 | 10.64 | 361 | 345 | 73.3 |
| B | 3 | 17 | 911 | 7.72 | 361 | 345 | 73.3 |
| B | 2 | 8 | 896 | 7.52 | 361 | 345 | 73.3 |
| C | 1 | 80 | 1067 | 7.65 | 365 | 342 | 94.8 |
| C | 1 | 81 | 1047 | 7.44 | 365 | 342 | 94.8 |
| C | 3 | 126 | 998 | 6.92 | 365 | 342 | 94.8 |
| D | 6 | 231 | 855 | 6.04 | 334 | 306 | 90.9 |
| D | 10 | 189 | 849 | 5.97 | 334 | 306 | 90.9 |
| D | 6 | 67 | 827 | 5.73 | 334 | 306 | 90.9 |
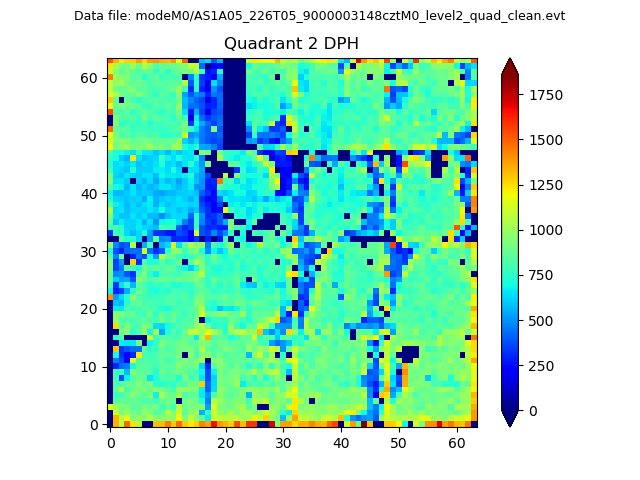
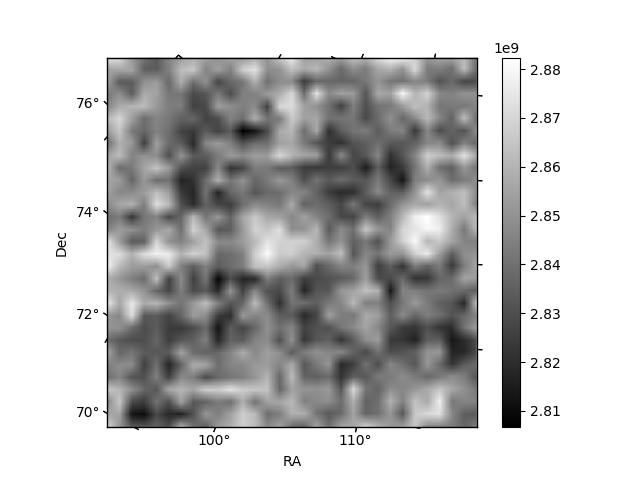
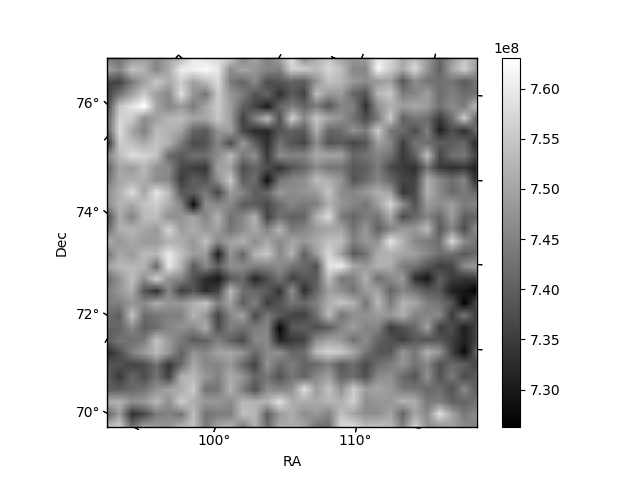
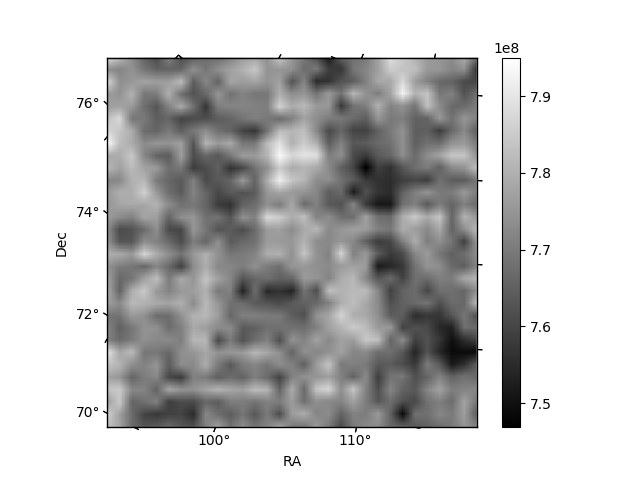
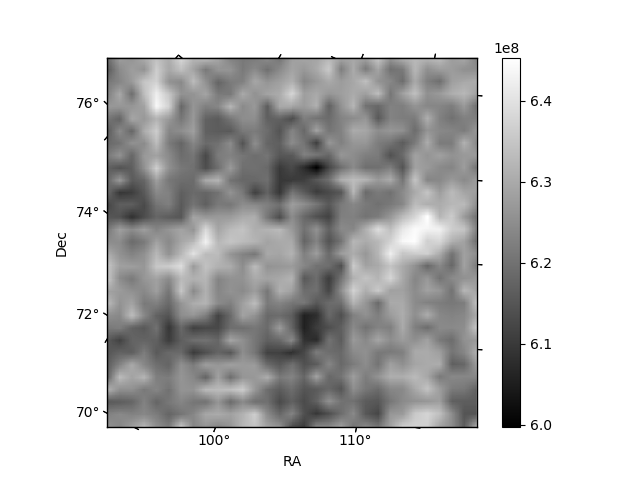
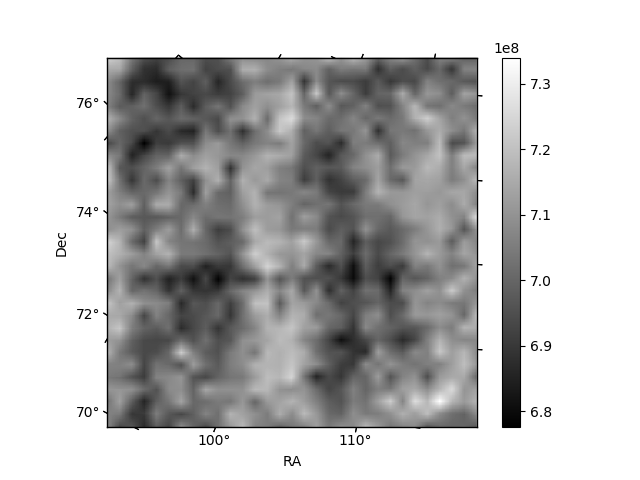
Histogram calculated using DETX and DETY for each event in the final _common_clean file
| Quadrant A | 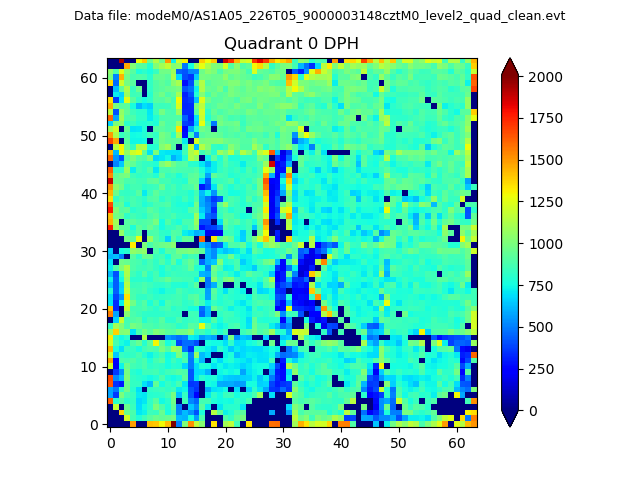 |
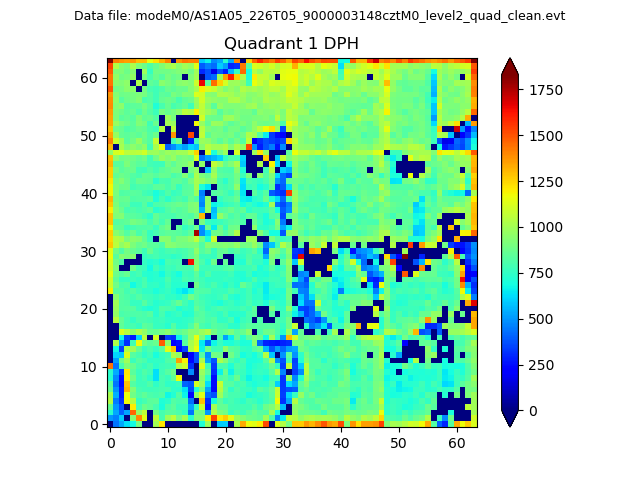 |
Quadrant B |
|---|---|---|---|
| Quadrant D | 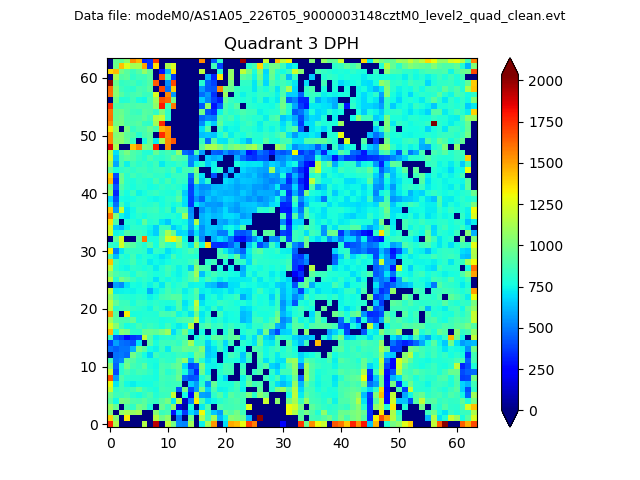 |
 |
Quadrant C |
| Plot type | Count rate plots | Images |
|---|---|---|
| Comparison with Poisson distribution Blue bars denote a histogram of data divided into 1 sec bins. Red curve is a Poisson curve with rate = median count rate of data. |
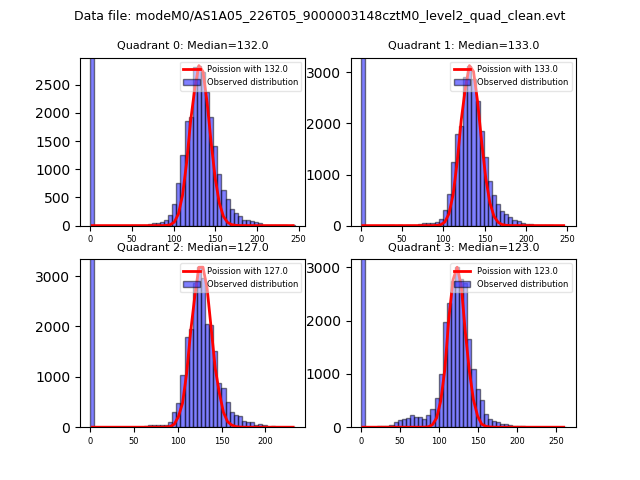 |
 |
| Quadrant-wise count rates Data is divided into 100 sec bins |
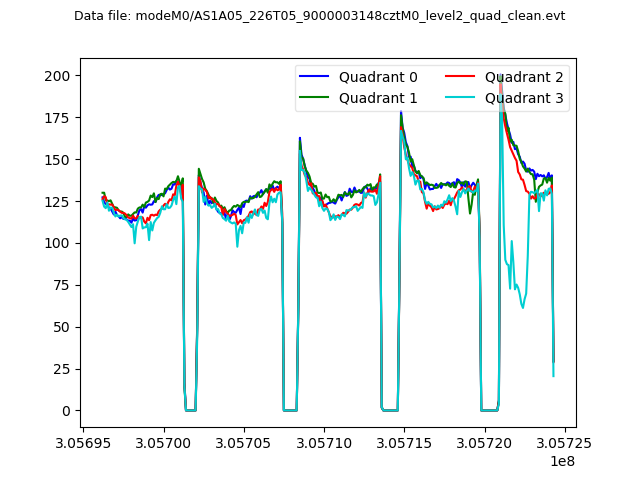 |
|
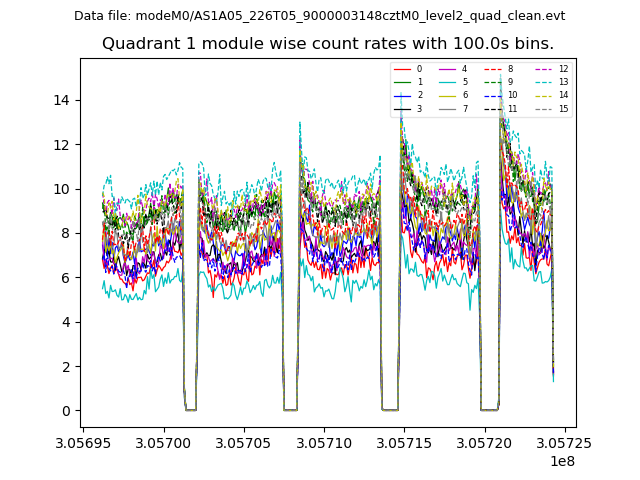
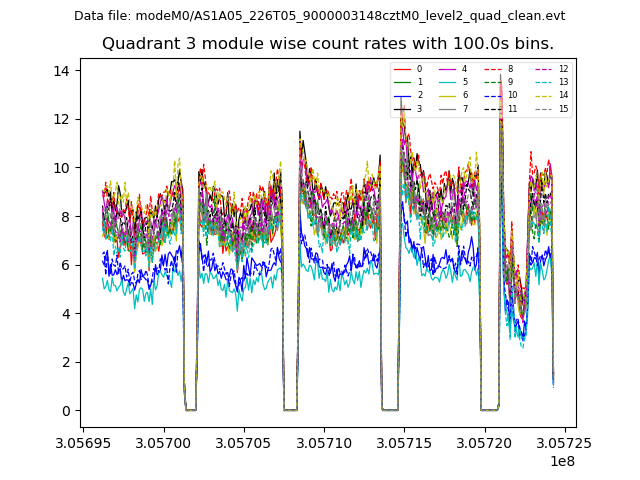
| Module-wise count rates for Quadrant A Data is divided into 100 sec bins |
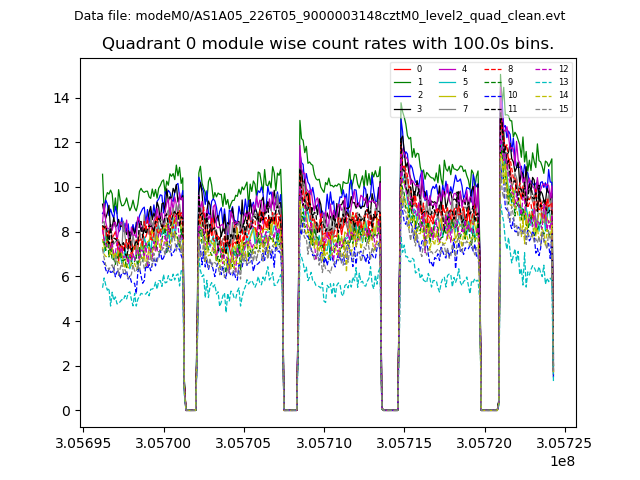 |
 |
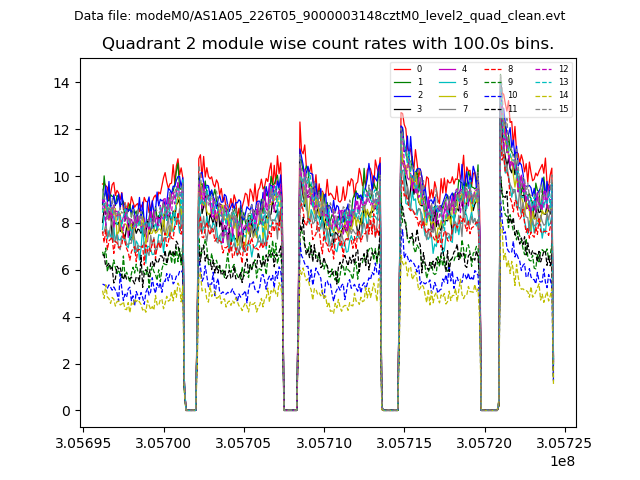
| Module-wise count rates for Quadrant B Data is divided into 100 sec bins |
 |
 |
| Module-wise count rates for Quadrant C Data is divided into 100 sec bins |
 |
 |
| Module-wise count rates for Quadrant D Data is divided into 100 sec bins |
 |
 |
| Parameter | Plot |
|---|---|
| CZT HV Monitor | 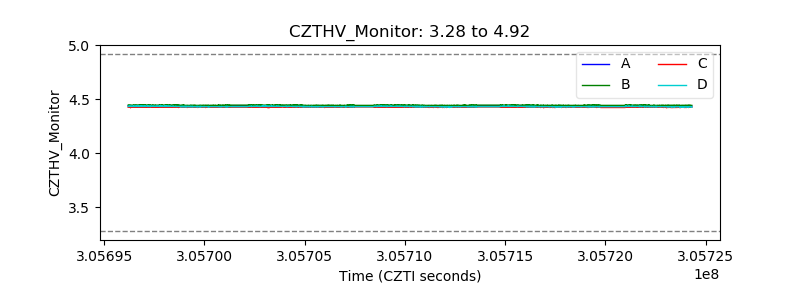 |
| D_VDD | 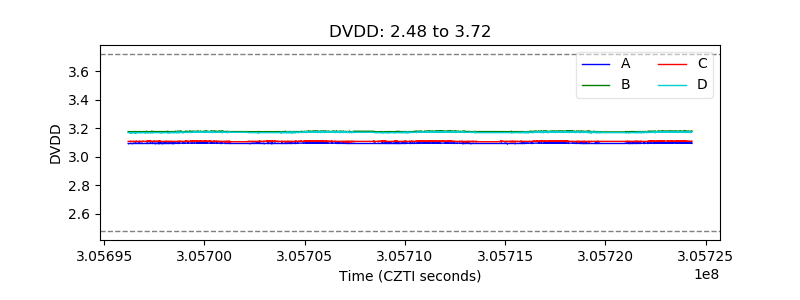 |
| Temperature 1 | 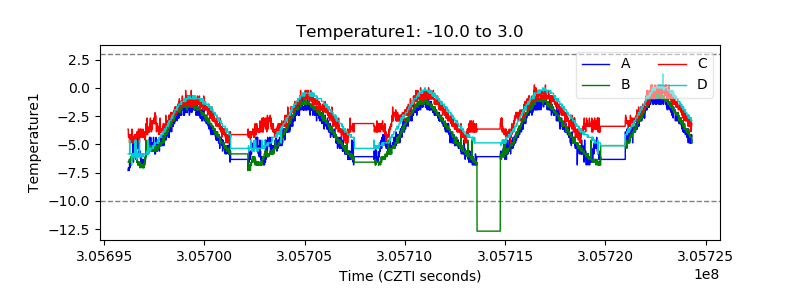 |
| Veto HV Monitor | 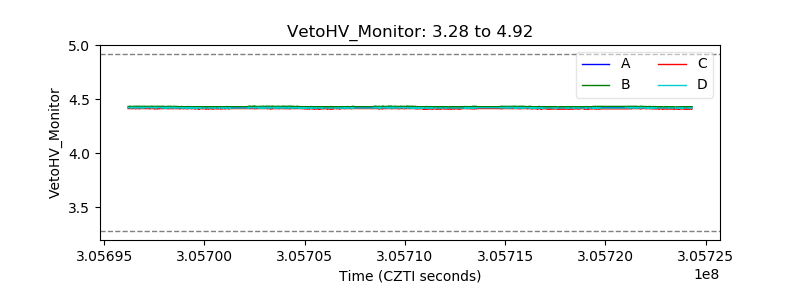 |
| Veto LLD | 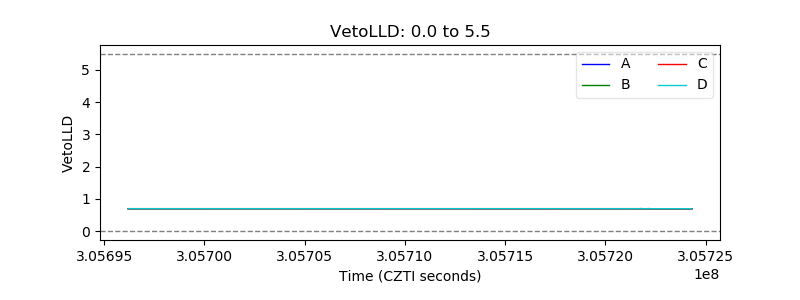 |
| Alpha Counter | 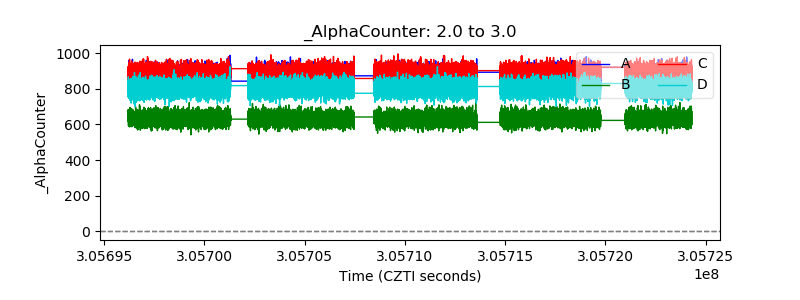 |
| _CPM_Rate | 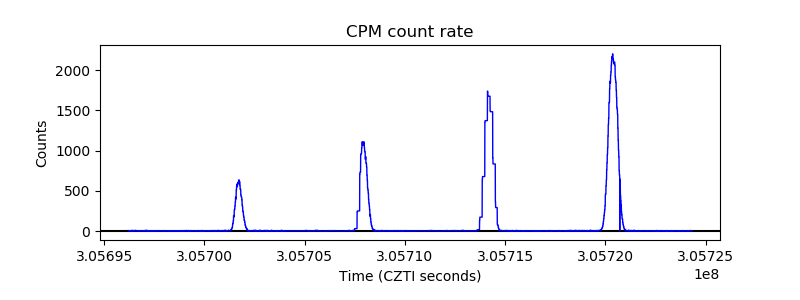 |
| CZT Counter | 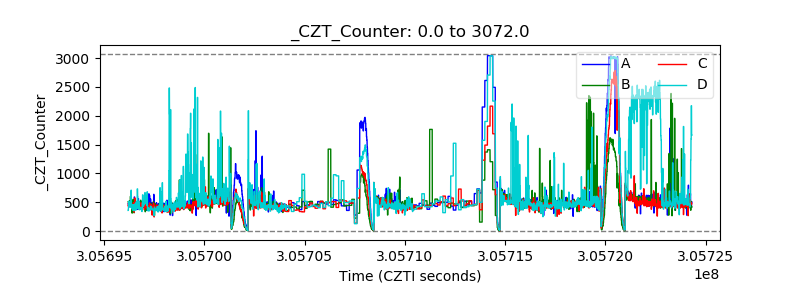 |
| +2.5 Volts monitor |  |
| +5 Volts monitor | 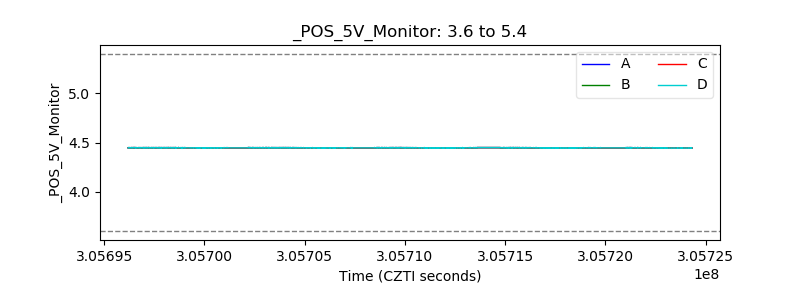 |
| _ROLL_ROT | 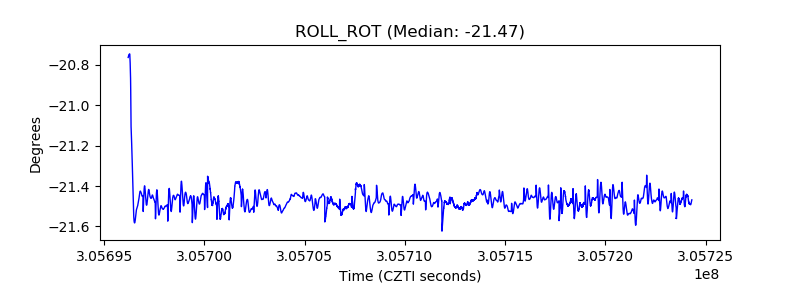 |
| _Roll_DEC | 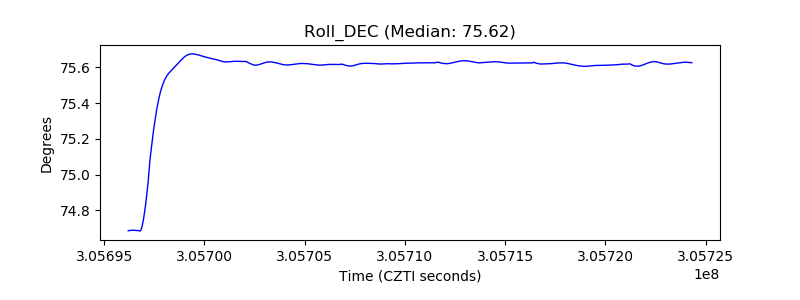 |
| _Roll_RA | 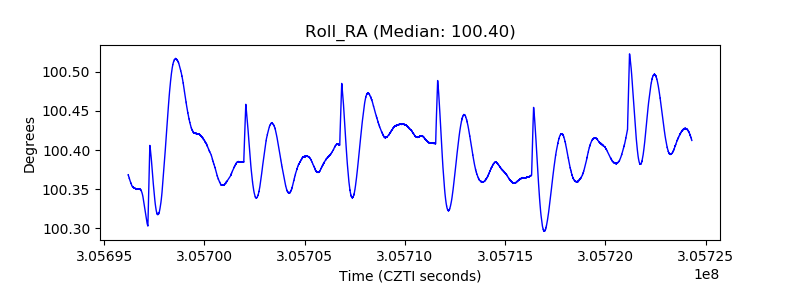 |
| Veto Counter | 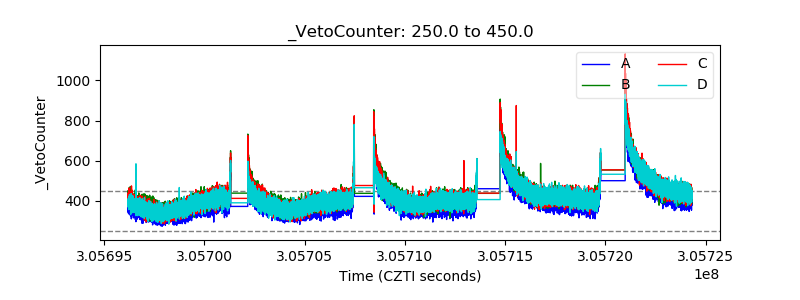 |