| Param | Original file | Final file |
|---|---|---|
| Filename | modeM0/AS1A05_226T05_9000003148_21345cztM0_level2.evt | modeM0/AS1A05_226T05_9000003148_21345cztM0_level2_quad_clean.evt |
| Size (bytes) | 434,185,920 | 119,329,920 |
| Size | 414.1 MB | 113.8 MB |
| Events in quadrant A | 3,109,636 | 805,651 |
| Events in quadrant B | 3,061,365 | 817,395 |
| Events in quadrant C | 2,884,869 | 787,304 |
| Events in quadrant D | 3,666,124 | 765,259 |
| Mode M9 | |||
|---|---|---|---|
| Quadrant | BADHDUFLAG | Total packets | Discarded packets |
| A | 0 | 10 | 0 |
| B | 0 | 10 | 0 |
| C | 0 | 10 | 0 |
| D | 0 | 10 | 0 |
| Mode M0 | |||
|---|---|---|---|
| Quadrant | BADHDUFLAG | Total packets | Discarded packets |
| A | 0 | 13080 | 1 |
| B | 0 | 13150 | 1 |
| C | 0 | 12763 | 1 |
| D | 0 | 15216 | 1 |
| Mode SS | |||
|---|---|---|---|
| Quadrant | BADHDUFLAG | Total packets | Discarded packets |
| A | 0 | 128 | 0 |
| B | 0 | 128 | 0 |
| C | 0 | 128 | 0 |
| D | 0 | 128 | 0 |
| Quadrant | Total seconds | Saturated seconds | Saturation percentage |
|---|---|---|---|
| A | 6283 | 61 | 0.970874% |
| B | 6284 | 50 | 0.795672% |
| C | 6284 | 55 | 0.875239% |
| D | 6284 | 194 | 3.087206% |
Noise dominated data is calculated using 1-second bins in cleaned event files. If a bin has >2000 counts, and if more than 50% of those come from <1% of pixels, then it is considered to be noise-dominated and hence unusable.
| Quadrant | # 1 sec bins | Bins with >0 counts | Bins with >2000 counts | High rate bins dominated by noise | Noise dominated (total time) | Noise dominated (detector-on time) | Marked lightcurve |
|---|---|---|---|---|---|---|---|
| A | 7263 | 6284 | 10 | 10 | 0.14% | 0.16% | 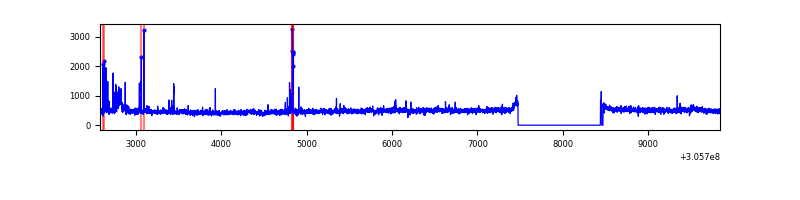 |
| B | 7264 | 6285 | 4 | 4 | 0.06% | 0.06% | 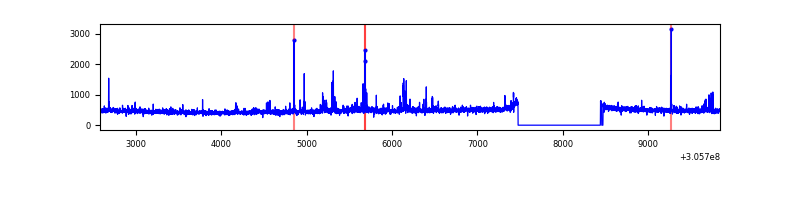 |
| C | 7264 | 6286 | 0 | 0 | 0.00% | 0.00% | 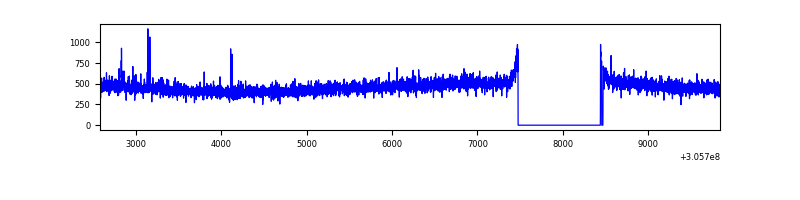 |
| D | 7264 | 6285 | 127 | 127 | 1.75% | 2.02% | 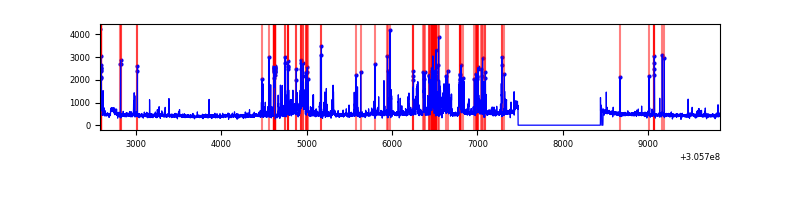 |
Top three noisy pixels from each quadrant. If the there are fewer than three noisy pixels in the level2.evt file, extra rows are filled as -1
| Pixel properties | Quadrant properties | ||||||
|---|---|---|---|---|---|---|---|
| Quadrant | DetID | PixID | Counts | Sigma | Mean | Median | Sigma |
| A | 5 | 168 | 104969 | 700.02 | 741 | 726 | 148.9 |
| A | 9 | 143 | 77478 | 515.41 | 741 | 726 | 148.9 |
| A | 15 | 174 | 35011 | 230.23 | 741 | 726 | 148.9 |
| B | 0 | 230 | 41234 | 294.56 | 738 | 720 | 137.5 |
| B | 0 | 245 | 32367 | 230.09 | 738 | 720 | 137.5 |
| B | 3 | 64 | 31617 | 224.64 | 738 | 720 | 137.5 |
| C | 14 | 238 | 113057 | 684.48 | 706 | 711 | 164.1 |
| C | 10 | 23 | 9216 | 51.82 | 706 | 711 | 164.1 |
| C | 7 | 247 | 8797 | 49.26 | 706 | 711 | 164.1 |
| D | 1 | 52 | 681705 | 3981.53 | 712 | 691 | 171.0 |
| D | 7 | 38 | 96824 | 562.04 | 712 | 691 | 171.0 |
| D | 13 | 153 | 68169 | 394.51 | 712 | 691 | 171.0 |
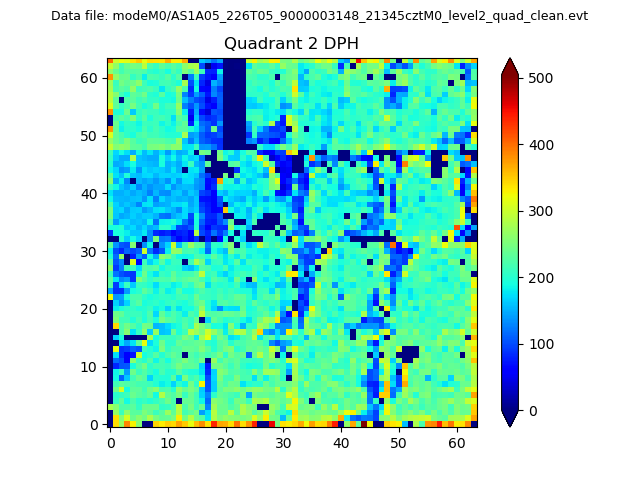
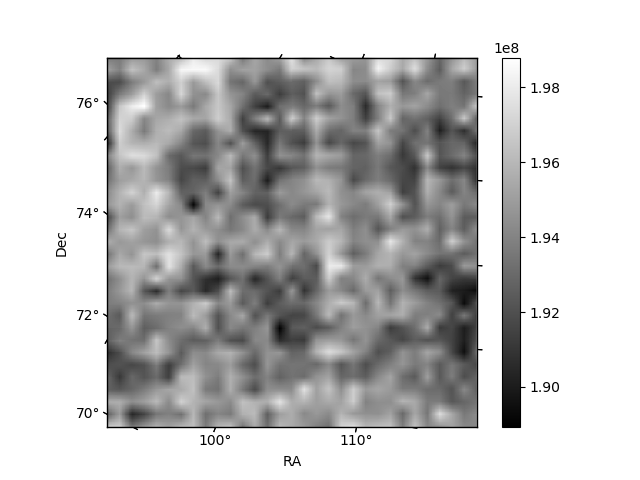
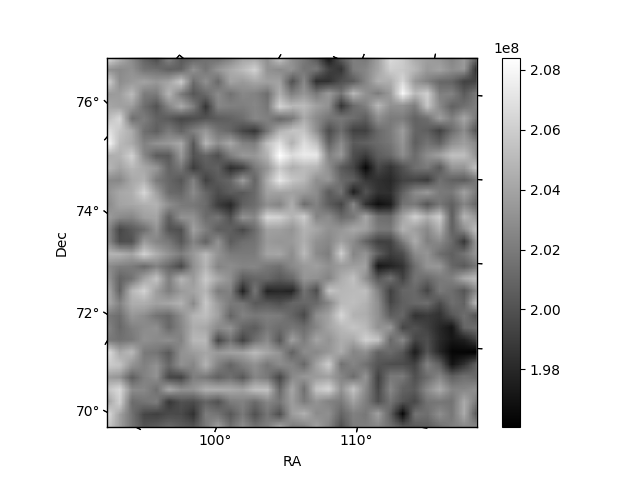
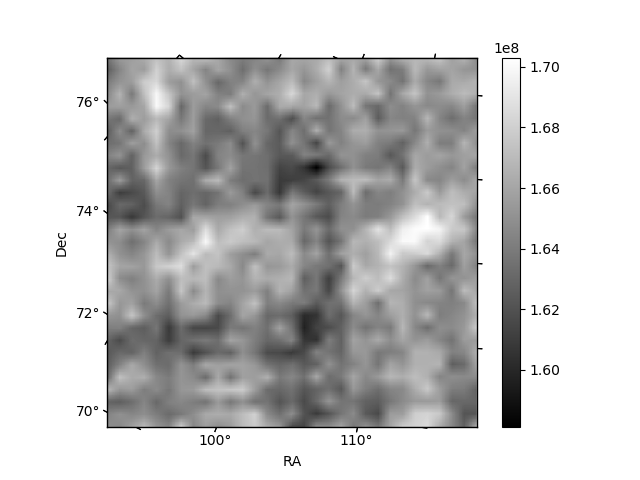
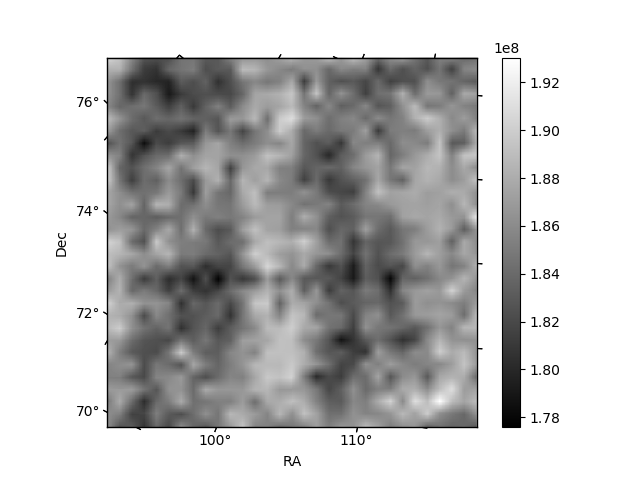
Histogram calculated using DETX and DETY for each event in the final _common_clean file
| Quadrant A | 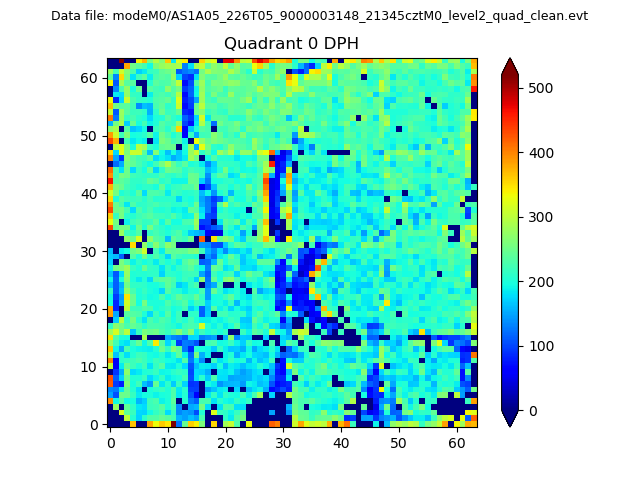 |
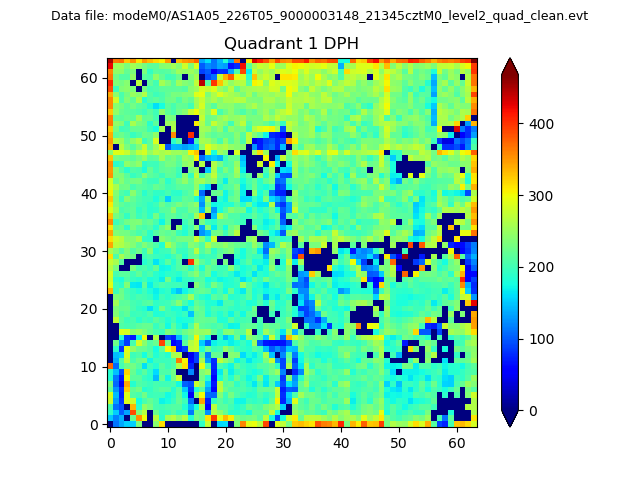 |
Quadrant B |
|---|---|---|---|
| Quadrant D | 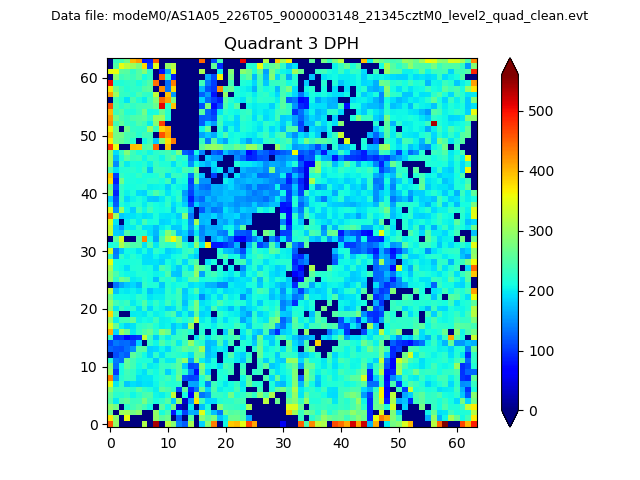 |
 |
Quadrant C |
| Plot type | Count rate plots | Images |
|---|---|---|
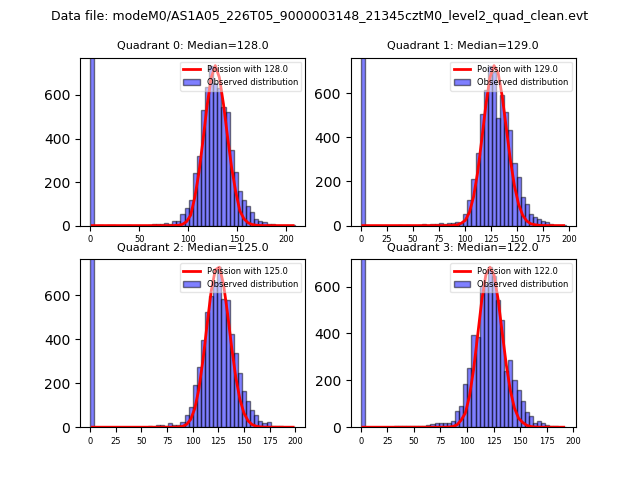
| Comparison with Poisson distribution Blue bars denote a histogram of data divided into 1 sec bins. Red curve is a Poisson curve with rate = median count rate of data. |
 |
 |
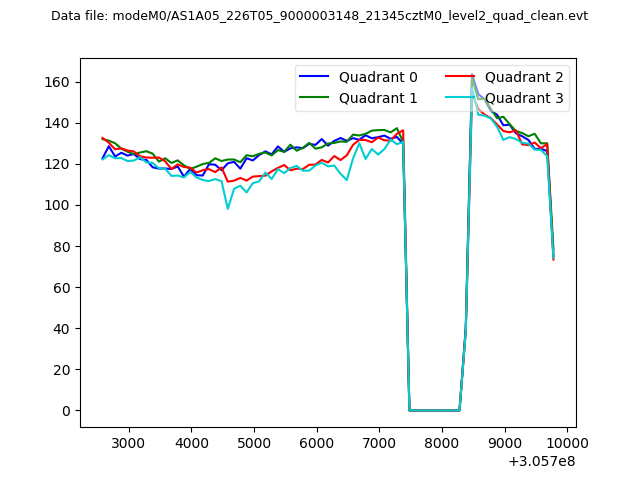
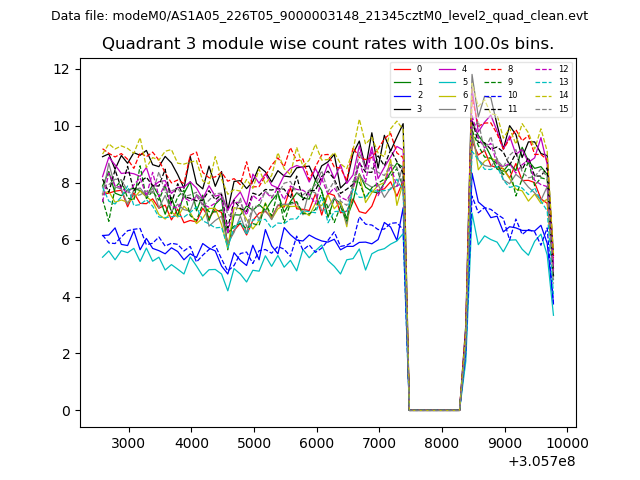
| Quadrant-wise count rates Data is divided into 100 sec bins |
 |
|
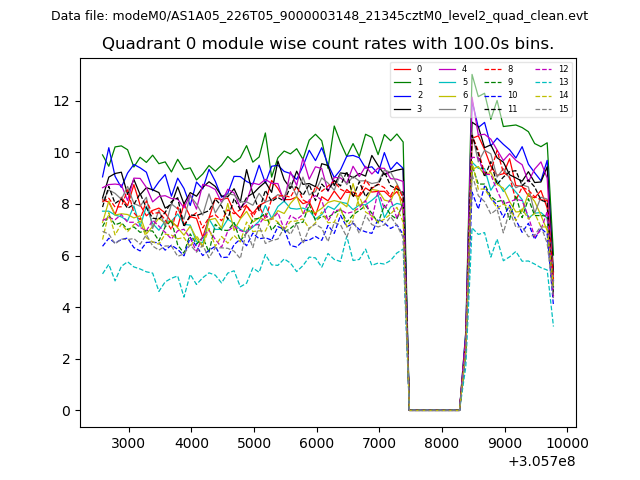
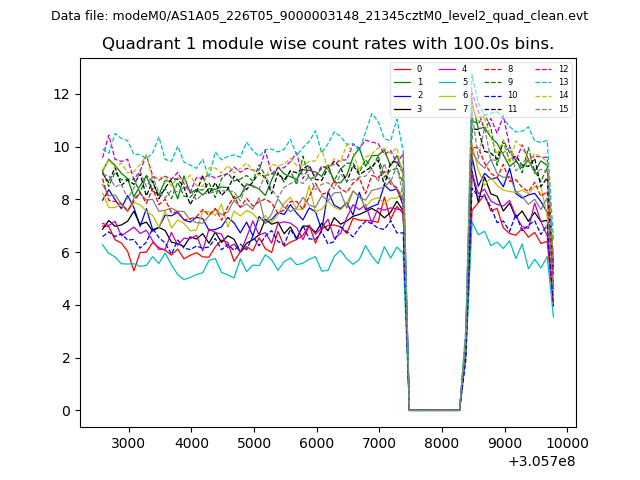
| Module-wise count rates for Quadrant A Data is divided into 100 sec bins |
 |
 |
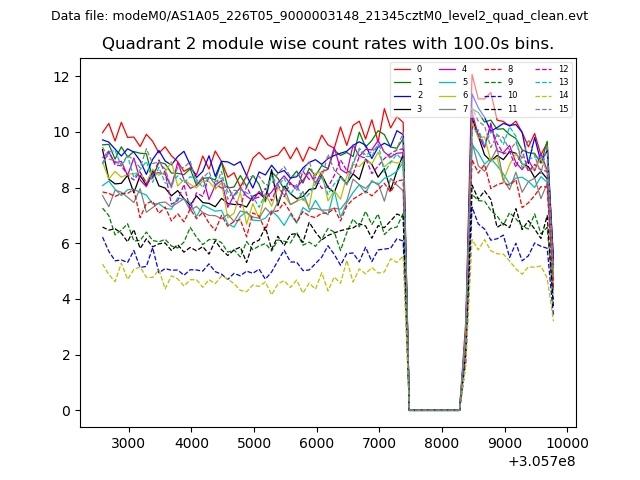
| Module-wise count rates for Quadrant B Data is divided into 100 sec bins |
 |
 |
| Module-wise count rates for Quadrant C Data is divided into 100 sec bins |
 |
 |
| Module-wise count rates for Quadrant D Data is divided into 100 sec bins |
 |
 |
| Parameter | Plot |
|---|---|
| CZT HV Monitor | 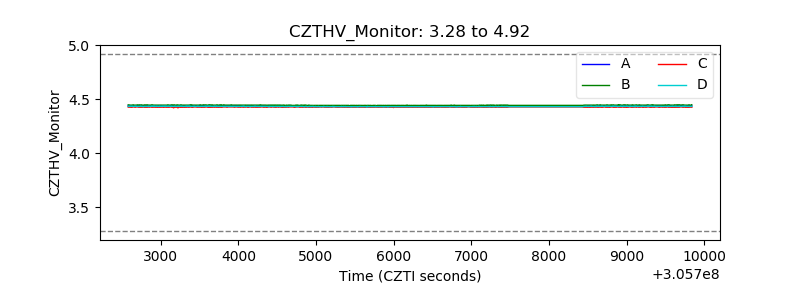 |
| D_VDD | 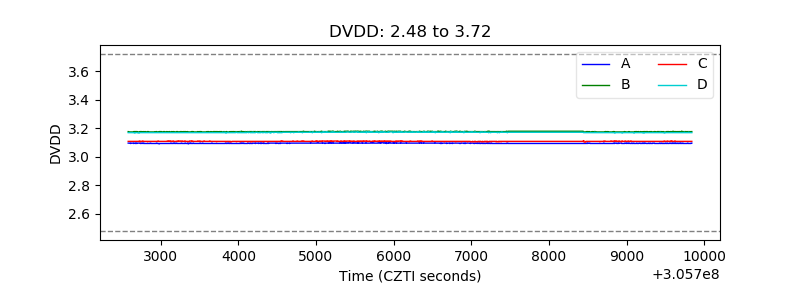 |
| Temperature 1 | 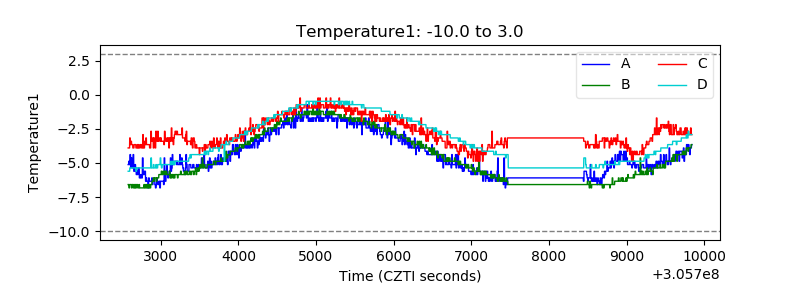 |
| Veto HV Monitor | 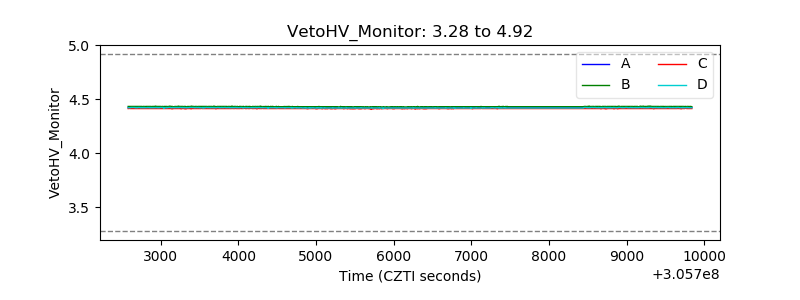 |
| Veto LLD | 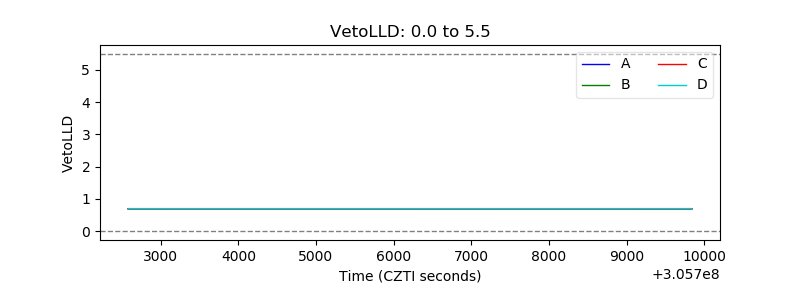 |
| Alpha Counter | 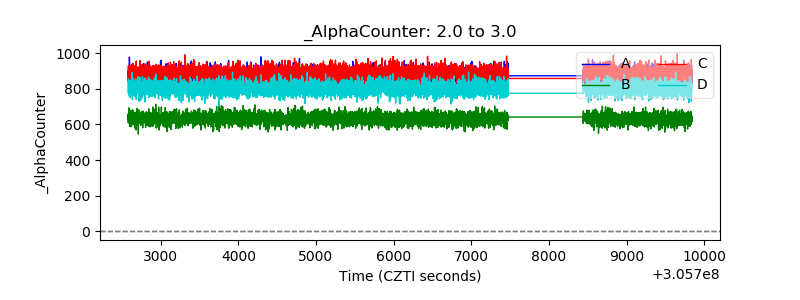 |
| _CPM_Rate | 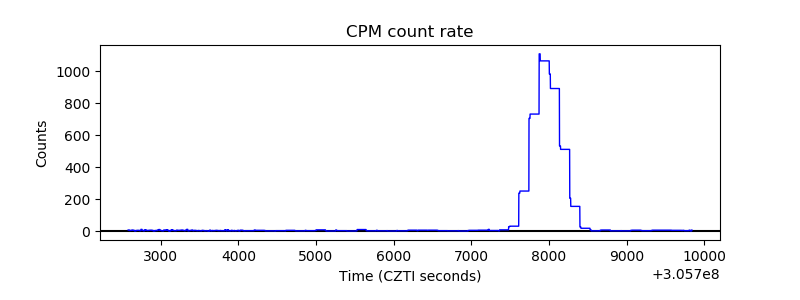 |
| CZT Counter | 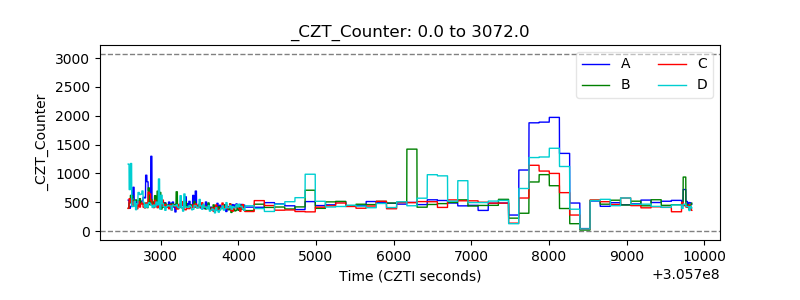 |
| +2.5 Volts monitor |  |
| +5 Volts monitor | 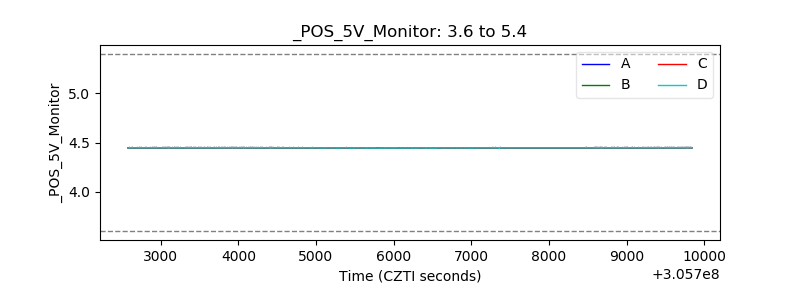 |
| _ROLL_ROT | 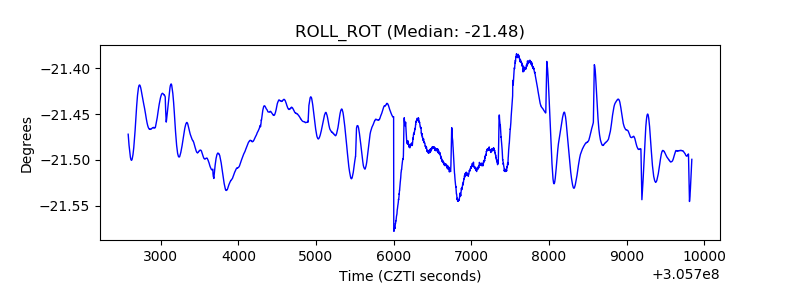 |
| _Roll_DEC | 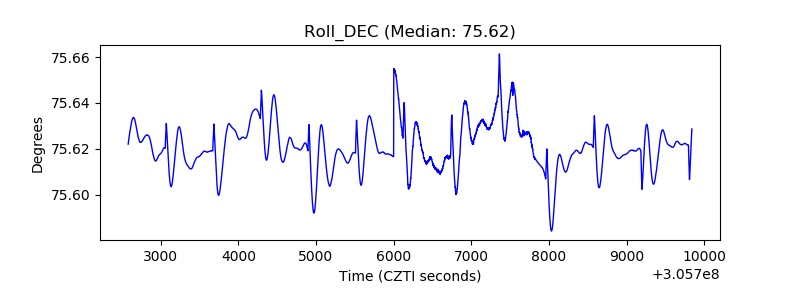 |
| _Roll_RA | 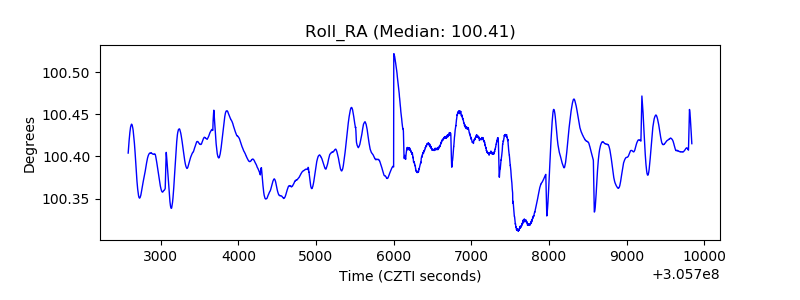 |
| Veto Counter | 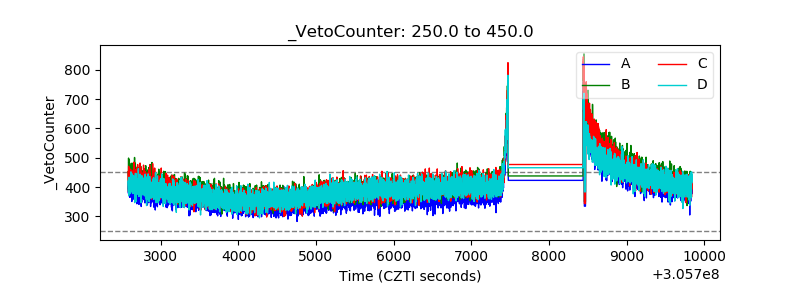 |