| Param | Original file | Final file |
|---|---|---|
| Filename | modeM0/AS1A05_226T05_9000003148_21347cztM0_level2.evt | modeM0/AS1A05_226T05_9000003148_21347cztM0_level2_quad_clean.evt |
| Size (bytes) | 443,923,200 | 128,862,720 |
| Size | 423.4 MB | 122.9 MB |
| Events in quadrant A | 3,178,965 | 881,664 |
| Events in quadrant B | 3,264,781 | 888,049 |
| Events in quadrant C | 3,053,231 | 846,323 |
| Events in quadrant D | 3,508,740 | 836,951 |
| Mode M9 | |||
|---|---|---|---|
| Quadrant | BADHDUFLAG | Total packets | Discarded packets |
| A | 0 | 11 | 0 |
| B | 0 | 12 | 0 |
| C | 0 | 12 | 0 |
| D | 0 | 12 | 0 |
| Mode M0 | |||
|---|---|---|---|
| Quadrant | BADHDUFLAG | Total packets | Discarded packets |
| A | 0 | 13333 | 2 |
| B | 0 | 13709 | 2 |
| C | 0 | 13218 | 2 |
| D | 0 | 14711 | 2 |
| Mode SS | |||
|---|---|---|---|
| Quadrant | BADHDUFLAG | Total packets | Discarded packets |
| A | 0 | 132 | 0 |
| B | 0 | 132 | 0 |
| C | 0 | 132 | 0 |
| D | 0 | 132 | 0 |
| Quadrant | Total seconds | Saturated seconds | Saturation percentage |
|---|---|---|---|
| A | 6450 | 14 | 0.217054% |
| B | 6450 | 25 | 0.387597% |
| C | 6450 | 32 | 0.496124% |
| D | 6450 | 107 | 1.658915% |
Noise dominated data is calculated using 1-second bins in cleaned event files. If a bin has >2000 counts, and if more than 50% of those come from <1% of pixels, then it is considered to be noise-dominated and hence unusable.
| Quadrant | # 1 sec bins | Bins with >0 counts | Bins with >2000 counts | High rate bins dominated by noise | Noise dominated (total time) | Noise dominated (detector-on time) | Marked lightcurve |
|---|---|---|---|---|---|---|---|
| A | 7620 | 6452 | 2 | 2 | 0.03% | 0.03% | 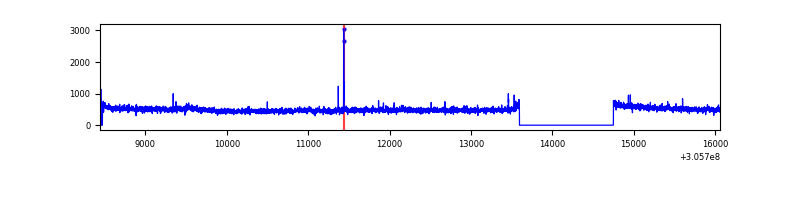 |
| B | 7620 | 6452 | 8 | 8 | 0.10% | 0.12% | 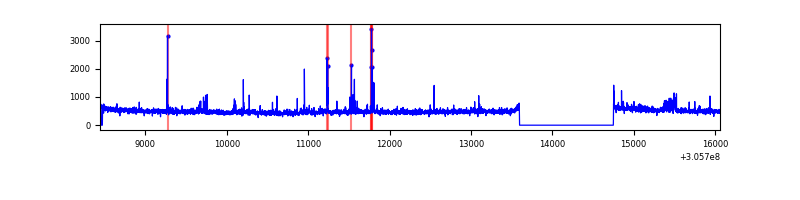 |
| C | 7620 | 6452 | 0 | 0 | 0.00% | 0.00% | 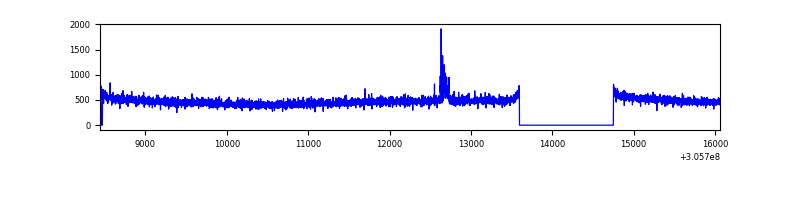 |
| D | 7620 | 6452 | 104 | 104 | 1.36% | 1.61% | 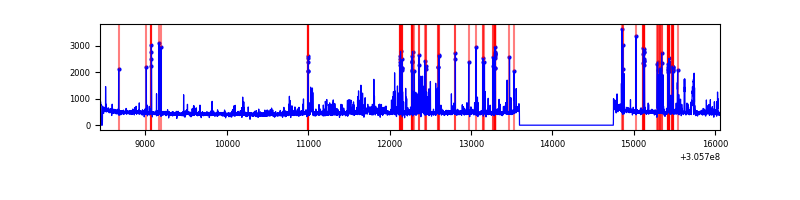 |
Top three noisy pixels from each quadrant. If the there are fewer than three noisy pixels in the level2.evt file, extra rows are filled as -1
| Pixel properties | Quadrant properties | ||||||
|---|---|---|---|---|---|---|---|
| Quadrant | DetID | PixID | Counts | Sigma | Mean | Median | Sigma |
| A | 5 | 168 | 72810 | 457.87 | 791 | 776 | 157.3 |
| A | 15 | 174 | 27876 | 172.26 | 791 | 776 | 157.3 |
| A | 11 | 47 | 11721 | 69.57 | 791 | 776 | 157.3 |
| B | 0 | 230 | 82241 | 554.57 | 782 | 763 | 146.9 |
| B | 0 | 189 | 40998 | 273.86 | 782 | 763 | 146.9 |
| B | 3 | 64 | 28218 | 186.87 | 782 | 763 | 146.9 |
| C | 14 | 238 | 119599 | 694.7 | 744 | 748 | 171.1 |
| C | 3 | 9 | 29495 | 168.03 | 744 | 748 | 171.1 |
| C | 13 | 61 | 5303 | 26.62 | 744 | 748 | 171.1 |
| D | 1 | 52 | 534402 | 2907.29 | 760 | 737 | 183.6 |
| D | 7 | 38 | 36777 | 196.34 | 760 | 737 | 183.6 |
| D | 2 | 234 | 26563 | 140.69 | 760 | 737 | 183.6 |
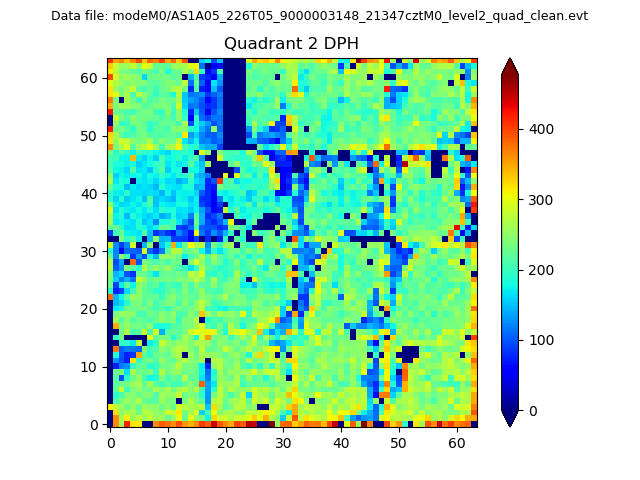
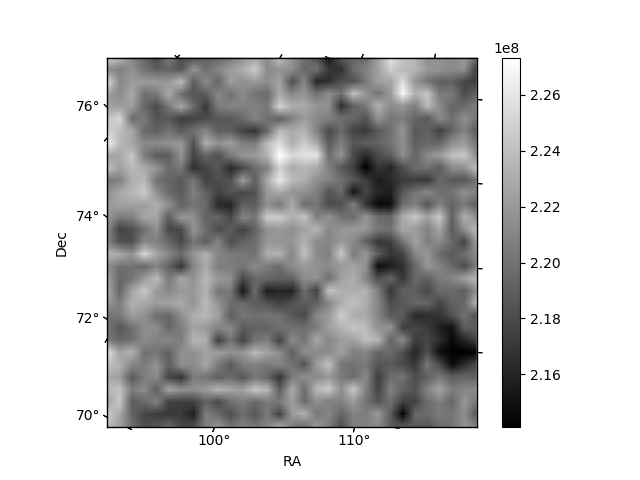
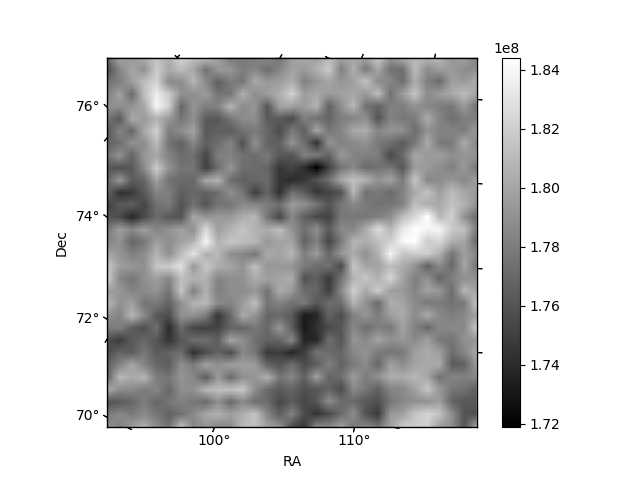
Histogram calculated using DETX and DETY for each event in the final _common_clean file
| Quadrant A | 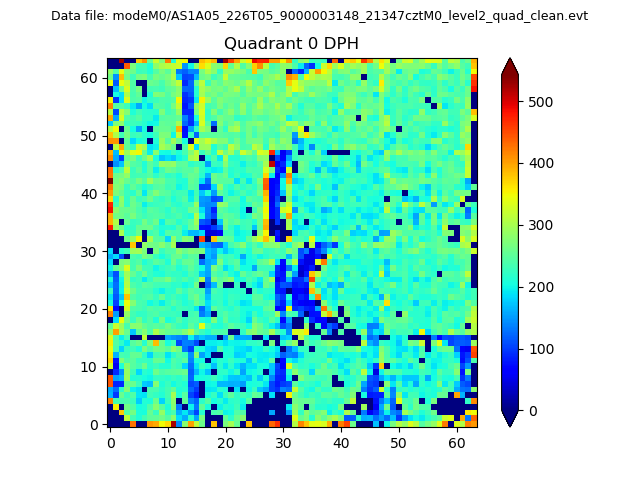 |
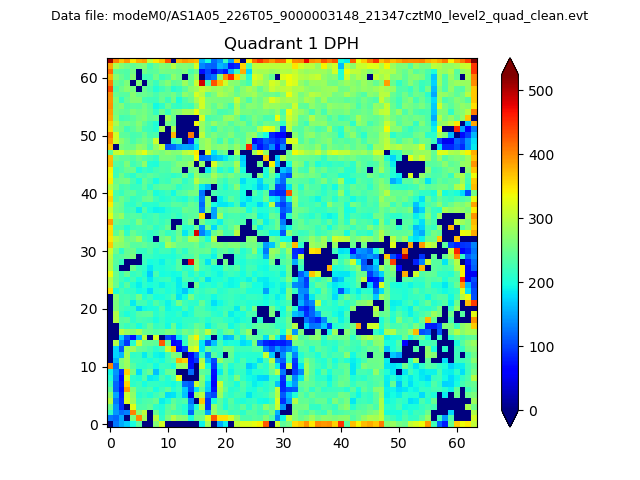 |
Quadrant B |
|---|---|---|---|
| Quadrant D | 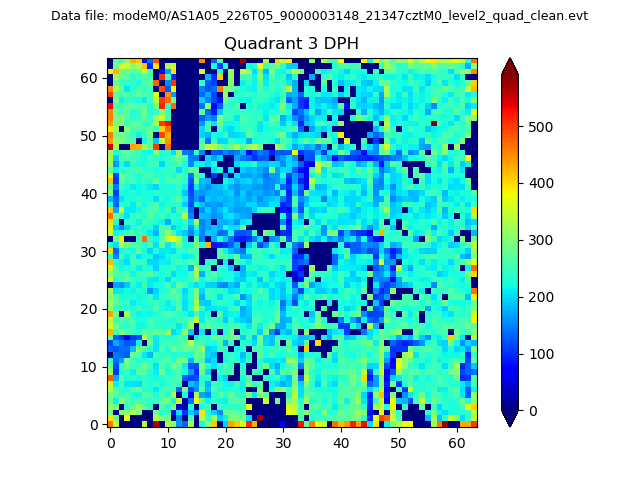 |
 |
Quadrant C |
| Plot type | Count rate plots | Images |
|---|---|---|
| Comparison with Poisson distribution Blue bars denote a histogram of data divided into 1 sec bins. Red curve is a Poisson curve with rate = median count rate of data. |
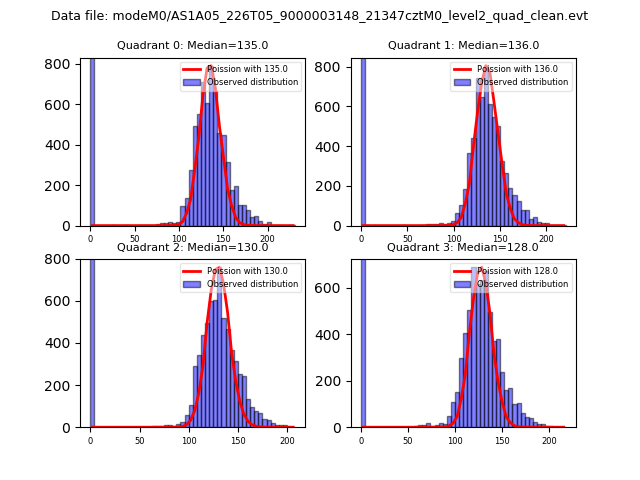 |
 |
| Quadrant-wise count rates Data is divided into 100 sec bins |
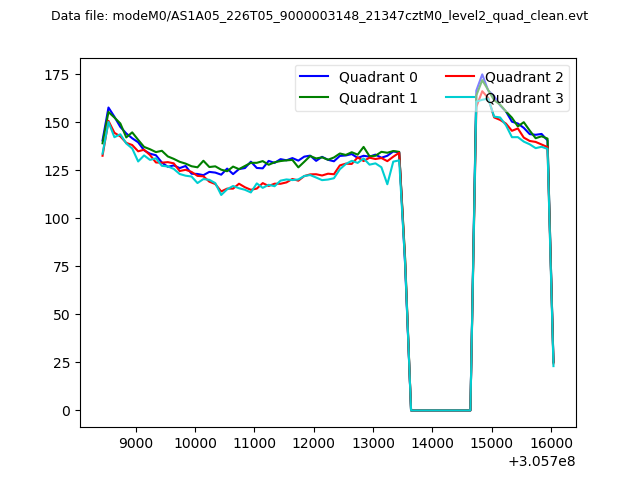 |
|
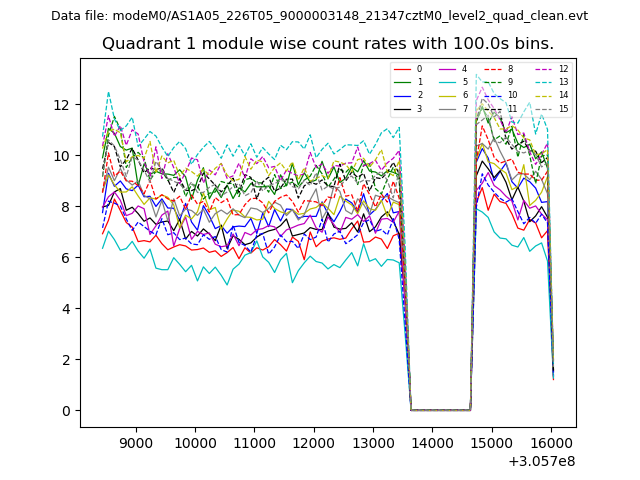
| Module-wise count rates for Quadrant A Data is divided into 100 sec bins |
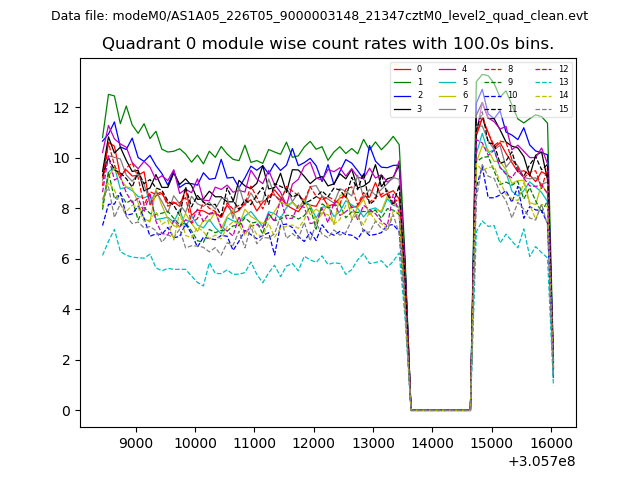 |
 |
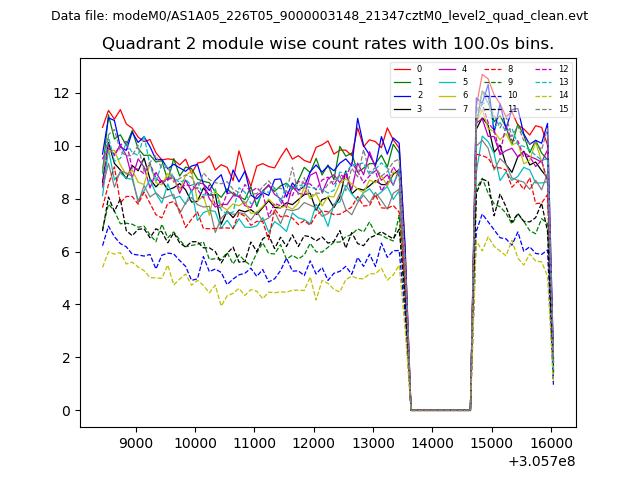
| Module-wise count rates for Quadrant B Data is divided into 100 sec bins |
 |
 |
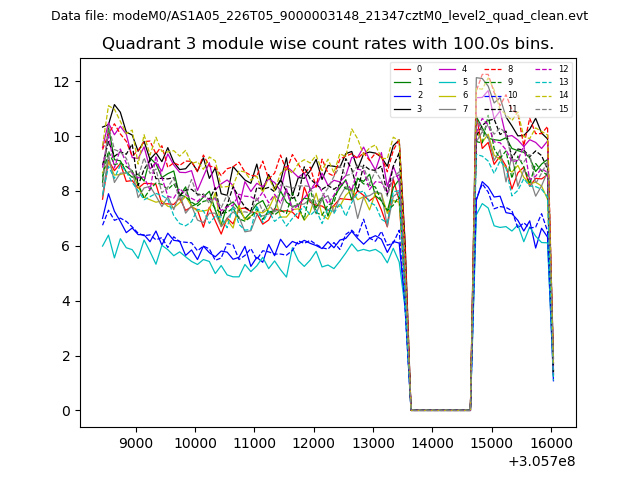
| Module-wise count rates for Quadrant C Data is divided into 100 sec bins |
 |
 |
| Module-wise count rates for Quadrant D Data is divided into 100 sec bins |
 |
 |
| Parameter | Plot |
|---|---|
| CZT HV Monitor | 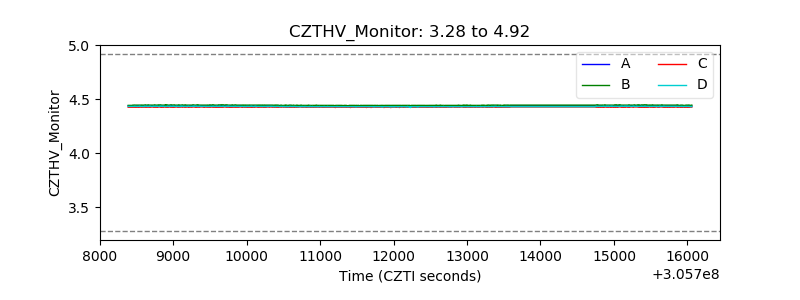 |
| D_VDD | 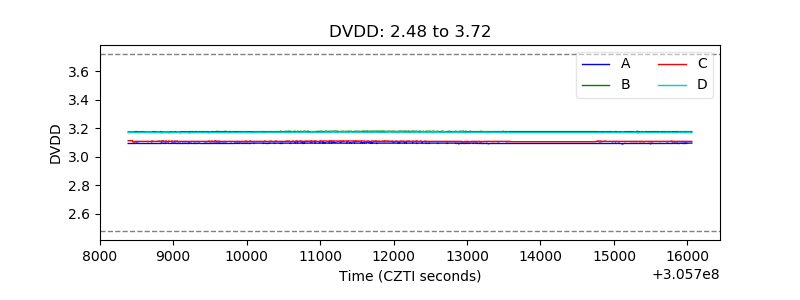 |
| Temperature 1 | 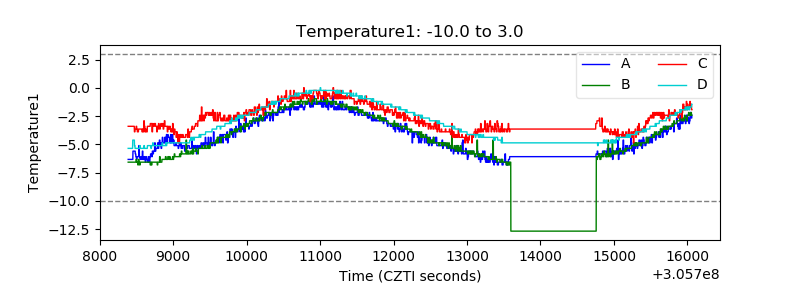 |
| Veto HV Monitor | 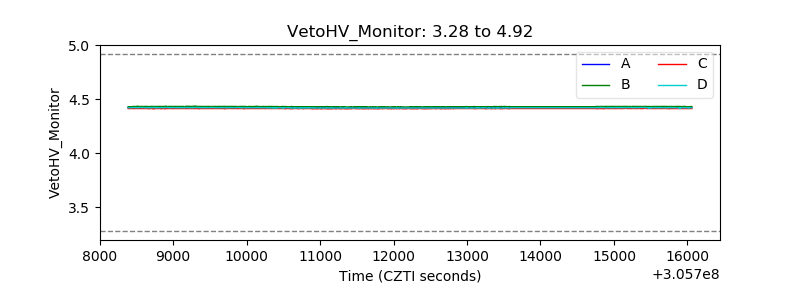 |
| Veto LLD | 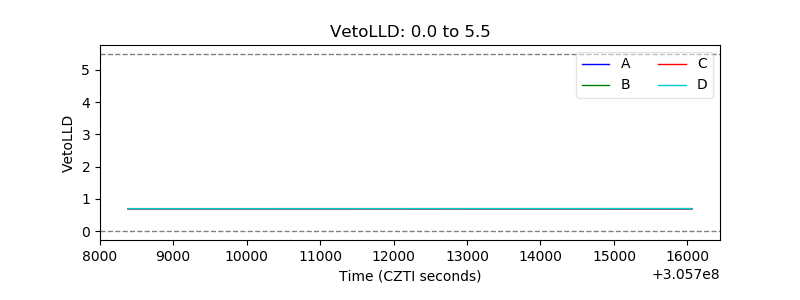 |
| Alpha Counter | 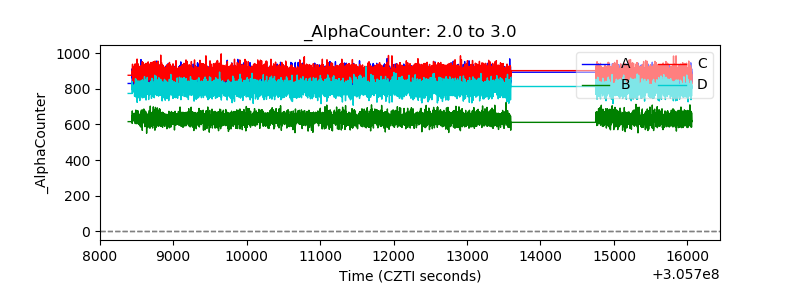 |
| _CPM_Rate | 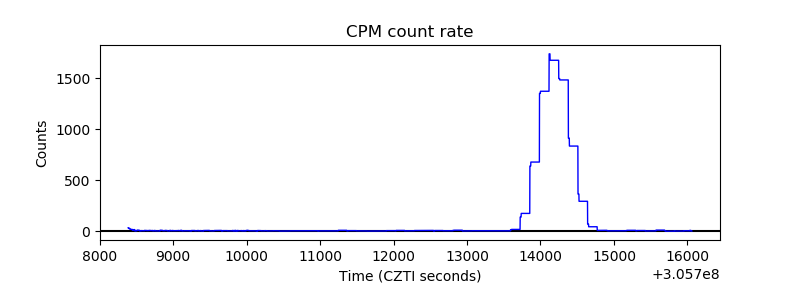 |
| CZT Counter | 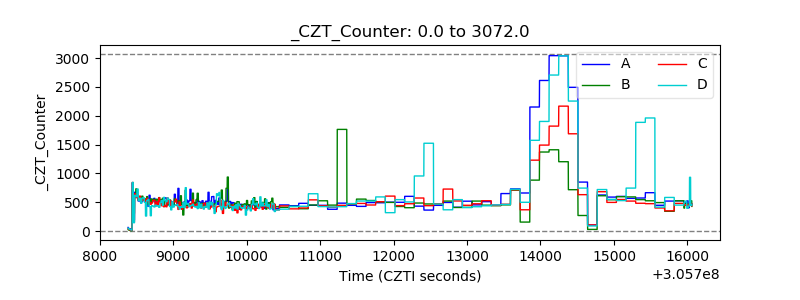 |
| +2.5 Volts monitor |  |
| +5 Volts monitor |  |
| _ROLL_ROT | 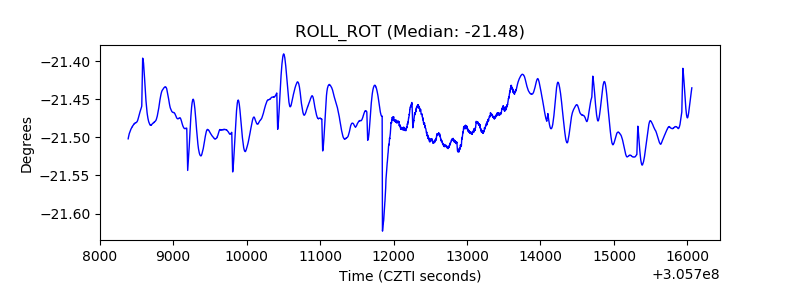 |
| _Roll_DEC | 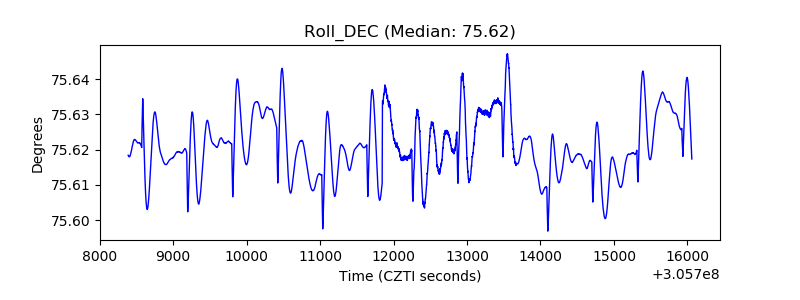 |
| _Roll_RA |  |
| Veto Counter | 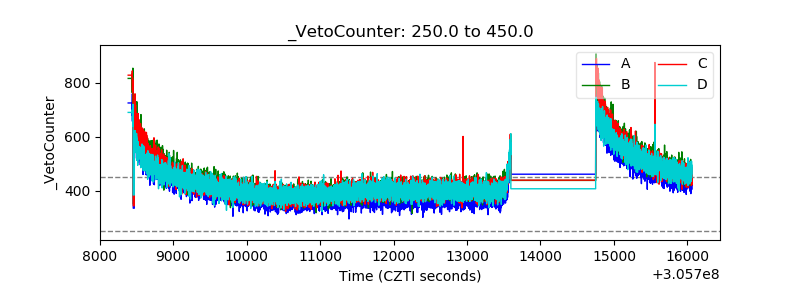 |