| Param | Original file | Final file |
|---|---|---|
| Filename | modeM0/AS1A05_226T05_9000003148_21348cztM0_level2.evt | modeM0/AS1A05_226T05_9000003148_21348cztM0_level2_quad_clean.evt |
| Size (bytes) | 486,037,440 | 120,409,920 |
| Size | 463.5 MB | 114.8 MB |
| Events in quadrant A | 3,006,316 | 852,639 |
| Events in quadrant B | 3,382,881 | 847,773 |
| Events in quadrant C | 2,856,192 | 810,058 |
| Events in quadrant D | 5,073,252 | 723,902 |
| Mode M9 | |||
|---|---|---|---|
| Quadrant | BADHDUFLAG | Total packets | Discarded packets |
| A | 0 | 13 | 0 |
| B | 0 | 13 | 0 |
| C | 0 | 13 | 0 |
| D | 0 | 13 | 0 |
| Mode M0 | |||
|---|---|---|---|
| Quadrant | BADHDUFLAG | Total packets | Discarded packets |
| A | 0 | 12415 | 2 |
| B | 0 | 13741 | 1 |
| C | 0 | 12149 | 1 |
| D | 0 | 19035 | 1 |
| Mode SS | |||
|---|---|---|---|
| Quadrant | BADHDUFLAG | Total packets | Discarded packets |
| A | 0 | 118 | 0 |
| B | 0 | 118 | 0 |
| C | 0 | 118 | 0 |
| D | 0 | 118 | 0 |
| Quadrant | Total seconds | Saturated seconds | Saturation percentage |
|---|---|---|---|
| A | 5906 | 30 | 0.507958% |
| B | 5906 | 121 | 2.048764% |
| C | 5906 | 38 | 0.643413% |
| D | 5907 | 1108 | 18.757406% |
Noise dominated data is calculated using 1-second bins in cleaned event files. If a bin has >2000 counts, and if more than 50% of those come from <1% of pixels, then it is considered to be noise-dominated and hence unusable.
| Quadrant | # 1 sec bins | Bins with >0 counts | Bins with >2000 counts | High rate bins dominated by noise | Noise dominated (total time) | Noise dominated (detector-on time) | Marked lightcurve |
|---|---|---|---|---|---|---|---|
| A | 7131 | 5907 | 0 | 0 | 0.00% | 0.00% | 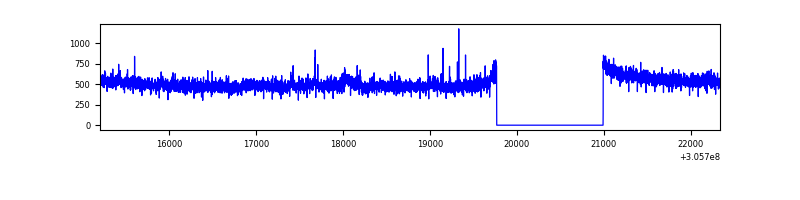 |
| B | 7131 | 5907 | 76 | 76 | 1.07% | 1.29% | 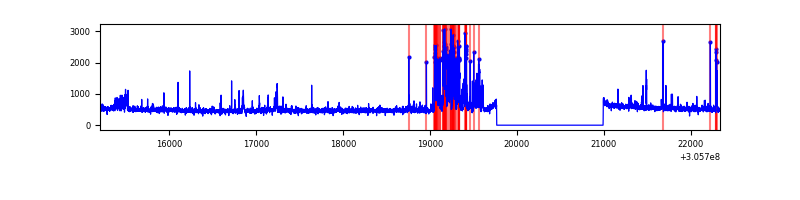 |
| C | 7131 | 5907 | 0 | 0 | 0.00% | 0.00% | 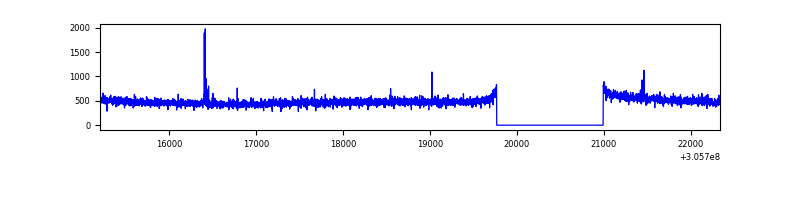 |
| D | 7132 | 5907 | 969 | 969 | 13.59% | 16.40% | 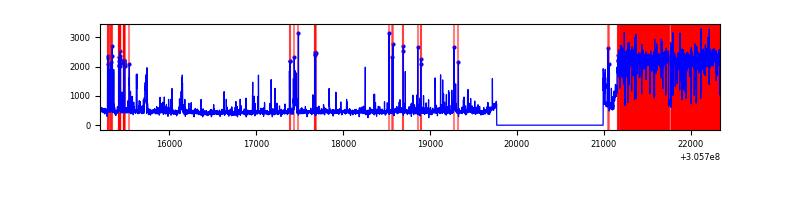 |
Top three noisy pixels from each quadrant. If the there are fewer than three noisy pixels in the level2.evt file, extra rows are filled as -1
| Pixel properties | Quadrant properties | ||||||
|---|---|---|---|---|---|---|---|
| Quadrant | DetID | PixID | Counts | Sigma | Mean | Median | Sigma |
| A | 5 | 168 | 94290 | 630.04 | 746 | 732 | 148.5 |
| A | 11 | 47 | 13220 | 84.1 | 746 | 732 | 148.5 |
| A | 9 | 143 | 12315 | 78.0 | 746 | 732 | 148.5 |
| B | 6 | 36 | 373352 | 2753.91 | 728 | 711 | 135.3 |
| B | 3 | 64 | 64900 | 474.37 | 728 | 711 | 135.3 |
| B | 0 | 230 | 62020 | 453.09 | 728 | 711 | 135.3 |
| C | 14 | 238 | 113516 | 704.8 | 699 | 704 | 160.1 |
| C | 10 | 23 | 14679 | 87.31 | 699 | 704 | 160.1 |
| C | 13 | 61 | 5046 | 27.13 | 699 | 704 | 160.1 |
| D | 13 | 174 | 2172125 | 13874.11 | 655 | 637 | 156.5 |
| D | 1 | 52 | 312373 | 1991.75 | 655 | 637 | 156.5 |
| D | 7 | 38 | 37165 | 233.39 | 655 | 637 | 156.5 |
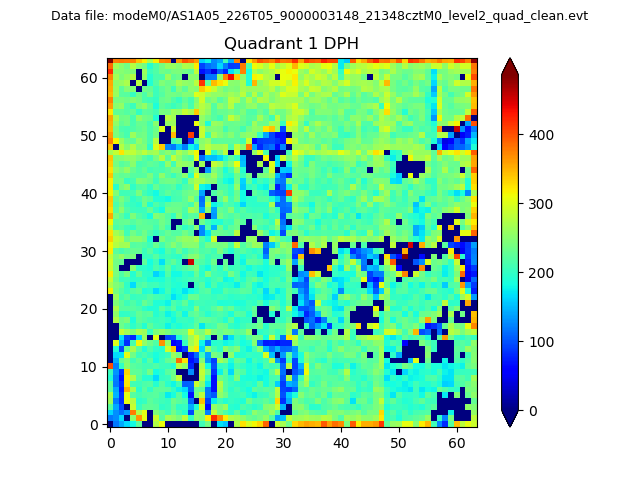
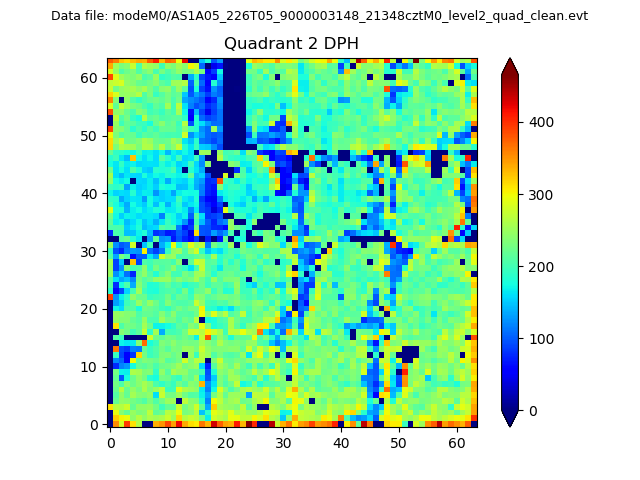
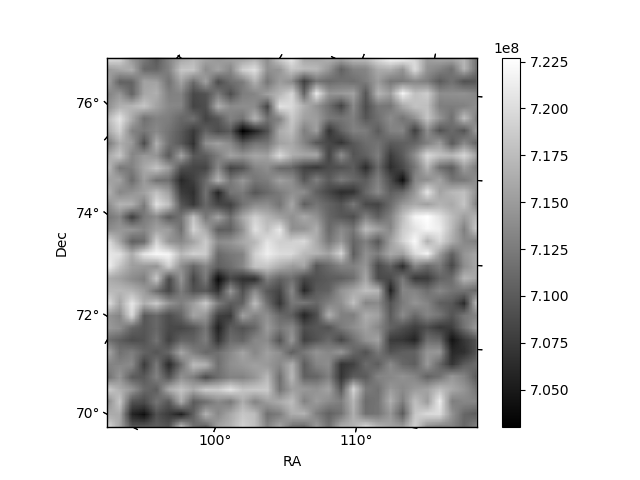
Histogram calculated using DETX and DETY for each event in the final _common_clean file
| Quadrant A |  |
 |
Quadrant B |
|---|---|---|---|
| Quadrant D | 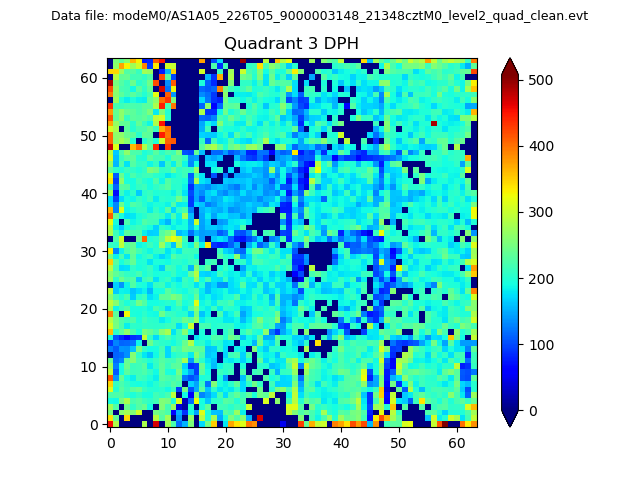 |
 |
Quadrant C |
| Plot type | Count rate plots | Images |
|---|---|---|
| Comparison with Poisson distribution Blue bars denote a histogram of data divided into 1 sec bins. Red curve is a Poisson curve with rate = median count rate of data. |
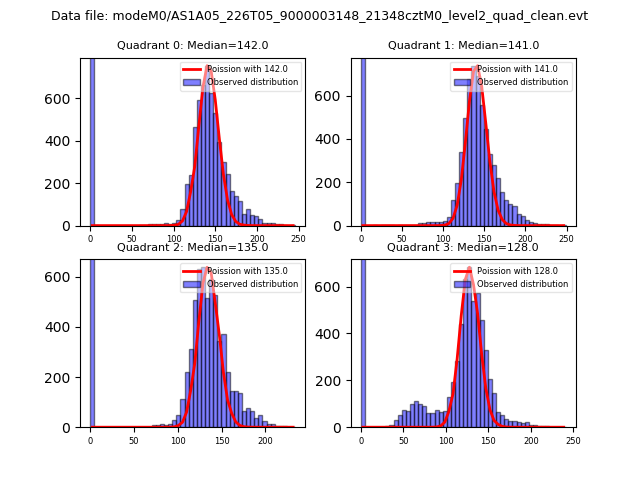 |
 |
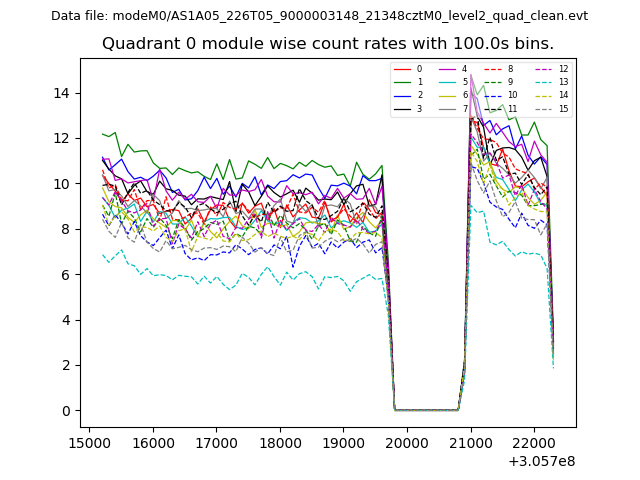
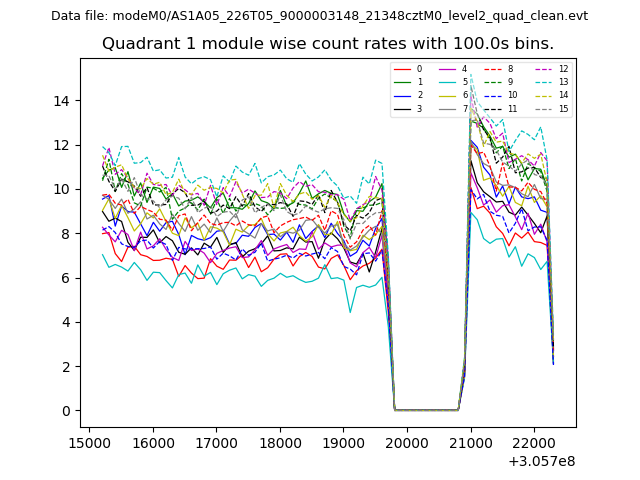
| Quadrant-wise count rates Data is divided into 100 sec bins |
 |
|
| Module-wise count rates for Quadrant A Data is divided into 100 sec bins |
 |
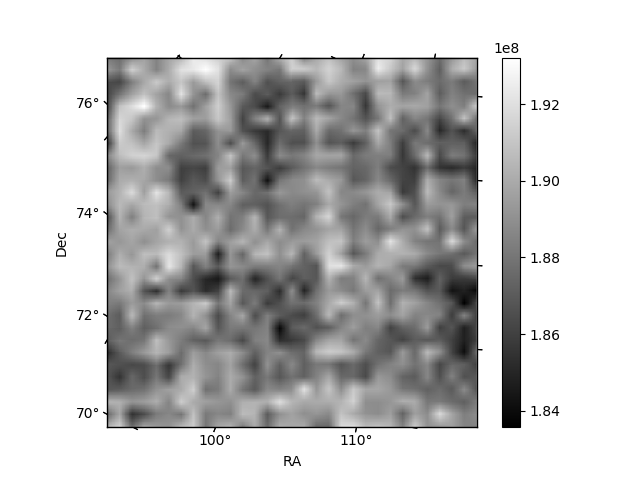 |
| Module-wise count rates for Quadrant B Data is divided into 100 sec bins |
 |
 |
| Module-wise count rates for Quadrant C Data is divided into 100 sec bins |
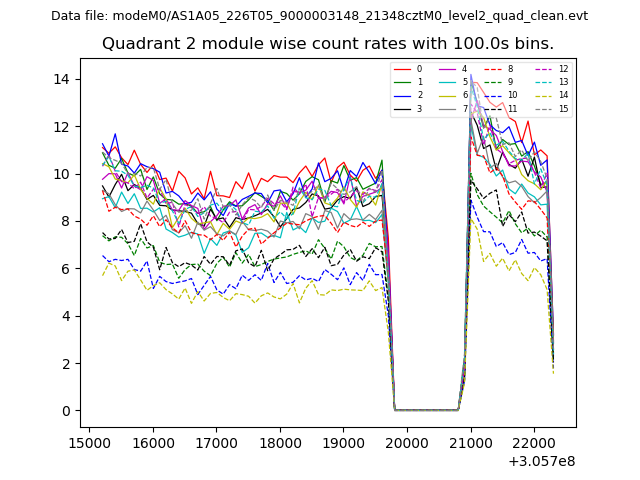 |
 |
| Module-wise count rates for Quadrant D Data is divided into 100 sec bins |
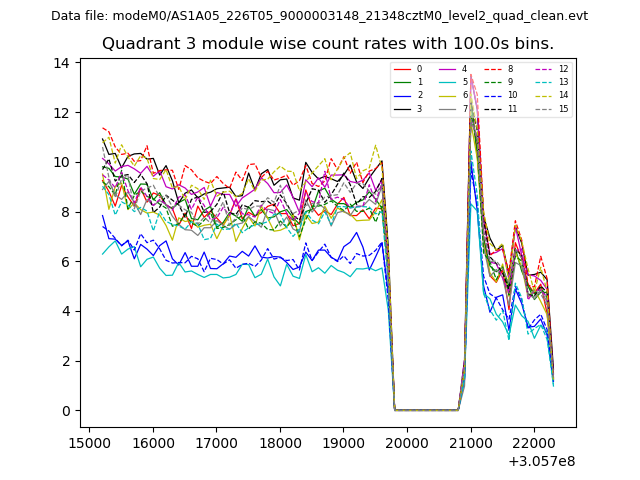 |
 |
| Parameter | Plot |
|---|---|
| CZT HV Monitor | 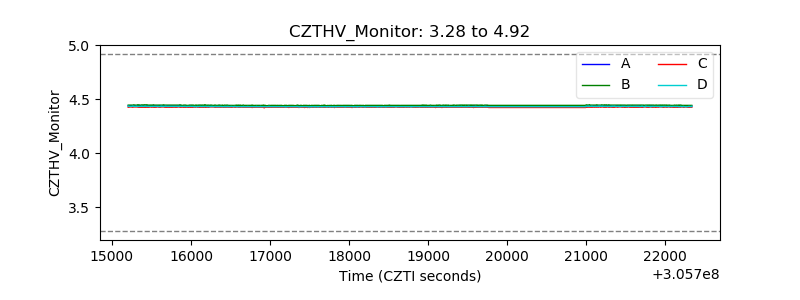 |
| D_VDD | 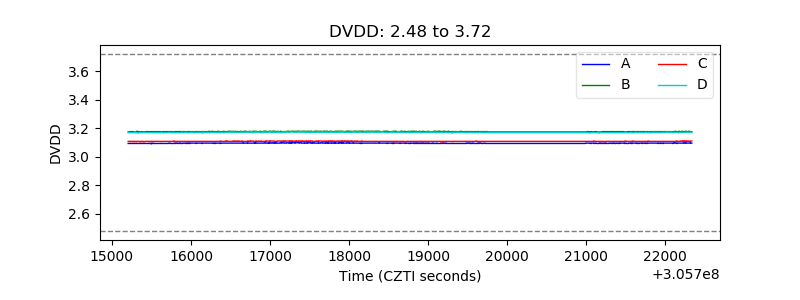 |
| Temperature 1 | 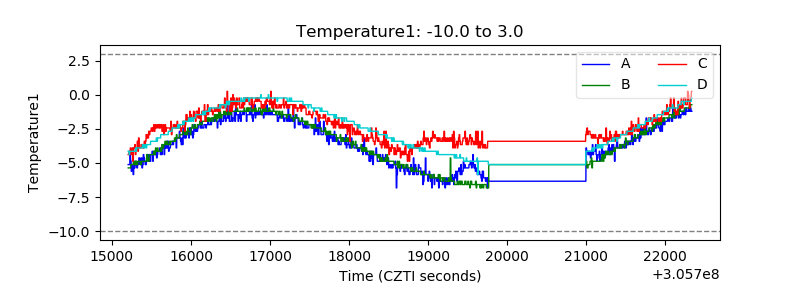 |
| Veto HV Monitor | 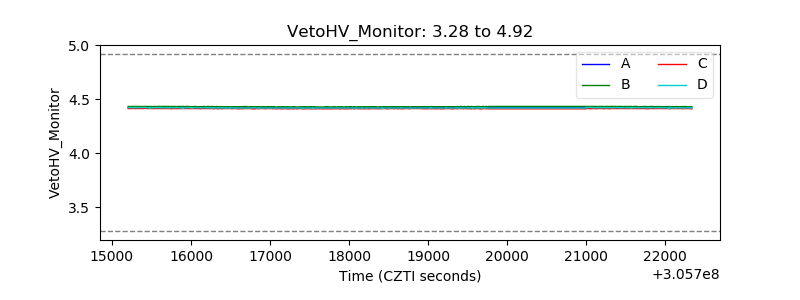 |
| Veto LLD | 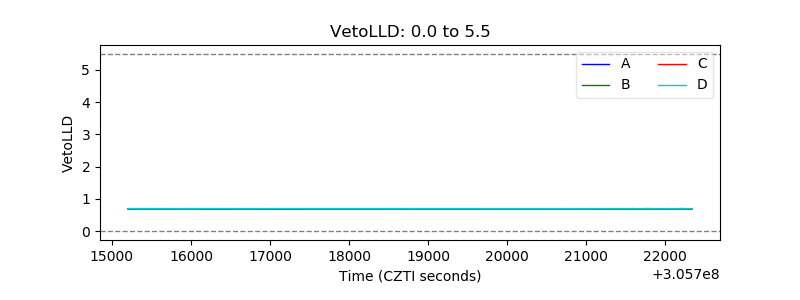 |
| Alpha Counter | 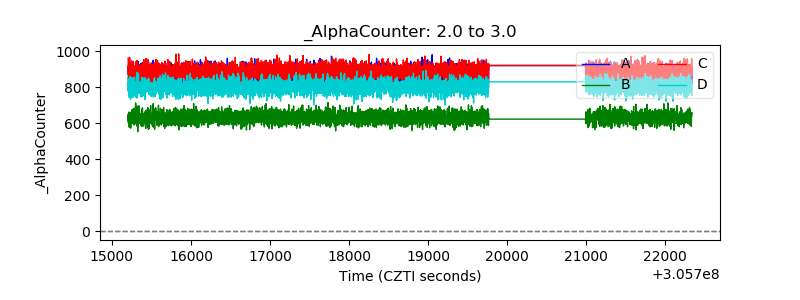 |
| _CPM_Rate | 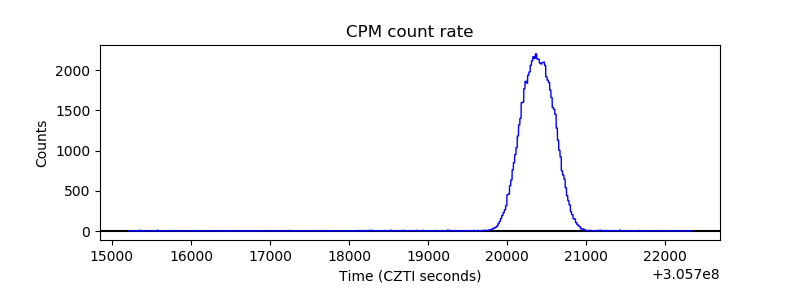 |
| CZT Counter | 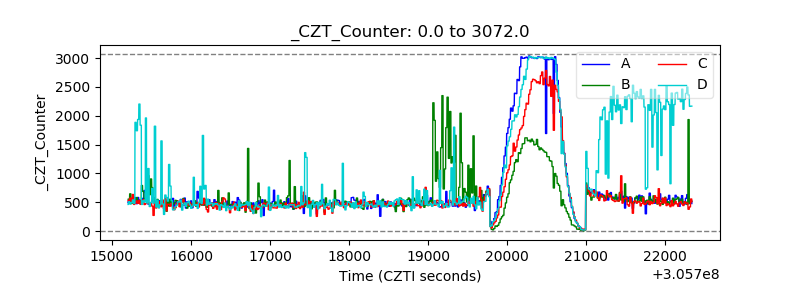 |
| +2.5 Volts monitor |  |
| +5 Volts monitor | 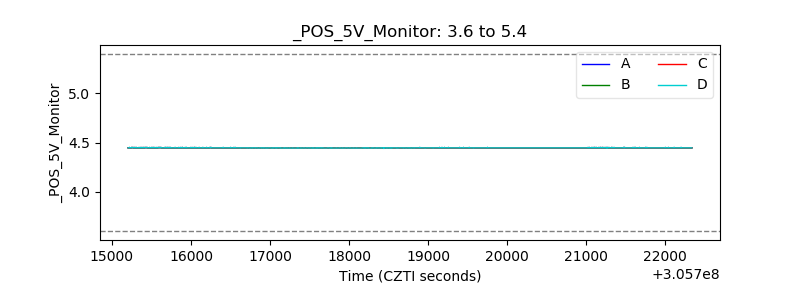 |
| _ROLL_ROT | 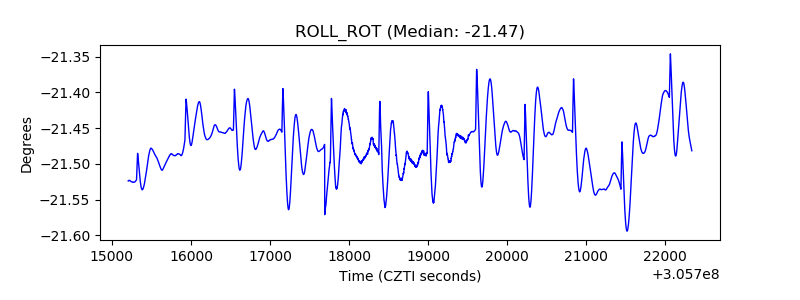 |
| _Roll_DEC | 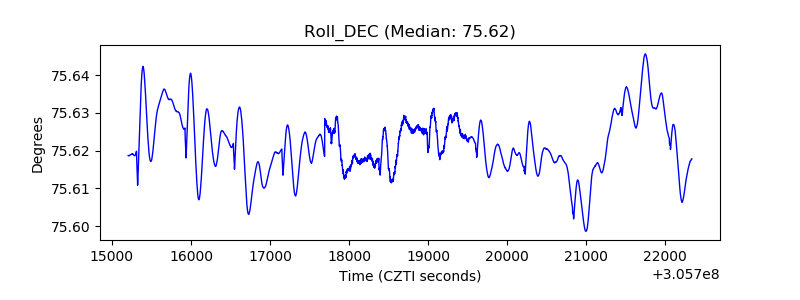 |
| _Roll_RA | 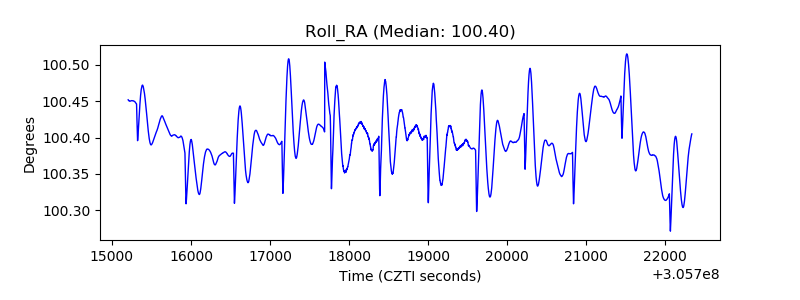 |
| Veto Counter | 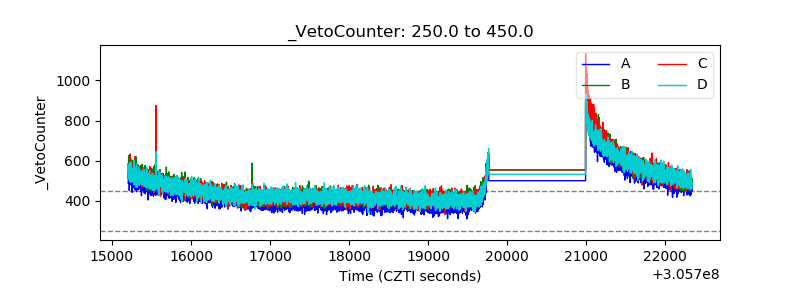 |