| Param | Original file | Final file |
|---|---|---|
| Filename | modeM0/AS1A05_226T05_9000003148_21349cztM0_level2.evt | modeM0/AS1A05_226T05_9000003148_21349cztM0_level2_quad_clean.evt |
| Size (bytes) | 305,256,960 | 60,243,840 |
| Size | 291.1 MB | 57.5 MB |
| Events in quadrant A | 1,602,047 | 445,456 |
| Events in quadrant B | 1,798,984 | 437,602 |
| Events in quadrant C | 1,447,433 | 414,074 |
| Events in quadrant D | 4,190,505 | 312,516 |
| Mode M0 | |||
|---|---|---|---|
| Quadrant | BADHDUFLAG | Total packets | Discarded packets |
| A | 0 | 6417 | 0 |
| B | 0 | 7130 | 0 |
| C | 0 | 6079 | 0 |
| D | 0 | 14473 | 0 |
| Mode SS | |||
|---|---|---|---|
| Quadrant | BADHDUFLAG | Total packets | Discarded packets |
| A | 0 | 60 | 0 |
| B | 0 | 60 | 0 |
| C | 0 | 60 | 0 |
| D | 0 | 60 | 0 |
| Quadrant | Total seconds | Saturated seconds | Saturation percentage |
|---|---|---|---|
| A | 3002 | 12 | 0.399734% |
| B | 3003 | 69 | 2.297702% |
| C | 3003 | 8 | 0.266400% |
| D | 3003 | 1376 | 45.820846% |
Noise dominated data is calculated using 1-second bins in cleaned event files. If a bin has >2000 counts, and if more than 50% of those come from <1% of pixels, then it is considered to be noise-dominated and hence unusable.
| Quadrant | # 1 sec bins | Bins with >0 counts | Bins with >2000 counts | High rate bins dominated by noise | Noise dominated (total time) | Noise dominated (detector-on time) | Marked lightcurve |
|---|---|---|---|---|---|---|---|
| A | 3002 | 3002 | 5 | 5 | 0.17% | 0.17% |  |
| B | 3003 | 3003 | 61 | 61 | 2.03% | 2.03% |  |
| C | 3003 | 3003 | 0 | 0 | 0.00% | 0.00% |  |
| D | 3003 | 3003 | 1257 | 1257 | 41.86% | 41.86% |  |
Top three noisy pixels from each quadrant. If the there are fewer than three noisy pixels in the level2.evt file, extra rows are filled as -1
| Pixel properties | Quadrant properties | ||||||
|---|---|---|---|---|---|---|---|
| Quadrant | DetID | PixID | Counts | Sigma | Mean | Median | Sigma |
| A | 5 | 168 | 60857 | 787.67 | 381 | 375 | 76.8 |
| A | 12 | 96 | 53494 | 691.78 | 381 | 375 | 76.8 |
| A | 11 | 47 | 10495 | 131.79 | 381 | 375 | 76.8 |
| B | 0 | 189 | 238523 | 3470.17 | 368 | 360 | 68.6 |
| B | 3 | 64 | 40461 | 584.29 | 368 | 360 | 68.6 |
| B | 0 | 190 | 21311 | 305.27 | 368 | 360 | 68.6 |
| C | 14 | 238 | 57774 | 698.65 | 354 | 357 | 82.2 |
| C | 13 | 61 | 2514 | 26.25 | 354 | 357 | 82.2 |
| C | 10 | 23 | 2472 | 25.74 | 354 | 357 | 82.2 |
| D | 13 | 174 | 2861664 | 41114.16 | 288 | 279 | 69.6 |
| D | 1 | 52 | 121821 | 1746.39 | 288 | 279 | 69.6 |
| D | 12 | 235 | 35288 | 503.03 | 288 | 279 | 69.6 |
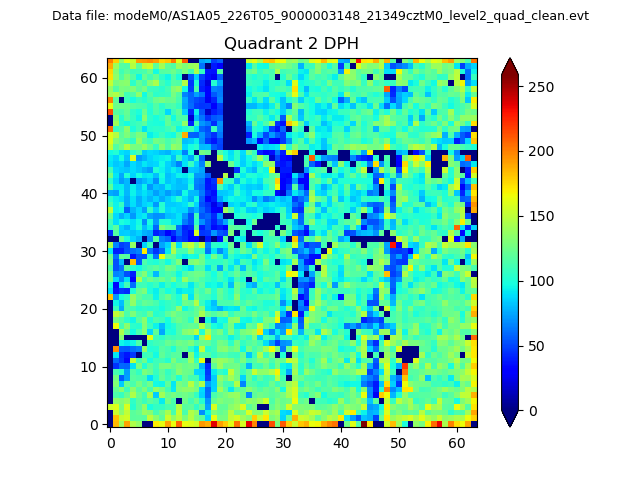
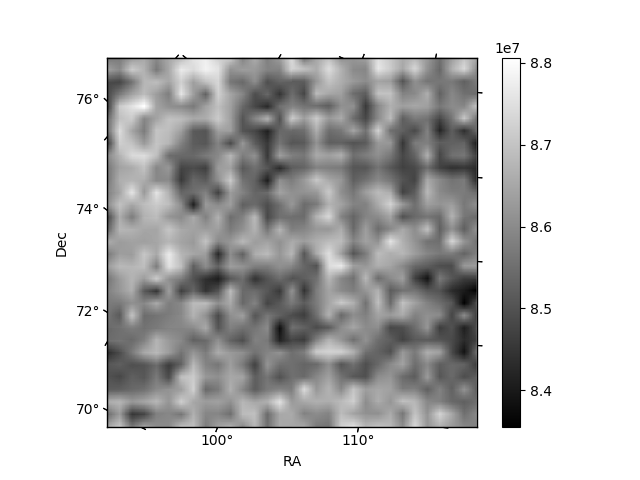
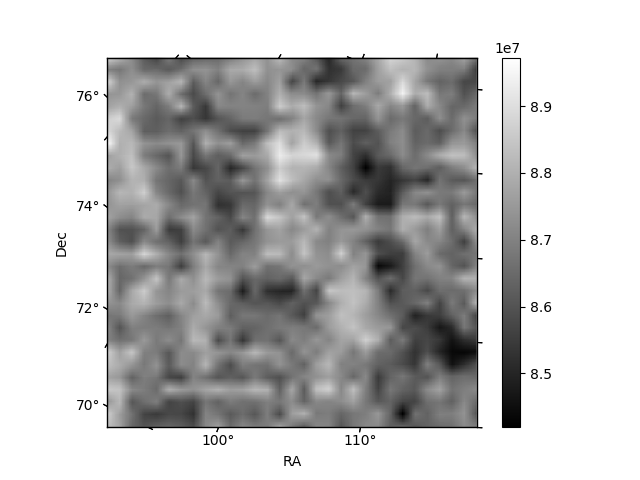
Histogram calculated using DETX and DETY for each event in the final _common_clean file
| Quadrant A | 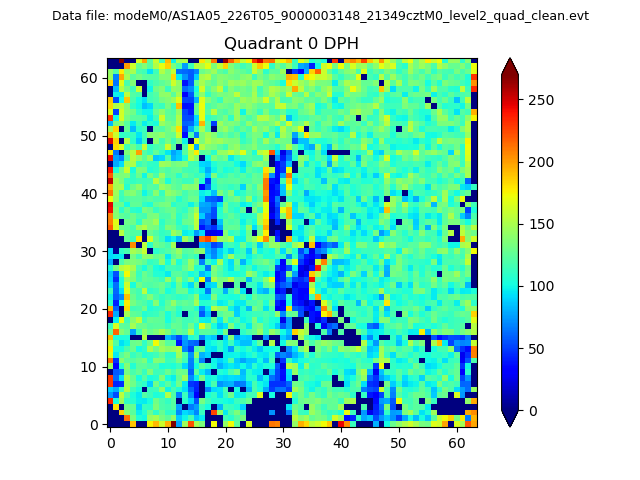 |
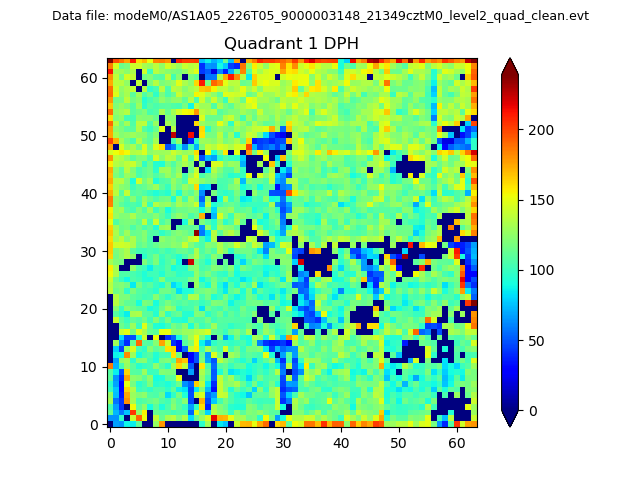 |
Quadrant B |
|---|---|---|---|
| Quadrant D | 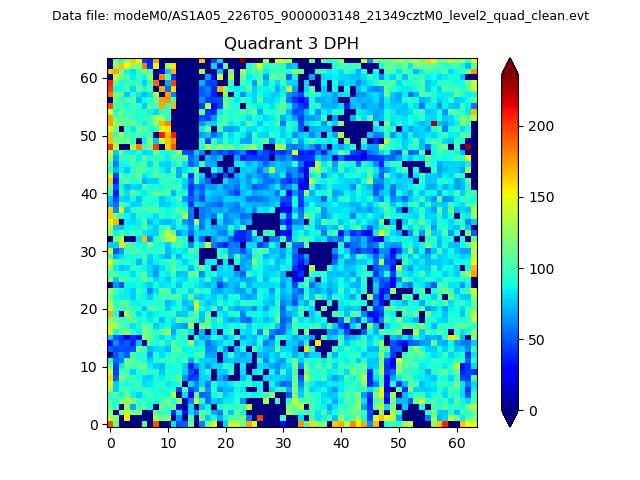 |
 |
Quadrant C |
| Plot type | Count rate plots | Images |
|---|---|---|
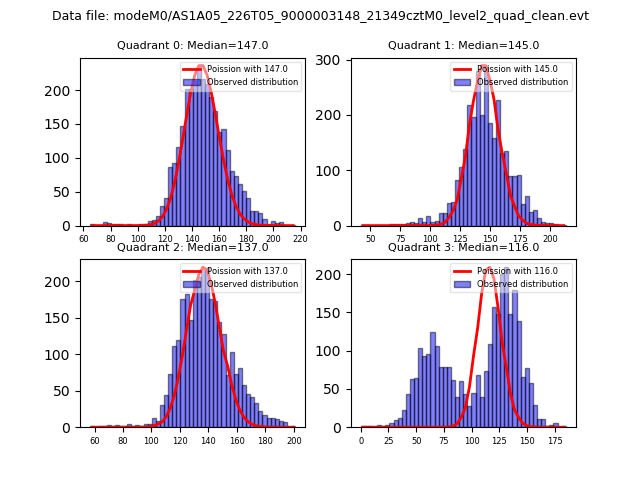
| Comparison with Poisson distribution Blue bars denote a histogram of data divided into 1 sec bins. Red curve is a Poisson curve with rate = median count rate of data. |
 |
 |
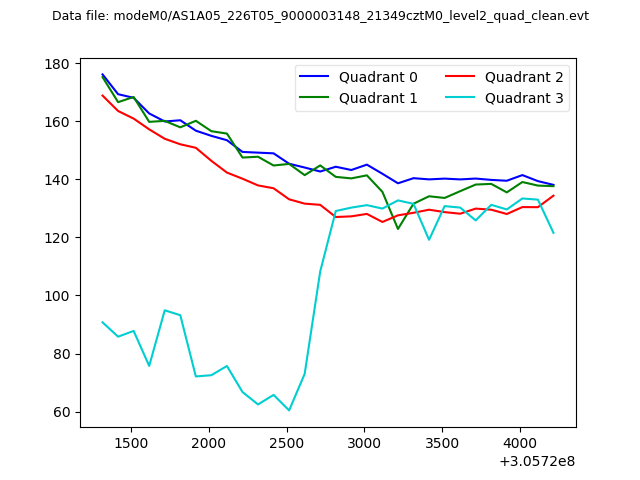
| Quadrant-wise count rates Data is divided into 100 sec bins |
 |
|
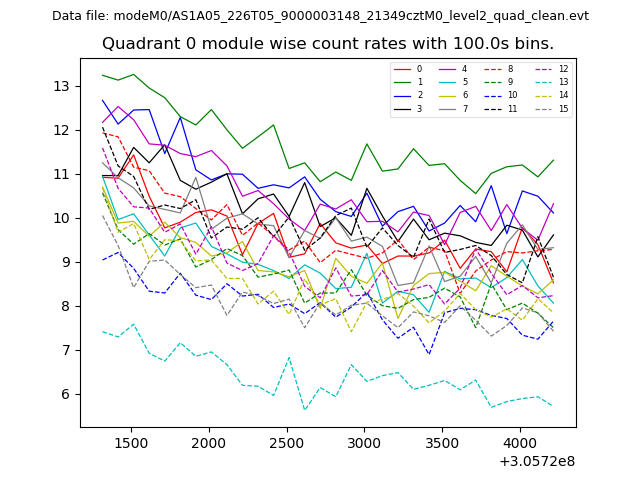
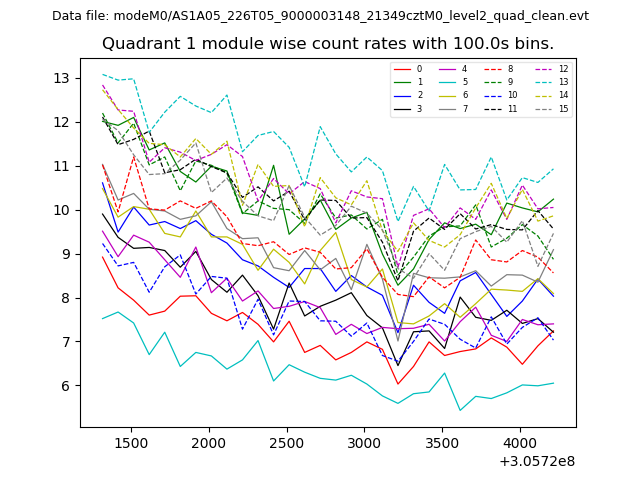
| Module-wise count rates for Quadrant A Data is divided into 100 sec bins |
 |
 |
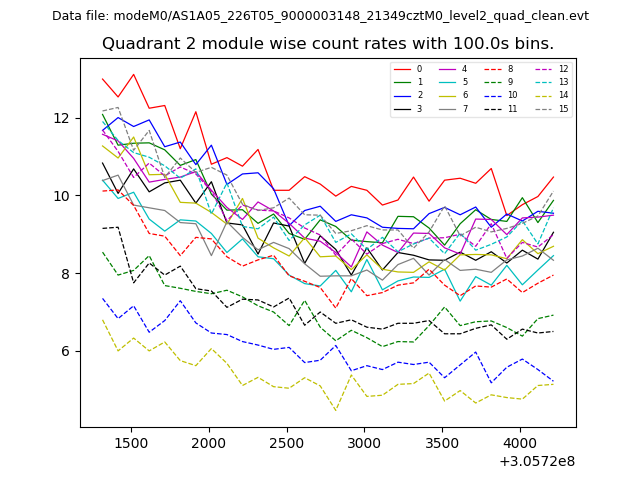
| Module-wise count rates for Quadrant B Data is divided into 100 sec bins |
 |
 |
| Module-wise count rates for Quadrant C Data is divided into 100 sec bins |
 |
 |
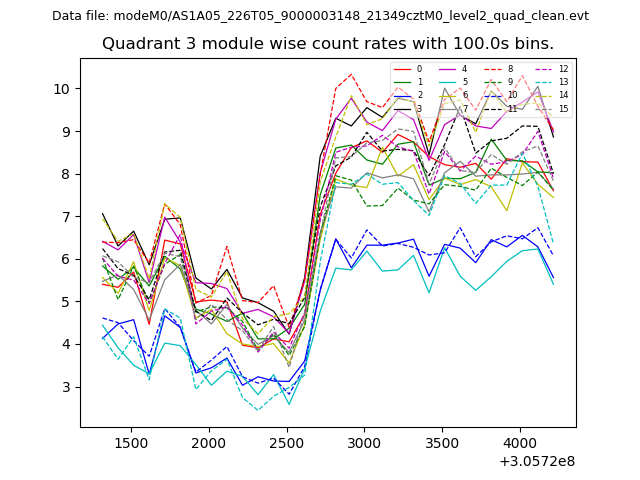
| Module-wise count rates for Quadrant D Data is divided into 100 sec bins |
 |
 |
| Parameter | Plot |
|---|---|
| CZT HV Monitor | 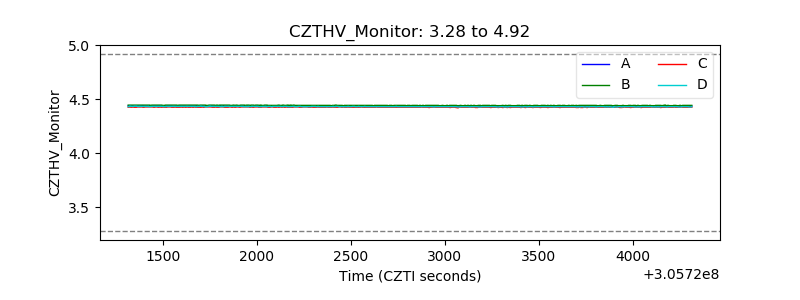 |
| D_VDD | 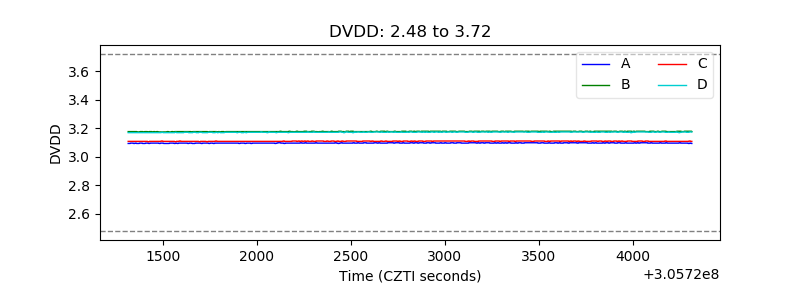 |
| Temperature 1 | 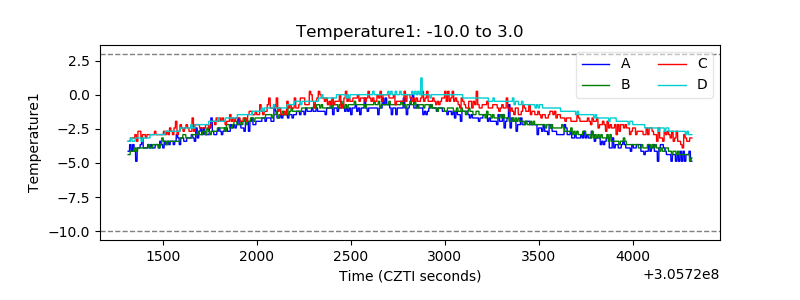 |
| Veto HV Monitor | 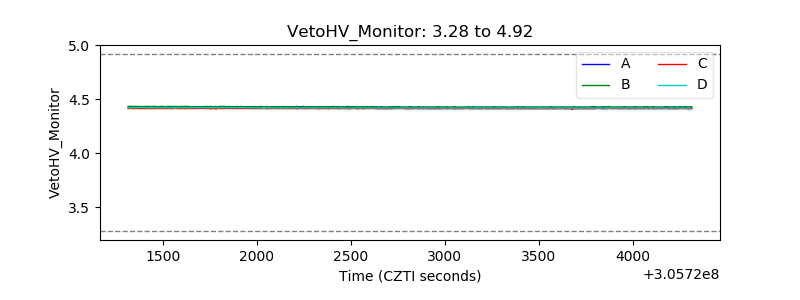 |
| Veto LLD | 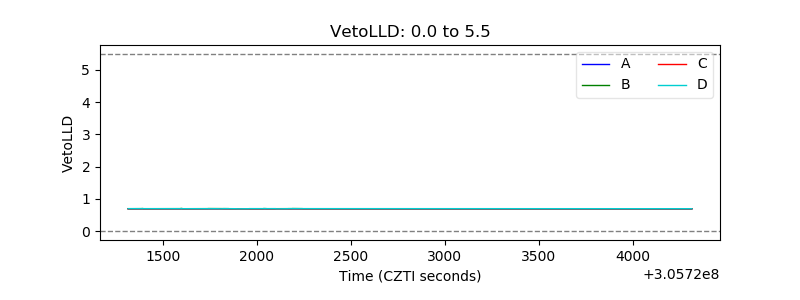 |
| Alpha Counter | 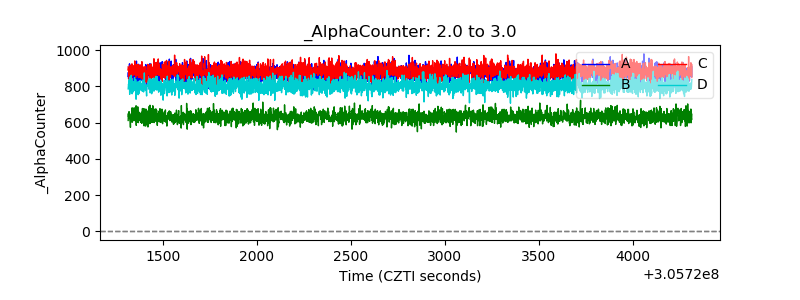 |
| _CPM_Rate | 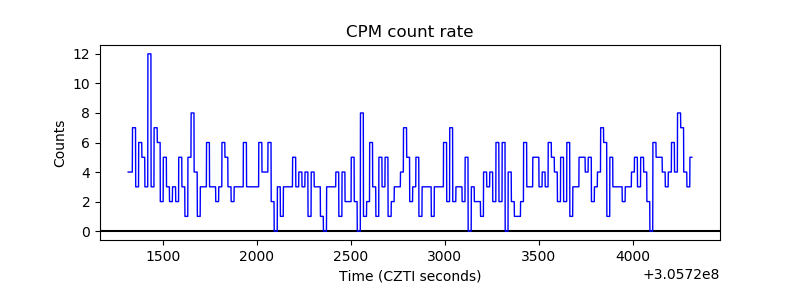 |
| CZT Counter | 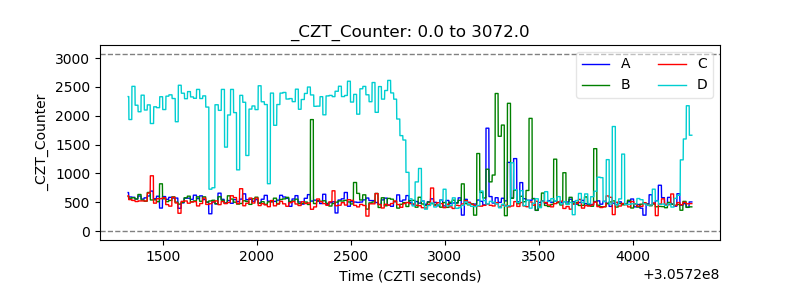 |
| +2.5 Volts monitor |  |
| +5 Volts monitor |  |
| _ROLL_ROT | 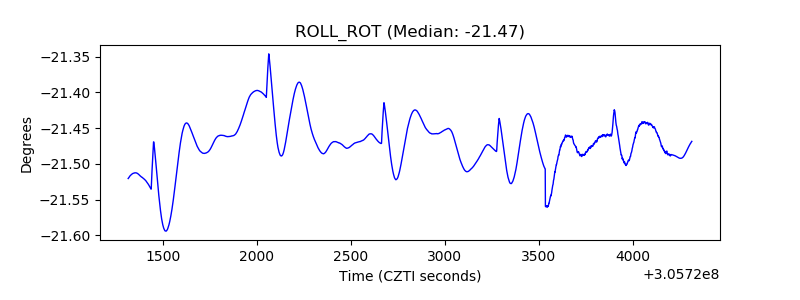 |
| _Roll_DEC | 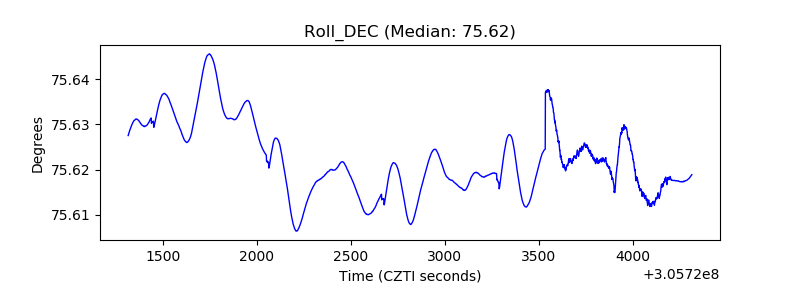 |
| _Roll_RA | 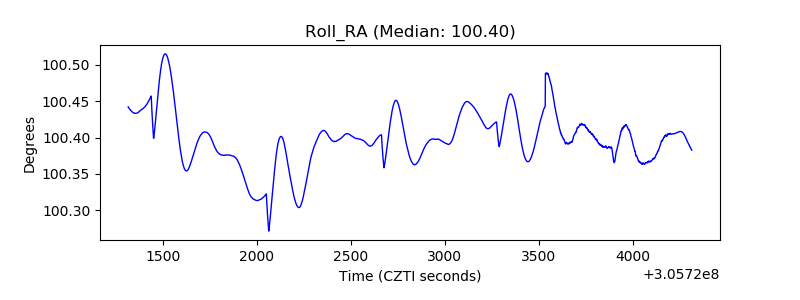 |
| Veto Counter | 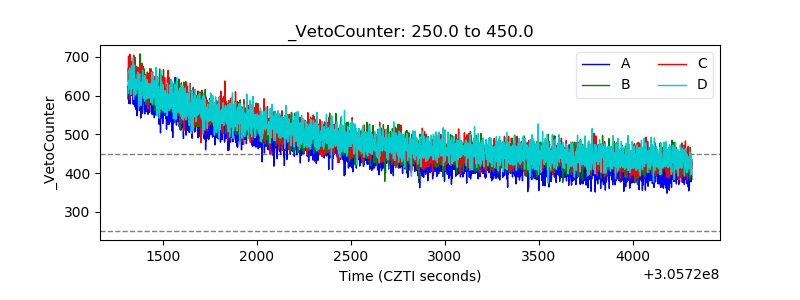 |