| Param | Original file | Final file |
|---|---|---|
| Filename | modeM0/AS1A06_009T02_9000003152cztM0_level2.fits | modeM0/AS1A06_009T02_9000003152cztM0_level2_quad_clean.evt |
| Size (bytes) | 79,876,800 | 46,071,360 |
| Size | 76.2 MB | 43.9 MB |
| Events in quadrant A | 512,768 | 231,118 |
| Events in quadrant B | 482,712 | 228,175 |
| Events in quadrant C | 480,278 | 216,804 |
| Events in quadrant D | 430,176 | 204,493 |
| Mode SS | |||
|---|---|---|---|
| Quadrant | BADHDUFLAG | Total packets | Discarded packets |
| A | 0 | 150 | 0 |
| B | 0 | 150 | 0 |
| C | 0 | 150 | 0 |
| D | 0 | 150 | 0 |
| Mode M9 | |||
|---|---|---|---|
| Quadrant | BADHDUFLAG | Total packets | Discarded packets |
| A | 0 | 23 | 0 |
| B | 0 | 23 | 0 |
| C | 0 | 23 | 0 |
| D | 0 | 23 | 0 |
| Mode M0 | |||
|---|---|---|---|
| Quadrant | BADHDUFLAG | Total packets | Discarded packets |
| A | 0 | 16343 | 0 |
| B | 0 | 16614 | 0 |
| C | 0 | 18851 | 0 |
| D | 0 | 20037 | 0 |
| Quadrant | Total seconds | Saturated seconds | Saturation percentage |
|---|---|---|---|
| A | 7375 | 76 | 1.030508% |
| B | 7375 | 96 | 1.301695% |
| C | 7375 | 127 | 1.722034% |
| D | 7375 | 146 | 1.979661% |
Noise dominated data is calculated using 1-second bins in cleaned event files. If a bin has >2000 counts, and if more than 50% of those come from <1% of pixels, then it is considered to be noise-dominated and hence unusable.
| Quadrant | # 1 sec bins | Bins with >0 counts | Bins with >2000 counts | High rate bins dominated by noise | Noise dominated (total time) | Noise dominated (detector-on time) | Marked lightcurve |
|---|---|---|---|---|---|---|---|
| A | 8684 | 7373 | 0 | 0 | 0.00% | 0.00% | 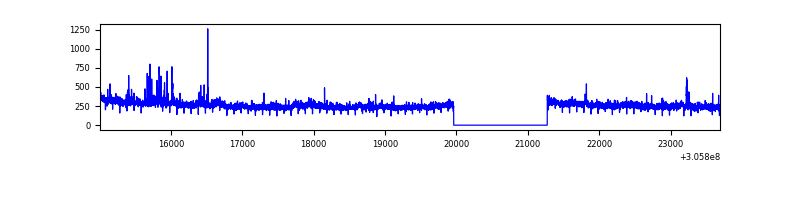 |
| B | 8684 | 7373 | 0 | 0 | 0.00% | 0.00% |  |
| C | 8684 | 7374 | 0 | 0 | 0.00% | 0.00% |  |
| D | 8684 | 7374 | 0 | 0 | 0.00% | 0.00% | 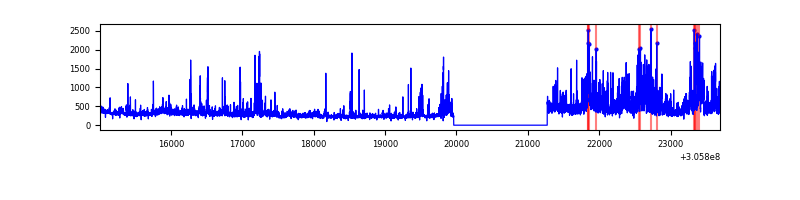 |
Top three noisy pixels from each quadrant. If the there are fewer than three noisy pixels in the level2.evt file, extra rows are filled as -1
| Pixel properties | Quadrant properties | ||||||
|---|---|---|---|---|---|---|---|
| Quadrant | DetID | PixID | Counts | Sigma | Mean | Median | Sigma |
| A | 0 | 29 | 508 | 11.3 | 133 | 127 | 33.7 |
| A | 7 | 110 | 440 | 9.29 | 133 | 127 | 33.7 |
| A | 0 | 30 | 396 | 7.98 | 133 | 127 | 33.7 |
| B | 2 | 9 | 343 | 8.24 | 128 | 124 | 26.6 |
| B | 2 | 8 | 324 | 7.52 | 128 | 124 | 26.6 |
| B | 5 | 255 | 316 | 7.22 | 128 | 124 | 26.6 |
| C | 1 | 80 | 367 | 7.33 | 126 | 120 | 33.7 |
| C | 1 | 81 | 349 | 6.79 | 126 | 120 | 33.7 |
| C | 9 | 209 | 344 | 6.65 | 126 | 120 | 33.7 |
| D | 4 | 246 | 350 | 7.0 | 122 | 112 | 34.0 |
| D | 7 | 3 | 322 | 6.18 | 122 | 112 | 34.0 |
| D | 6 | 83 | 319 | 6.09 | 122 | 112 | 34.0 |
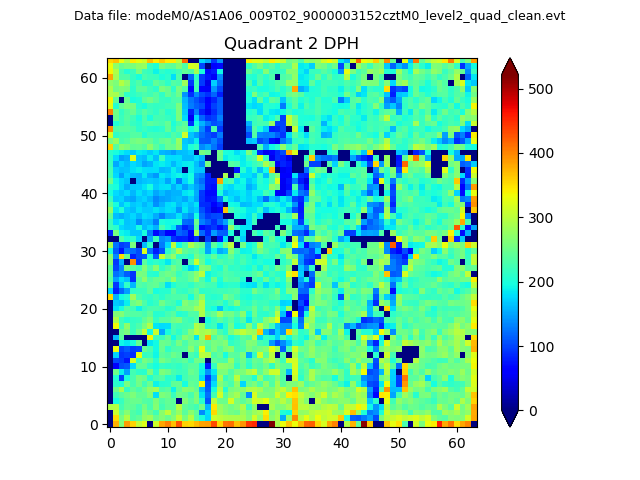
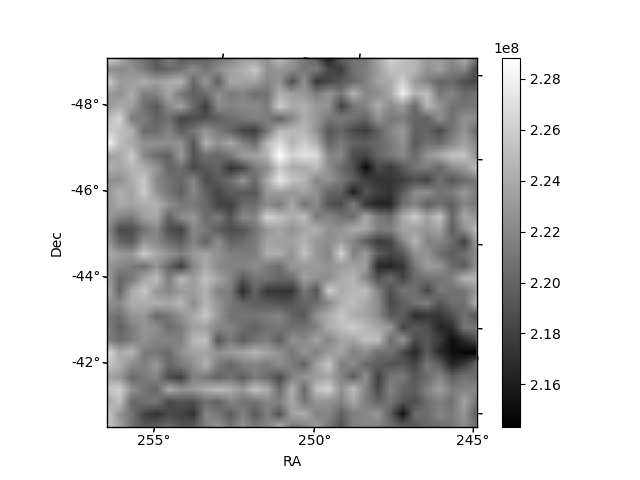
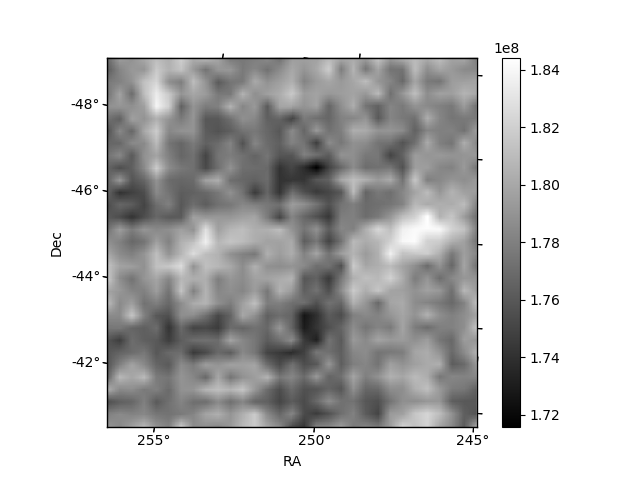
Histogram calculated using DETX and DETY for each event in the final _common_clean file
| Quadrant A |  |
 |
Quadrant B |
|---|---|---|---|
| Quadrant D | 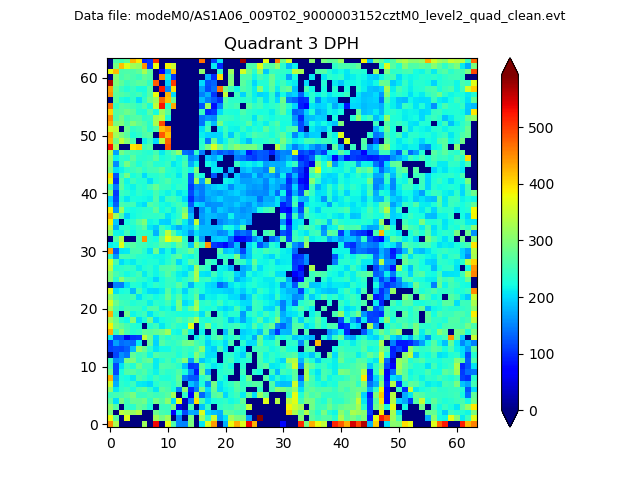 |
 |
Quadrant C |
| Plot type | Count rate plots | Images |
|---|---|---|
| Comparison with Poisson distribution Blue bars denote a histogram of data divided into 1 sec bins. Red curve is a Poisson curve with rate = median count rate of data. |
 |
 |
| Quadrant-wise count rates Data is divided into 100 sec bins |
 |
|
| Module-wise count rates for Quadrant A Data is divided into 100 sec bins |
 |
 |
| Module-wise count rates for Quadrant B Data is divided into 100 sec bins |
 |
 |
| Module-wise count rates for Quadrant C Data is divided into 100 sec bins |
 |
 |
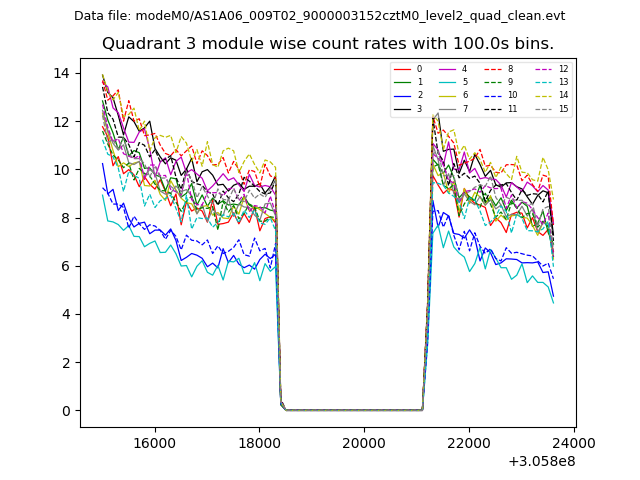
| Module-wise count rates for Quadrant D Data is divided into 100 sec bins |
 |
 |
| Parameter | Plot |
|---|---|
| CZT HV Monitor | 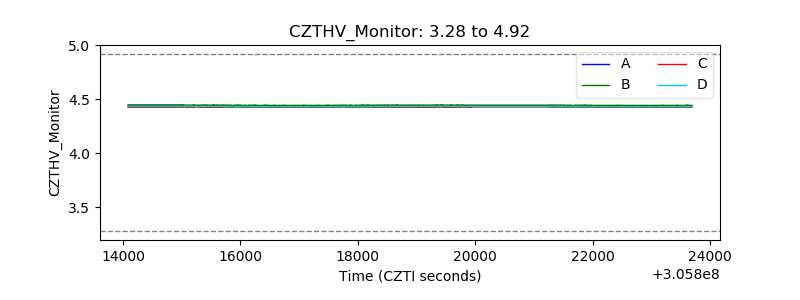 |
| D_VDD | 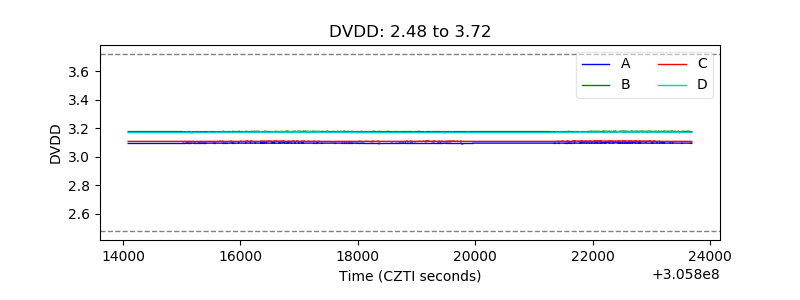 |
| Temperature 1 |  |
| Veto HV Monitor | 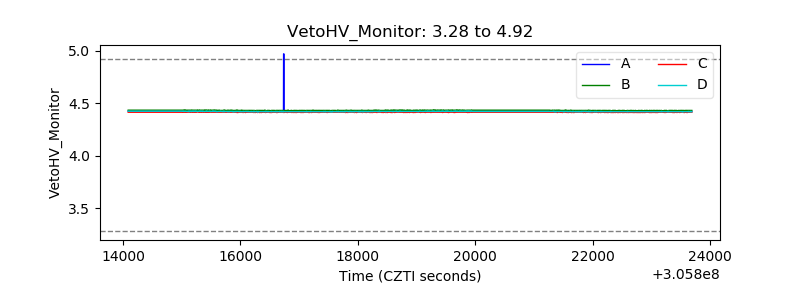 |
| Veto LLD |  |
| Alpha Counter |  |
| _CPM_Rate |  |
| CZT Counter |  |
| +2.5 Volts monitor | 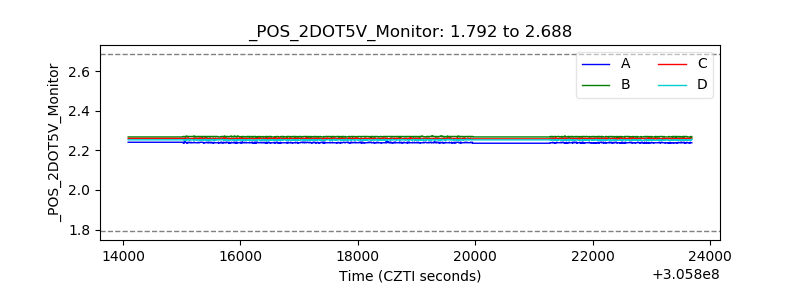 |
| +5 Volts monitor |  |
| _ROLL_ROT | 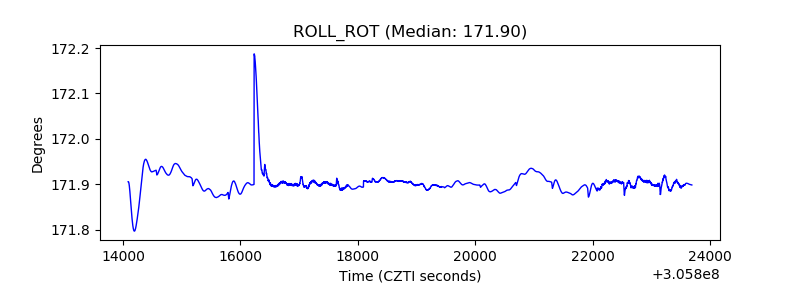 |
| _Roll_DEC | 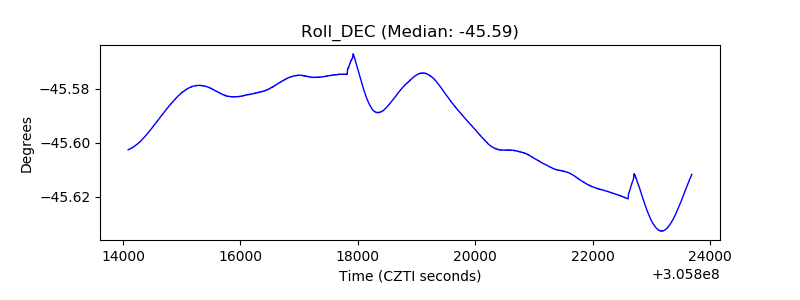 |
| _Roll_RA |  |
| Veto Counter | 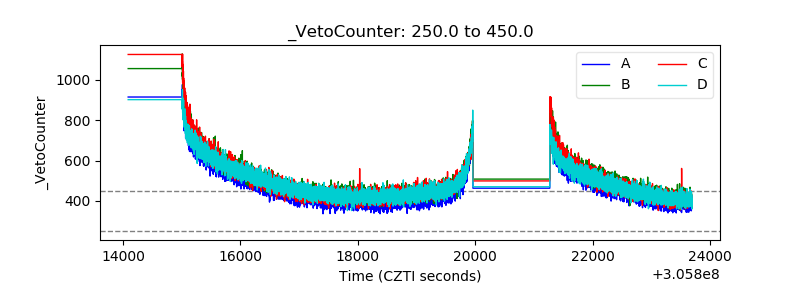 |