| Param | Original file | Final file |
|---|---|---|
| Filename | modeM0/AS1A06_009T02_9000003152_21365cztM0_level2.evt | modeM0/AS1A06_009T02_9000003152_21365cztM0_level2_quad_clean.evt |
| Size (bytes) | 488,053,440 | 103,838,400 |
| Size | 465.4 MB | 99.0 MB |
| Events in quadrant A | 3,278,657 | 700,728 |
| Events in quadrant B | 3,331,734 | 697,844 |
| Events in quadrant C | 3,713,711 | 663,071 |
| Events in quadrant D | 4,042,284 | 656,467 |
| Mode SS | |||
|---|---|---|---|
| Quadrant | BADHDUFLAG | Total packets | Discarded packets |
| A | 0 | 124 | 0 |
| B | 0 | 124 | 0 |
| C | 0 | 124 | 0 |
| D | 0 | 124 | 0 |
| Mode M9 | |||
|---|---|---|---|
| Quadrant | BADHDUFLAG | Total packets | Discarded packets |
| A | 0 | 13 | 0 |
| B | 0 | 13 | 0 |
| C | 0 | 13 | 0 |
| D | 0 | 13 | 0 |
| Mode M0 | |||
|---|---|---|---|
| Quadrant | BADHDUFLAG | Total packets | Discarded packets |
| A | 0 | 13465 | 1 |
| B | 0 | 13743 | 1 |
| C | 0 | 15190 | 1 |
| D | 0 | 16152 | 1 |
| Quadrant | Total seconds | Saturated seconds | Saturation percentage |
|---|---|---|---|
| A | 6111 | 68 | 1.112748% |
| B | 6112 | 83 | 1.357984% |
| C | 6112 | 95 | 1.554319% |
| D | 6112 | 135 | 2.208770% |
Noise dominated data is calculated using 1-second bins in cleaned event files. If a bin has >2000 counts, and if more than 50% of those come from <1% of pixels, then it is considered to be noise-dominated and hence unusable.
| Quadrant | # 1 sec bins | Bins with >0 counts | Bins with >2000 counts | High rate bins dominated by noise | Noise dominated (total time) | Noise dominated (detector-on time) | Marked lightcurve |
|---|---|---|---|---|---|---|---|
| A | 7421 | 6111 | 2 | 2 | 0.03% | 0.03% | 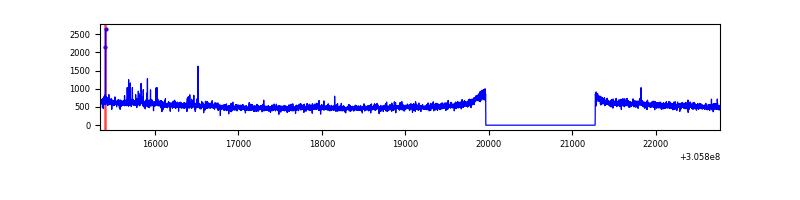 |
| B | 7422 | 6112 | 17 | 17 | 0.23% | 0.28% | 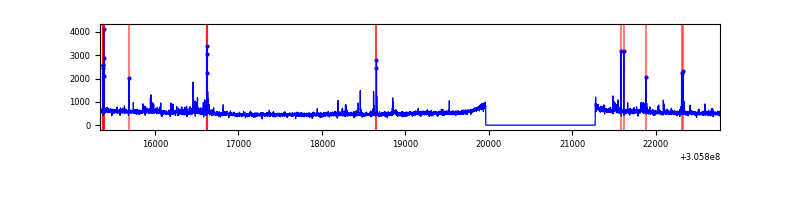 |
| C | 7422 | 6113 | 2 | 2 | 0.03% | 0.03% | 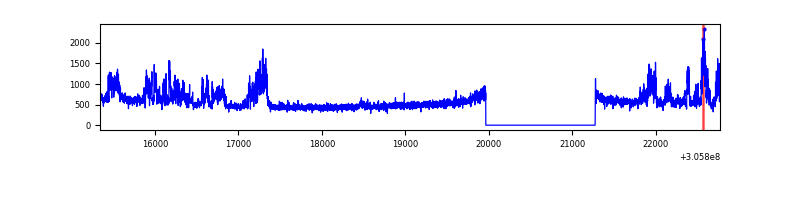 |
| D | 7422 | 6113 | 62 | 62 | 0.84% | 1.01% | 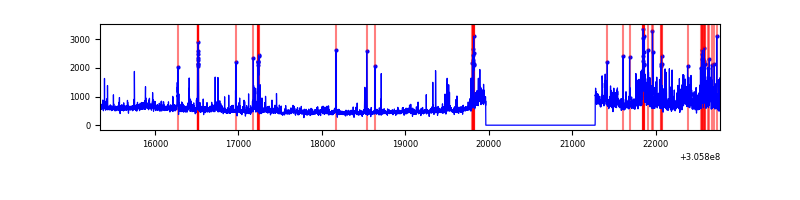 |
Top three noisy pixels from each quadrant. If the there are fewer than three noisy pixels in the level2.evt file, extra rows are filled as -1
| Pixel properties | Quadrant properties | ||||||
|---|---|---|---|---|---|---|---|
| Quadrant | DetID | PixID | Counts | Sigma | Mean | Median | Sigma |
| A | 5 | 168 | 123448 | 758.21 | 807 | 792 | 161.8 |
| A | 12 | 96 | 36547 | 221.02 | 807 | 792 | 161.8 |
| A | 13 | 254 | 9792 | 55.63 | 807 | 792 | 161.8 |
| B | 0 | 190 | 61104 | 405.24 | 792 | 776 | 148.9 |
| B | 0 | 230 | 55948 | 370.61 | 792 | 776 | 148.9 |
| B | 3 | 64 | 39970 | 263.28 | 792 | 776 | 148.9 |
| C | 3 | 233 | 672682 | 3907.03 | 749 | 753 | 172.0 |
| C | 14 | 238 | 121243 | 700.61 | 749 | 753 | 172.0 |
| C | 13 | 61 | 5264 | 26.23 | 749 | 753 | 172.0 |
| D | 12 | 235 | 783028 | 4208.21 | 770 | 748 | 185.9 |
| D | 7 | 38 | 116421 | 622.25 | 770 | 748 | 185.9 |
| D | 1 | 52 | 94605 | 504.9 | 770 | 748 | 185.9 |
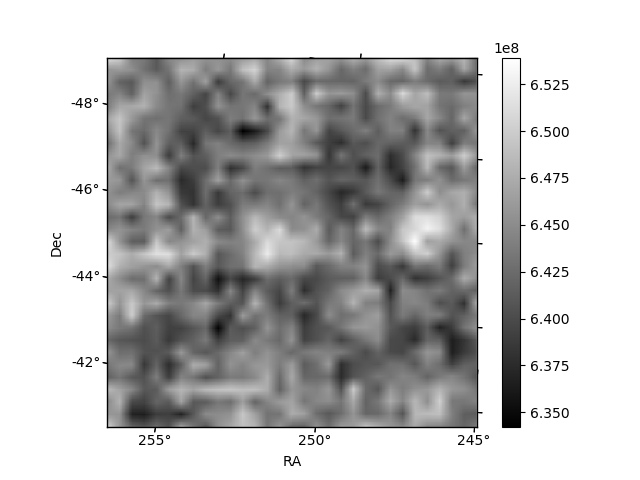
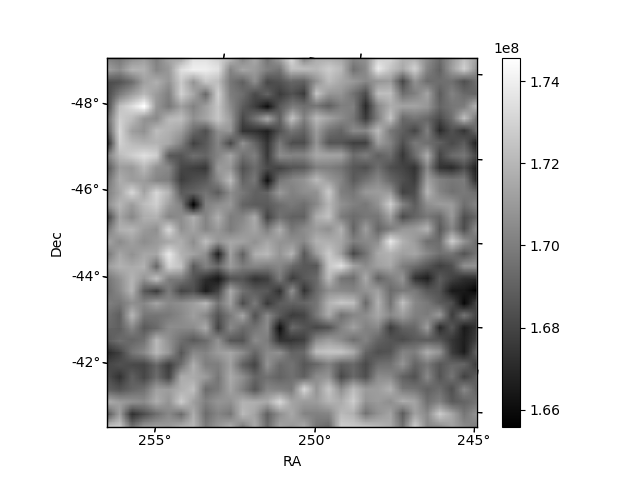
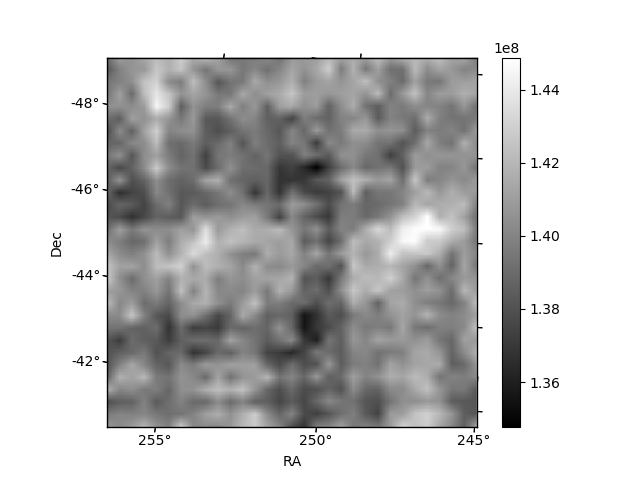
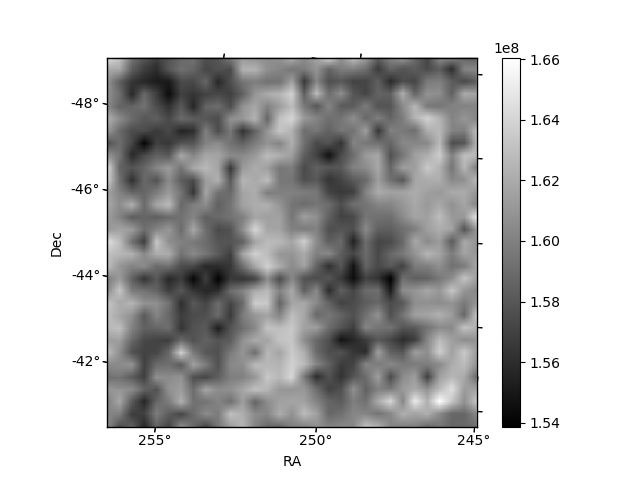
Histogram calculated using DETX and DETY for each event in the final _common_clean file
| Quadrant A | 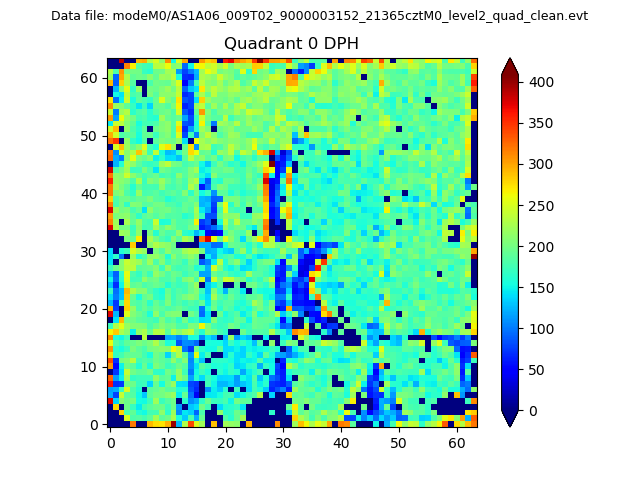 |
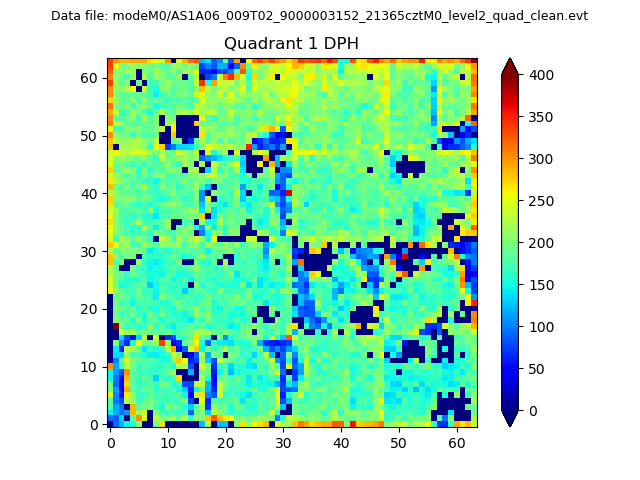 |
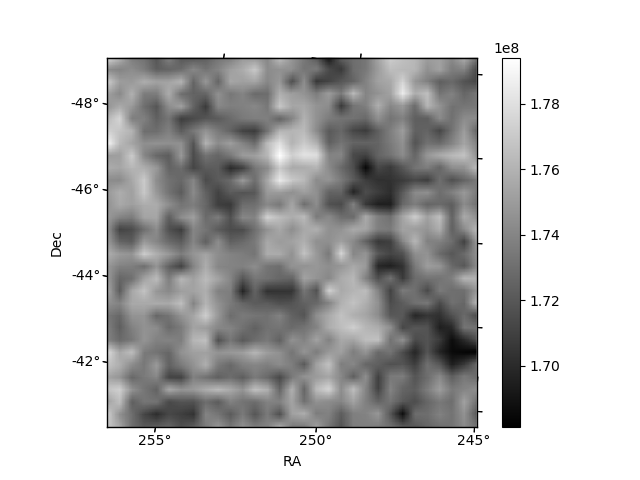
Quadrant B |
|---|---|---|---|
| Quadrant D | 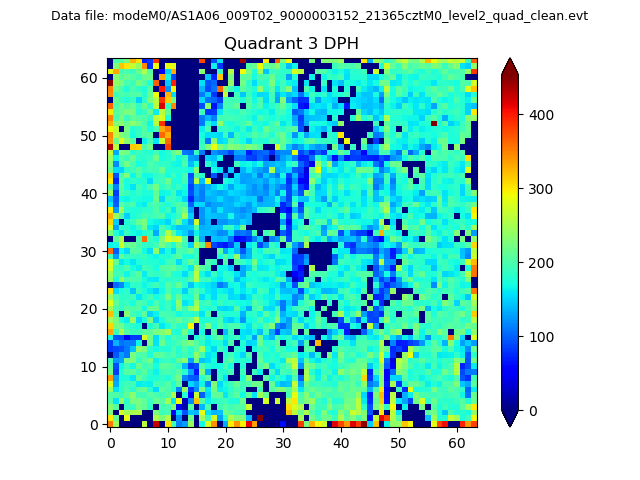 |
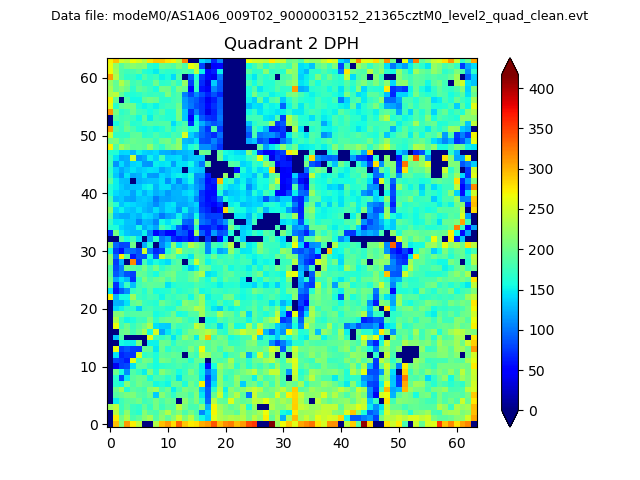 |
Quadrant C |
| Plot type | Count rate plots | Images |
|---|---|---|
| Comparison with Poisson distribution Blue bars denote a histogram of data divided into 1 sec bins. Red curve is a Poisson curve with rate = median count rate of data. |
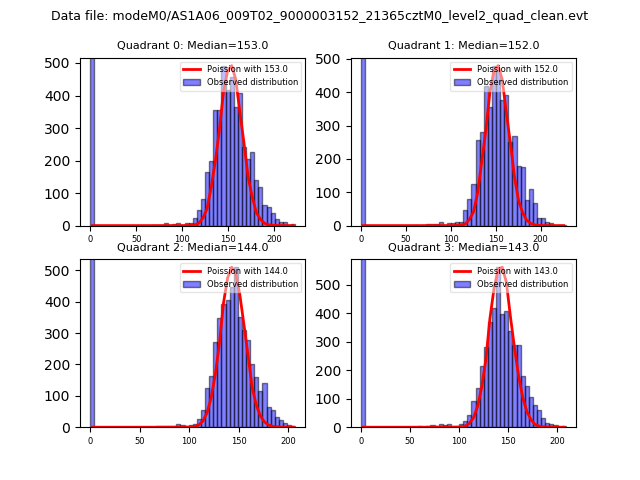 |
 |
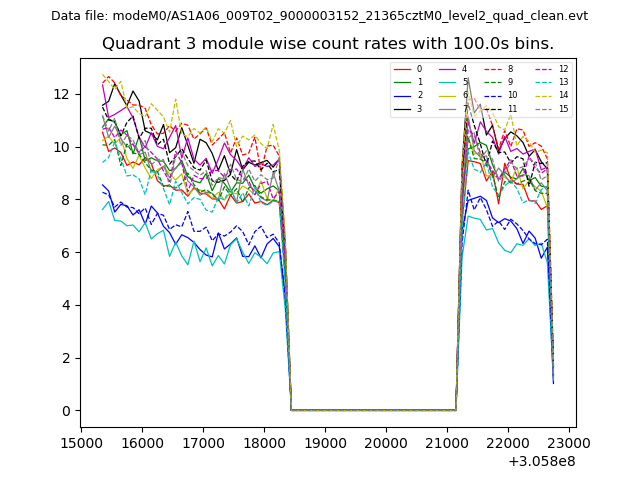
| Quadrant-wise count rates Data is divided into 100 sec bins |
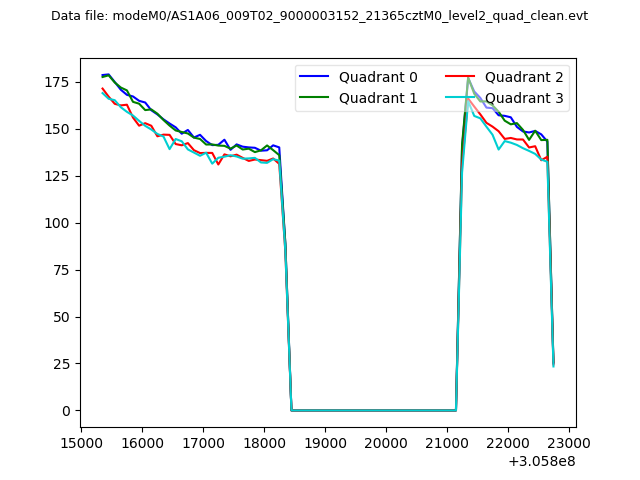 |
|
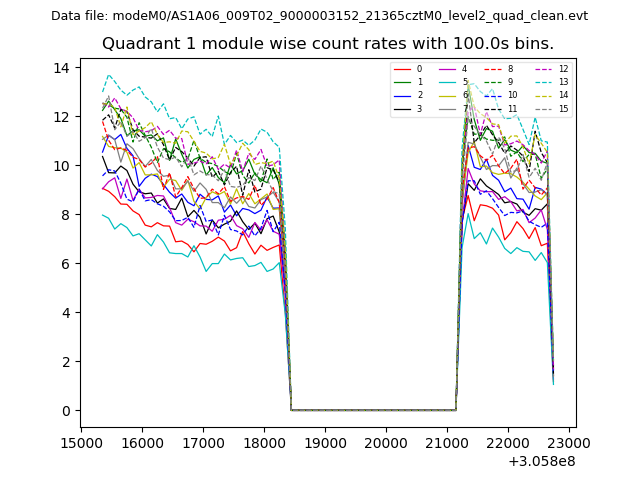
| Module-wise count rates for Quadrant A Data is divided into 100 sec bins |
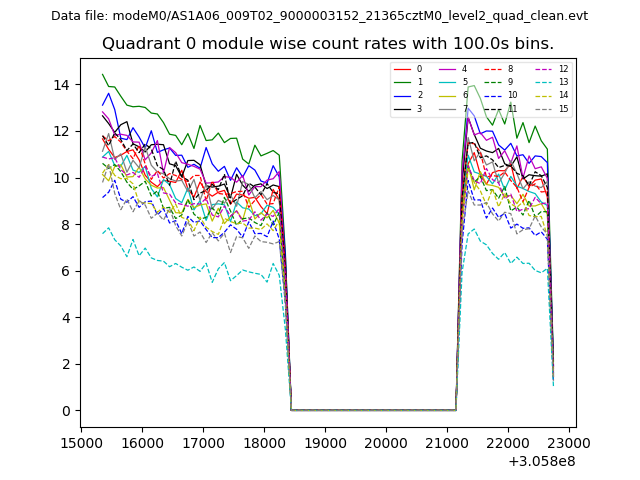 |
 |
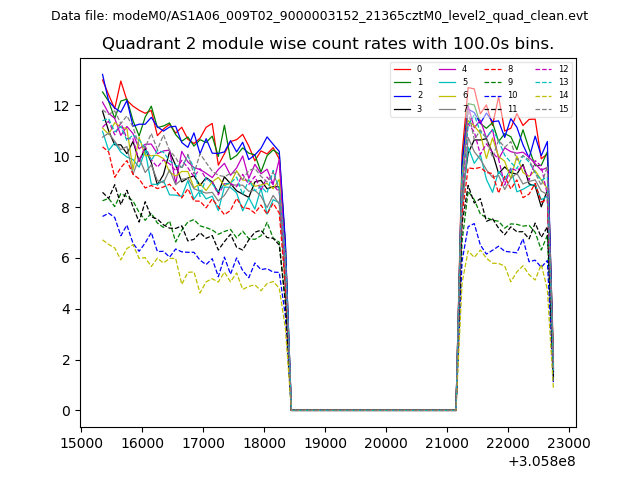
| Module-wise count rates for Quadrant B Data is divided into 100 sec bins |
 |
 |
| Module-wise count rates for Quadrant C Data is divided into 100 sec bins |
 |
 |
| Module-wise count rates for Quadrant D Data is divided into 100 sec bins |
 |
 |
| Parameter | Plot |
|---|---|
| CZT HV Monitor | 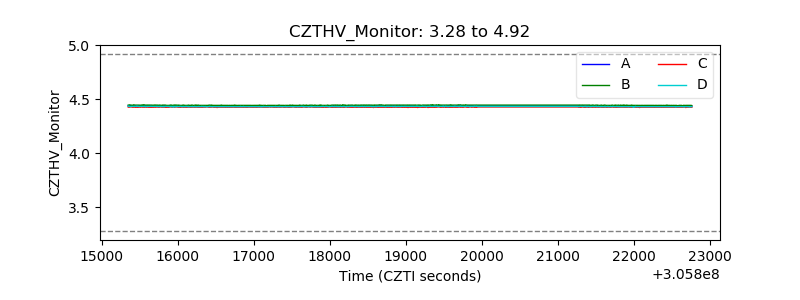 |
| D_VDD | 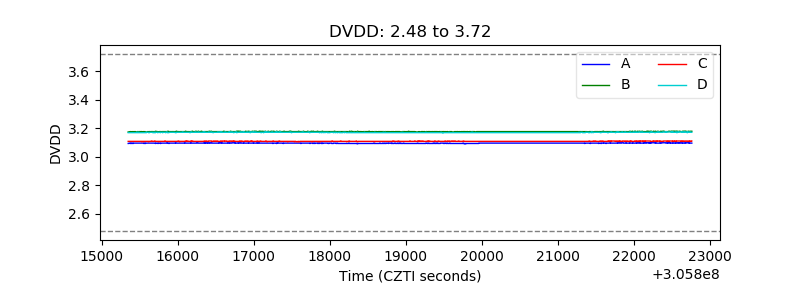 |
| Temperature 1 | 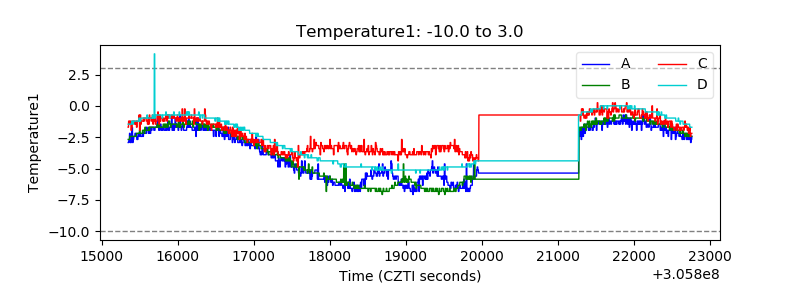 |
| Veto HV Monitor | 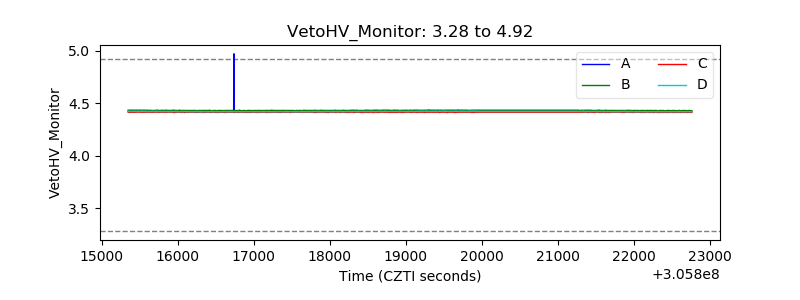 |
| Veto LLD | 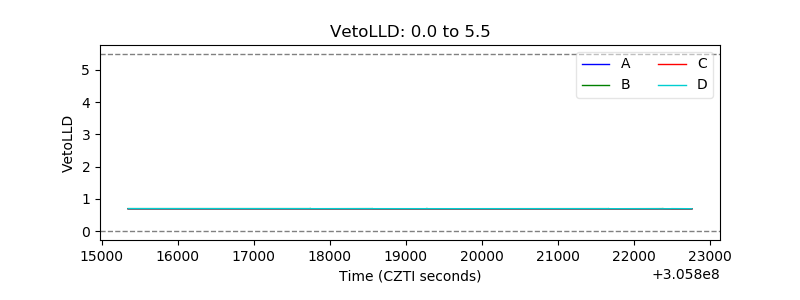 |
| Alpha Counter | 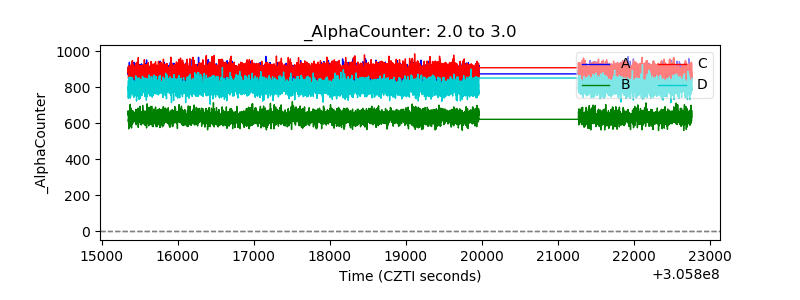 |
| _CPM_Rate | 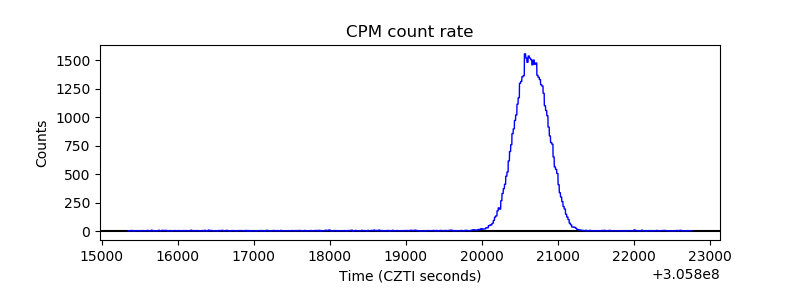 |
| CZT Counter | 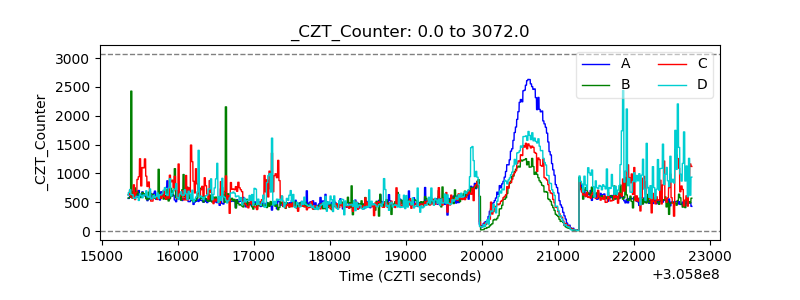 |
| +2.5 Volts monitor |  |
| +5 Volts monitor |  |
| _ROLL_ROT | 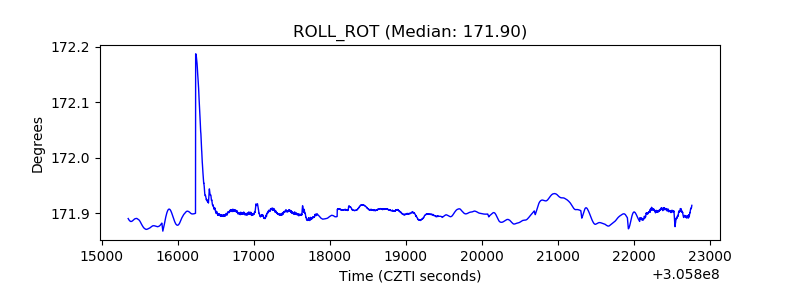 |
| _Roll_DEC | 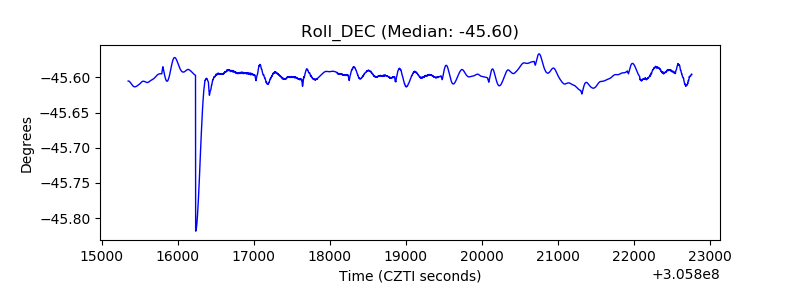 |
| _Roll_RA | 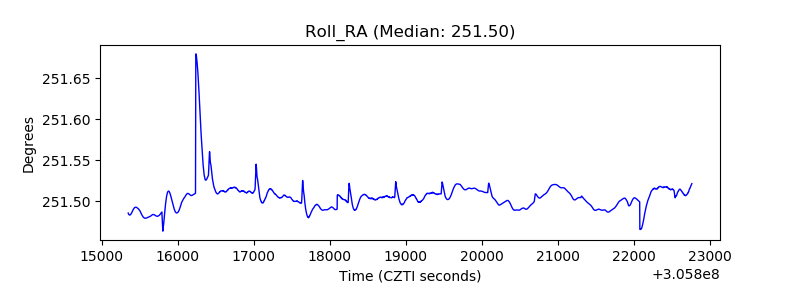 |
| Veto Counter | 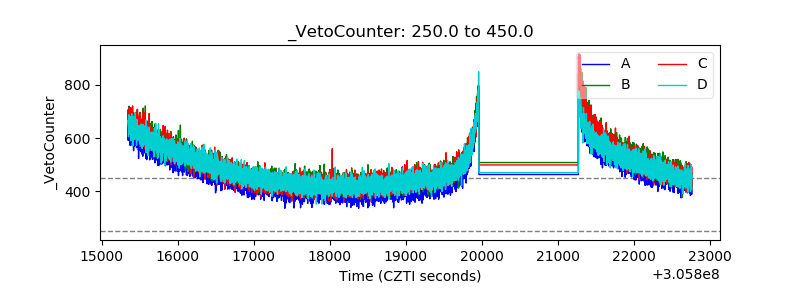 |