| Param | Original file | Final file |
|---|---|---|
| Filename | modeM0/AS1A06_009T02_9000003152_21366cztM0_level2.evt | modeM0/AS1A06_009T02_9000003152_21366cztM0_level2_quad_clean.evt |
| Size (bytes) | 190,912,320 | 45,201,600 |
| Size | 182.1 MB | 43.1 MB |
| Events in quadrant A | 1,099,814 | 312,817 |
| Events in quadrant B | 1,113,211 | 312,905 |
| Events in quadrant C | 1,520,688 | 294,950 |
| Events in quadrant D | 1,900,143 | 292,343 |
| Mode SS | |||
|---|---|---|---|
| Quadrant | BADHDUFLAG | Total packets | Discarded packets |
| A | 0 | 44 | 0 |
| B | 0 | 44 | 0 |
| C | 0 | 44 | 0 |
| D | 0 | 44 | 0 |
| Mode M0 | |||
|---|---|---|---|
| Quadrant | BADHDUFLAG | Total packets | Discarded packets |
| A | 0 | 4533 | 0 |
| B | 0 | 4655 | 0 |
| C | 0 | 5984 | 0 |
| D | 0 | 7206 | 0 |
| Quadrant | Total seconds | Saturated seconds | Saturation percentage |
|---|---|---|---|
| A | 2145 | 1 | 0.046620% |
| B | 2146 | 6 | 0.279590% |
| C | 2146 | 19 | 0.885368% |
| D | 2146 | 42 | 1.957130% |
Noise dominated data is calculated using 1-second bins in cleaned event files. If a bin has >2000 counts, and if more than 50% of those come from <1% of pixels, then it is considered to be noise-dominated and hence unusable.
| Quadrant | # 1 sec bins | Bins with >0 counts | Bins with >2000 counts | High rate bins dominated by noise | Noise dominated (total time) | Noise dominated (detector-on time) | Marked lightcurve |
|---|---|---|---|---|---|---|---|
| A | 2145 | 2145 | 0 | 0 | 0.00% | 0.00% |  |
| B | 2146 | 2146 | 5 | 5 | 0.23% | 0.23% |  |
| C | 2146 | 2146 | 10 | 10 | 0.47% | 0.47% |  |
| D | 2146 | 2146 | 49 | 49 | 2.28% | 2.28% |  |
Top three noisy pixels from each quadrant. If the there are fewer than three noisy pixels in the level2.evt file, extra rows are filled as -1
| Pixel properties | Quadrant properties | ||||||
|---|---|---|---|---|---|---|---|
| Quadrant | DetID | PixID | Counts | Sigma | Mean | Median | Sigma |
| A | 5 | 168 | 51279 | 926.36 | 269 | 265 | 55.1 |
| A | 15 | 174 | 8051 | 141.39 | 269 | 265 | 55.1 |
| A | 13 | 254 | 3902 | 66.04 | 269 | 265 | 55.1 |
| B | 0 | 190 | 47446 | 918.41 | 263 | 257 | 51.4 |
| B | 0 | 229 | 10071 | 191.0 | 263 | 257 | 51.4 |
| B | 3 | 64 | 9232 | 174.68 | 263 | 257 | 51.4 |
| C | 3 | 233 | 513537 | 8884.41 | 246 | 248 | 57.8 |
| C | 14 | 238 | 40124 | 690.21 | 246 | 248 | 57.8 |
| C | 10 | 23 | 3994 | 64.84 | 246 | 248 | 57.8 |
| D | 12 | 235 | 703550 | 11201.26 | 254 | 246 | 62.8 |
| D | 1 | 52 | 92122 | 1463.28 | 254 | 246 | 62.8 |
| D | 7 | 38 | 82101 | 1303.67 | 254 | 246 | 62.8 |
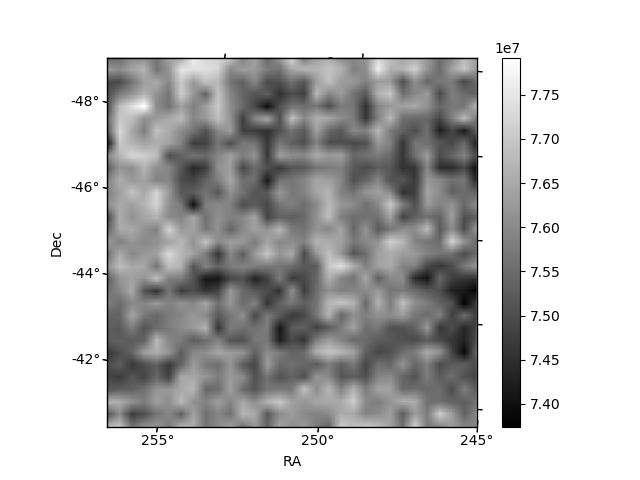
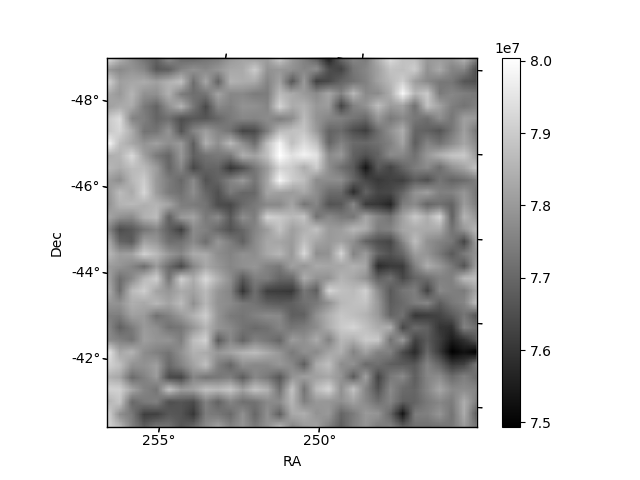
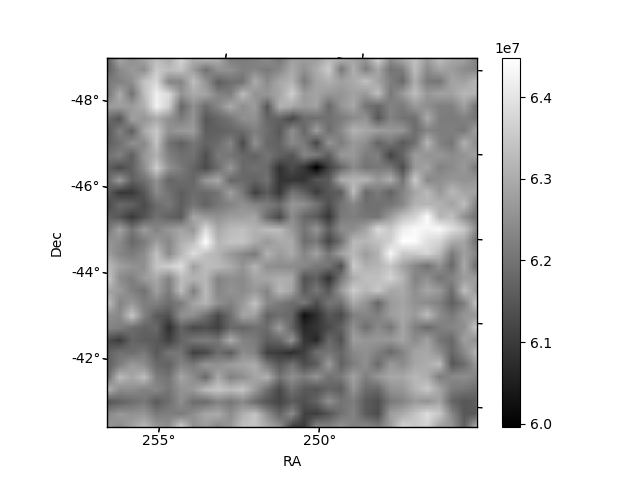
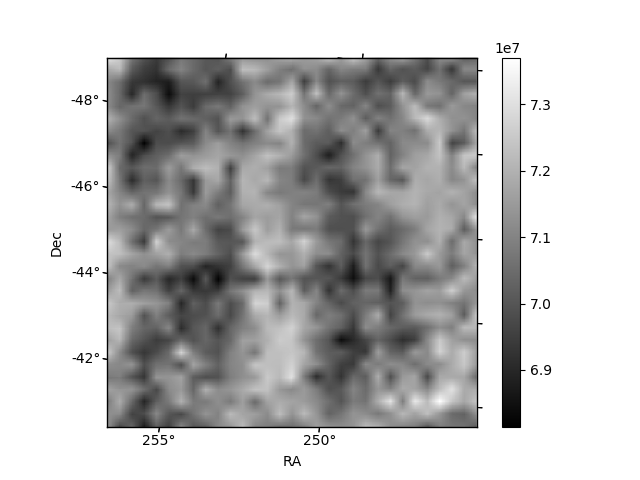
Histogram calculated using DETX and DETY for each event in the final _common_clean file
| Quadrant A | 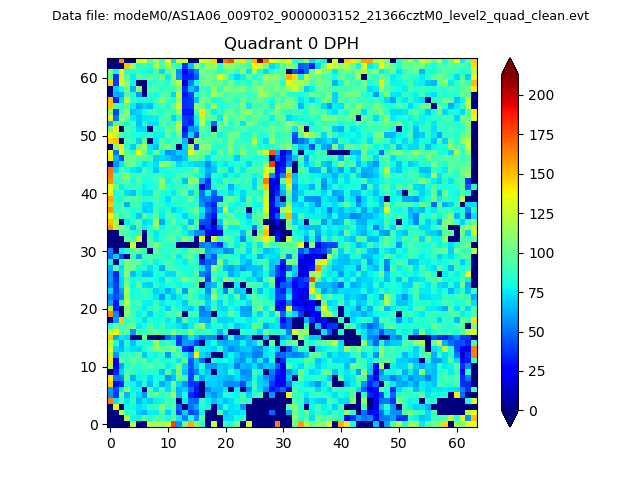 |
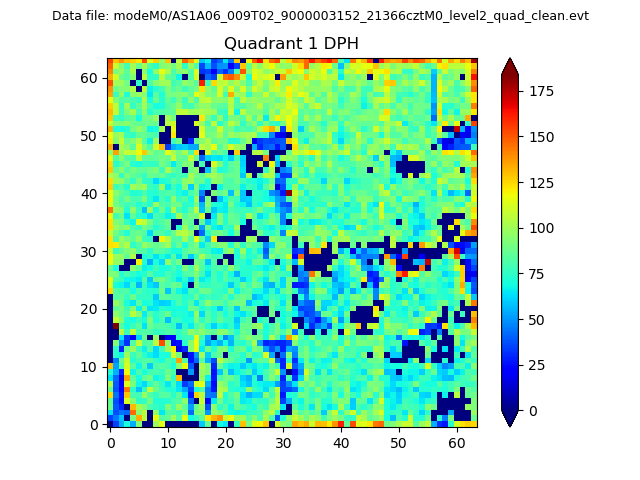 |
Quadrant B |
|---|---|---|---|
| Quadrant D | 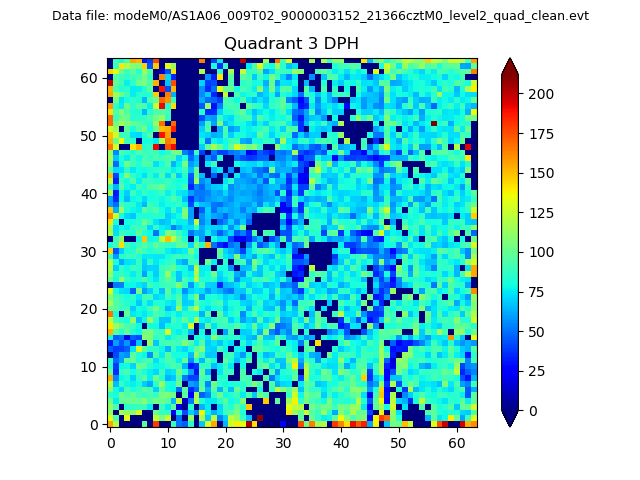 |
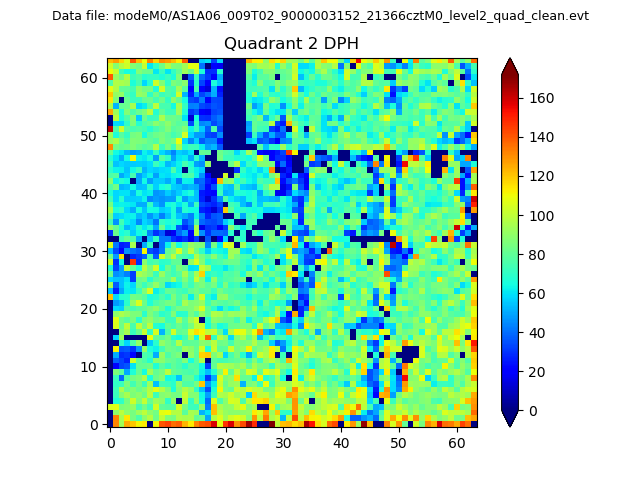 |
Quadrant C |
| Plot type | Count rate plots | Images |
|---|---|---|
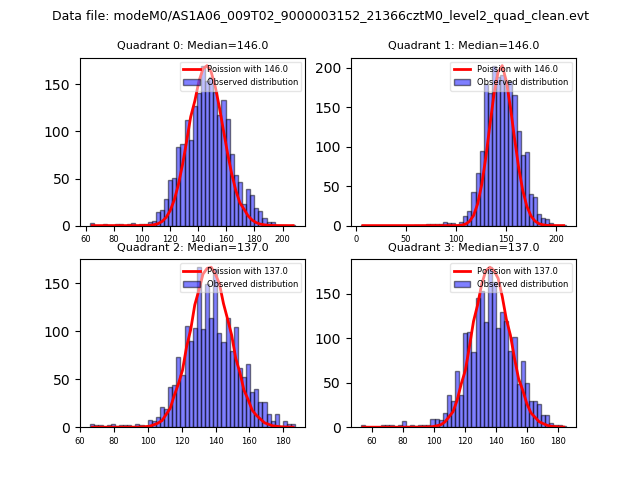
| Comparison with Poisson distribution Blue bars denote a histogram of data divided into 1 sec bins. Red curve is a Poisson curve with rate = median count rate of data. |
 |
 |
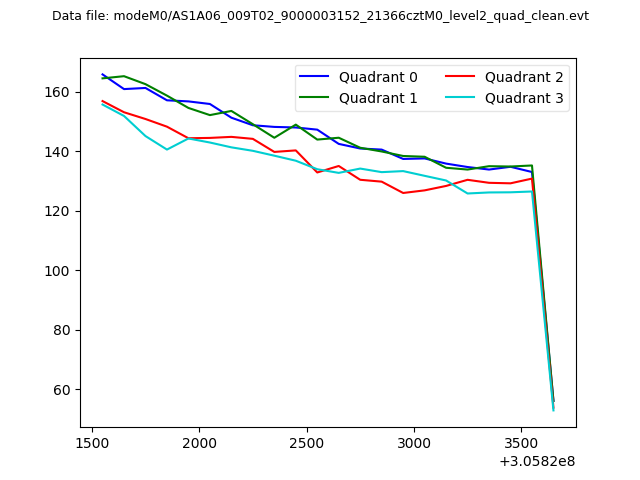
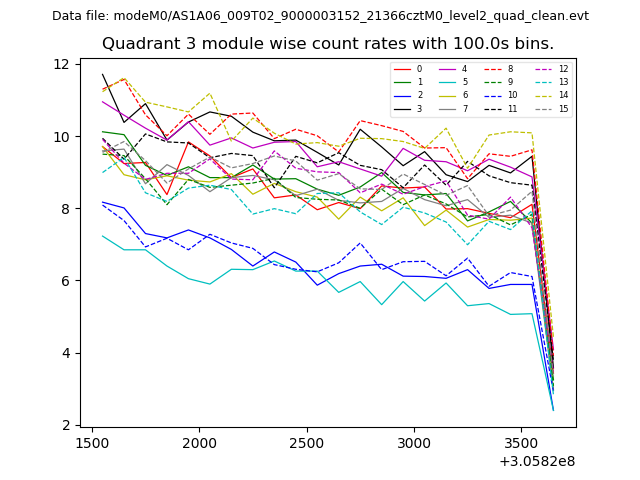
| Quadrant-wise count rates Data is divided into 100 sec bins |
 |
|
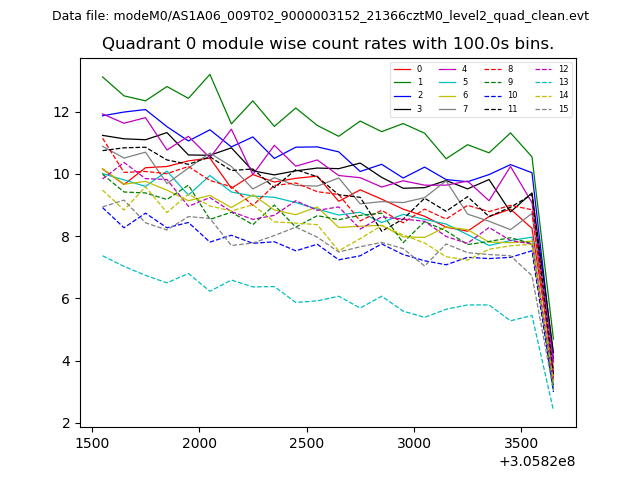
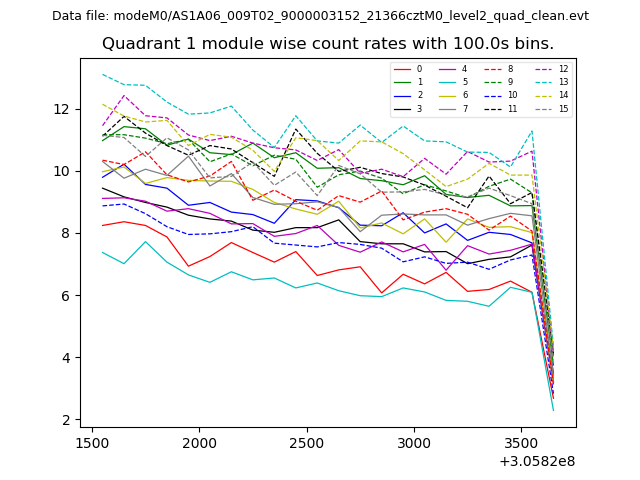
| Module-wise count rates for Quadrant A Data is divided into 100 sec bins |
 |
 |
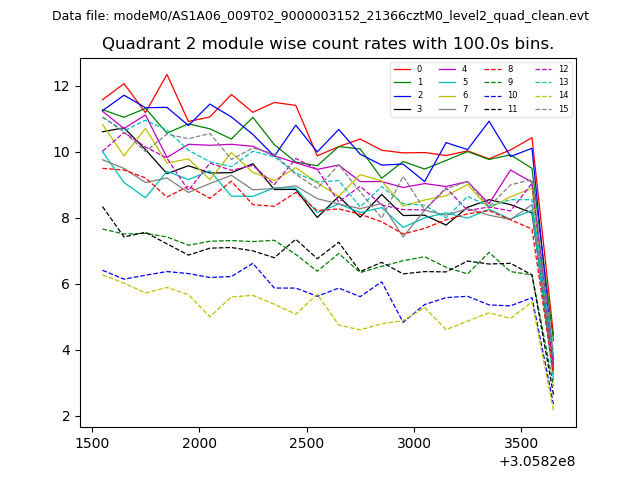
| Module-wise count rates for Quadrant B Data is divided into 100 sec bins |
 |
 |
| Module-wise count rates for Quadrant C Data is divided into 100 sec bins |
 |
 |
| Module-wise count rates for Quadrant D Data is divided into 100 sec bins |
 |
 |
| Parameter | Plot |
|---|---|
| CZT HV Monitor | 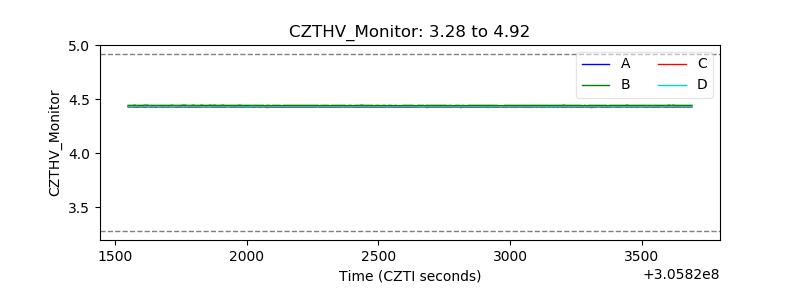 |
| D_VDD | 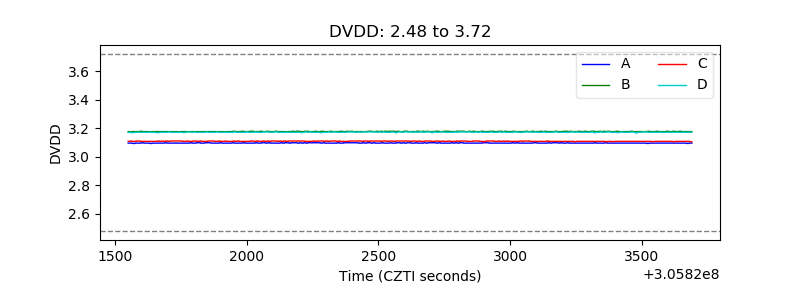 |
| Temperature 1 | 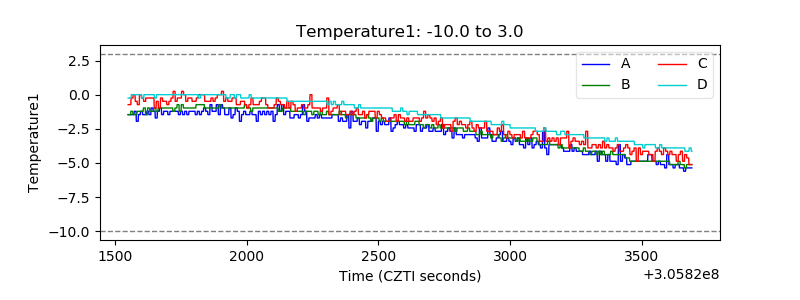 |
| Veto HV Monitor | 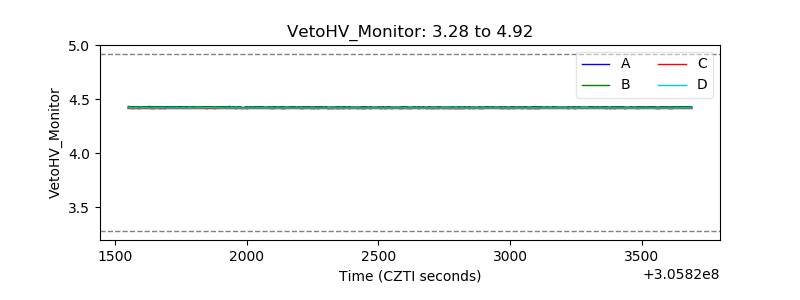 |
| Veto LLD | 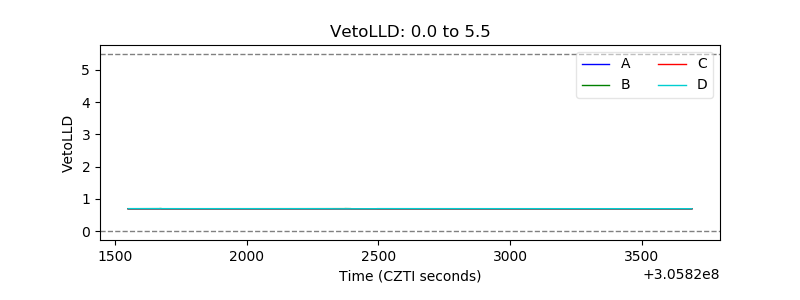 |
| Alpha Counter | 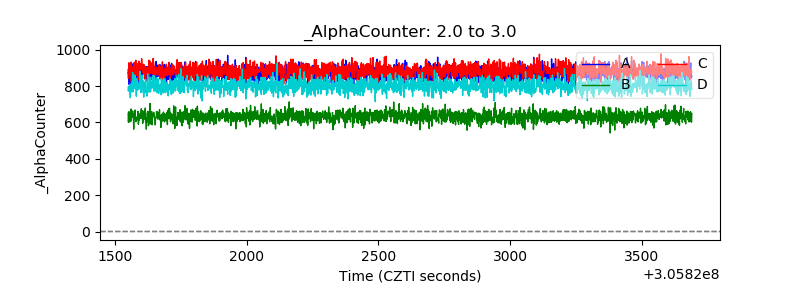 |
| _CPM_Rate | 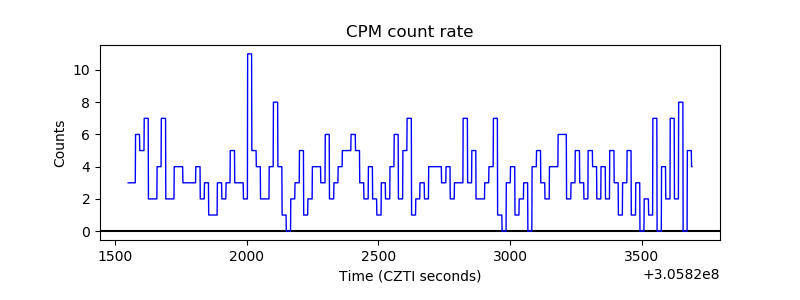 |
| CZT Counter | 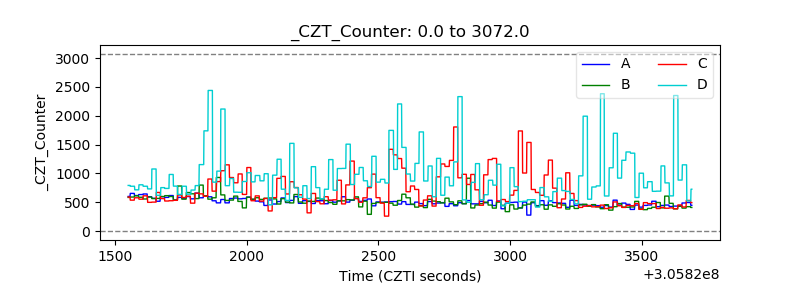 |
| +2.5 Volts monitor |  |
| +5 Volts monitor |  |
| _ROLL_ROT | 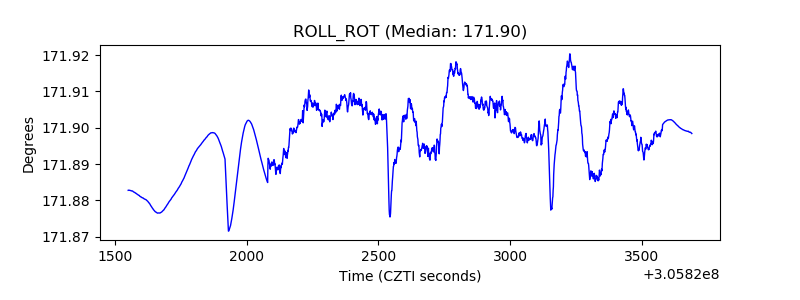 |
| _Roll_DEC | 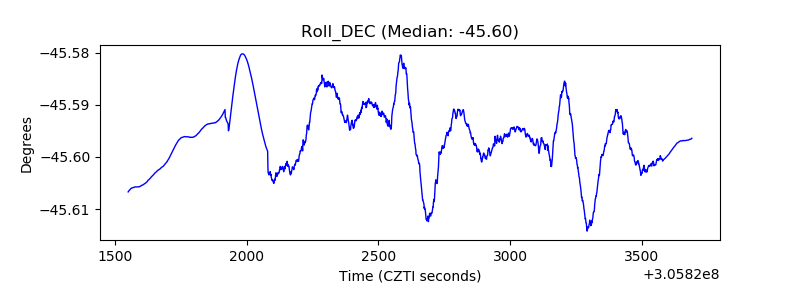 |
| _Roll_RA | 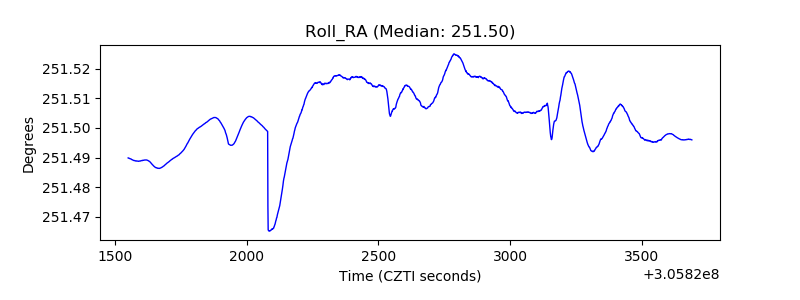 |
| Veto Counter | 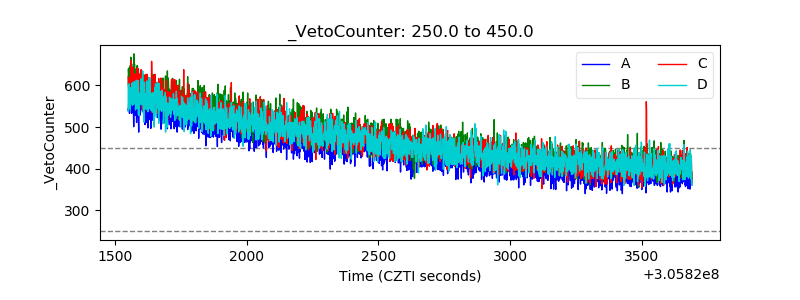 |