| Param | Original file | Final file |
|---|---|---|
| Filename | modeM0/AS1A06_009T05_9000003154cztM0_level2.fits | modeM0/AS1A06_009T05_9000003154cztM0_level2_quad_clean.evt |
| Size (bytes) | 293,146,560 | 287,424,000 |
| Size | 279.6 MB | 274.1 MB |
| Events in quadrant A | 1,799,028 | 1,728,586 |
| Events in quadrant B | 1,720,584 | 1,724,461 |
| Events in quadrant C | 1,728,794 | 1,645,463 |
| Events in quadrant D | 1,511,838 | 1,487,799 |
| Mode SS | |||
|---|---|---|---|
| Quadrant | BADHDUFLAG | Total packets | Discarded packets |
| A | 0 | 626 | 0 |
| B | 0 | 626 | 0 |
| C | 0 | 626 | 0 |
| D | 0 | 626 | 0 |
| Mode M0 | |||
|---|---|---|---|
| Quadrant | BADHDUFLAG | Total packets | Discarded packets |
| A | 0 | 64577 | 0 |
| B | 0 | 66140 | 0 |
| C | 0 | 70372 | 0 |
| D | 0 | 80432 | 0 |
| Mode M9 | |||
|---|---|---|---|
| Quadrant | BADHDUFLAG | Total packets | Discarded packets |
| A | 0 | 33 | 0 |
| B | 0 | 33 | 0 |
| C | 0 | 33 | 0 |
| D | 0 | 33 | 0 |
| Quadrant | Total seconds | Saturated seconds | Saturation percentage |
|---|---|---|---|
| A | 30814 | 215 | 0.697735% |
| B | 30814 | 343 | 1.113130% |
| C | 30814 | 812 | 2.635166% |
| D | 30814 | 582 | 1.888752% |
Noise dominated data is calculated using 1-second bins in cleaned event files. If a bin has >2000 counts, and if more than 50% of those come from <1% of pixels, then it is considered to be noise-dominated and hence unusable.
| Quadrant | # 1 sec bins | Bins with >0 counts | Bins with >2000 counts | High rate bins dominated by noise | Noise dominated (total time) | Noise dominated (detector-on time) | Marked lightcurve |
|---|---|---|---|---|---|---|---|
| A | 34109 | 30813 | 0 | 0 | 0.00% | 0.00% |  |
| B | 34109 | 30811 | 0 | 0 | 0.00% | 0.00% |  |
| C | 34109 | 30812 | 0 | 0 | 0.00% | 0.00% |  |
| D | 34109 | 30812 | 0 | 0 | 0.00% | 0.00% |  |
Top three noisy pixels from each quadrant. If the there are fewer than three noisy pixels in the level2.evt file, extra rows are filled as -1
| Pixel properties | Quadrant properties | ||||||
|---|---|---|---|---|---|---|---|
| Quadrant | DetID | PixID | Counts | Sigma | Mean | Median | Sigma |
| A | 0 | 29 | 1690 | 10.53 | 468 | 439 | 118.8 |
| A | 7 | 110 | 1458 | 8.58 | 468 | 439 | 118.8 |
| A | 9 | 19 | 1381 | 7.93 | 468 | 439 | 118.8 |
| B | 2 | 9 | 1384 | 10.46 | 454 | 434 | 90.8 |
| B | 2 | 8 | 1168 | 8.08 | 454 | 434 | 90.8 |
| B | 3 | 17 | 1162 | 8.01 | 454 | 434 | 90.8 |
| C | 12 | 241 | 1220 | 6.75 | 455 | 424 | 117.9 |
| C | 3 | 126 | 1174 | 6.36 | 455 | 424 | 117.9 |
| C | 9 | 209 | 1160 | 6.24 | 455 | 424 | 117.9 |
| D | 3 | 14 | 1126 | 6.33 | 431 | 393 | 115.7 |
| D | 6 | 231 | 1088 | 6.01 | 431 | 393 | 115.7 |
| D | 7 | 3 | 1059 | 5.76 | 431 | 393 | 115.7 |
Histogram calculated using DETX and DETY for each event in the final _common_clean file
| Quadrant A | 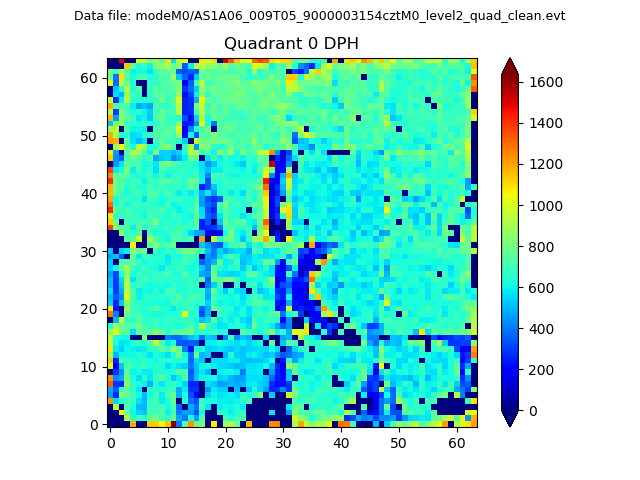 |
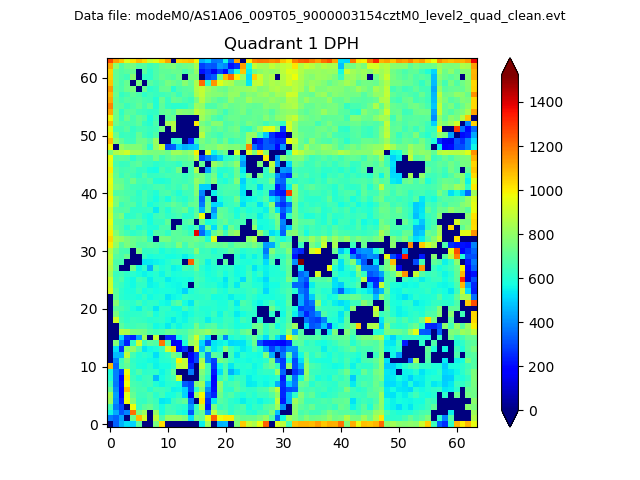 |
Quadrant B |
|---|---|---|---|
| Quadrant D |  |
 |
Quadrant C |
| Plot type | Count rate plots | Images |
|---|---|---|
| Comparison with Poisson distribution Blue bars denote a histogram of data divided into 1 sec bins. Red curve is a Poisson curve with rate = median count rate of data. |
 |
 |
| Quadrant-wise count rates Data is divided into 100 sec bins |
 |
|
| Module-wise count rates for Quadrant A Data is divided into 100 sec bins |
 |
 |
| Module-wise count rates for Quadrant B Data is divided into 100 sec bins |
 |
 |
| Module-wise count rates for Quadrant C Data is divided into 100 sec bins |
 |
 |
| Module-wise count rates for Quadrant D Data is divided into 100 sec bins |
 |
 |
| Parameter | Plot |
|---|---|
| CZT HV Monitor |  |
| D_VDD |  |
| Temperature 1 |  |
| Veto HV Monitor |  |
| Veto LLD |  |
| Alpha Counter |  |
| _CPM_Rate |  |
| CZT Counter |  |
| +2.5 Volts monitor |  |
| +5 Volts monitor |  |
| _ROLL_ROT |  |
| _Roll_DEC |  |
| _Roll_RA |  |
| Veto Counter |  |