| Param | Original file | Final file |
|---|---|---|
| Filename | modeM0/AS1A06_009T05_9000003154_21366cztM0_level2.evt | modeM0/AS1A06_009T05_9000003154_21366cztM0_level2_quad_clean.evt |
| Size (bytes) | 313,732,800 | 38,102,400 |
| Size | 299.2 MB | 36.3 MB |
| Events in quadrant A | 1,924,234 | 231,668 |
| Events in quadrant B | 1,970,626 | 233,032 |
| Events in quadrant C | 2,798,369 | 216,757 |
| Events in quadrant D | 2,558,244 | 212,566 |
| Mode SS | |||
|---|---|---|---|
| Quadrant | BADHDUFLAG | Total packets | Discarded packets |
| A | 0 | 76 | 0 |
| B | 0 | 76 | 0 |
| C | 0 | 76 | 0 |
| D | 0 | 76 | 0 |
| Mode M0 | |||
|---|---|---|---|
| Quadrant | BADHDUFLAG | Total packets | Discarded packets |
| A | 0 | 7915 | 1 |
| B | 0 | 8141 | 1 |
| C | 0 | 10704 | 1 |
| D | 0 | 9973 | 1 |
| Mode M9 | |||
|---|---|---|---|
| Quadrant | BADHDUFLAG | Total packets | Discarded packets |
| A | 0 | 12 | 0 |
| B | 0 | 12 | 0 |
| C | 0 | 12 | 0 |
| D | 0 | 12 | 0 |
| Quadrant | Total seconds | Saturated seconds | Saturation percentage |
|---|---|---|---|
| A | 3661 | 49 | 1.338432% |
| B | 3661 | 64 | 1.748156% |
| C | 3661 | 437 | 11.936629% |
| D | 3661 | 75 | 2.048621% |
Noise dominated data is calculated using 1-second bins in cleaned event files. If a bin has >2000 counts, and if more than 50% of those come from <1% of pixels, then it is considered to be noise-dominated and hence unusable.
| Quadrant | # 1 sec bins | Bins with >0 counts | Bins with >2000 counts | High rate bins dominated by noise | Noise dominated (total time) | Noise dominated (detector-on time) | Marked lightcurve |
|---|---|---|---|---|---|---|---|
| A | 4881 | 3662 | 0 | 0 | 0.00% | 0.00% | 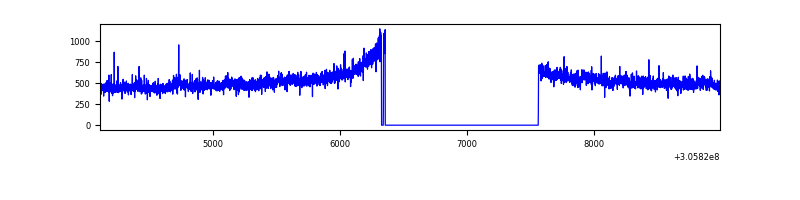 |
| B | 4881 | 3663 | 1 | 1 | 0.02% | 0.03% | 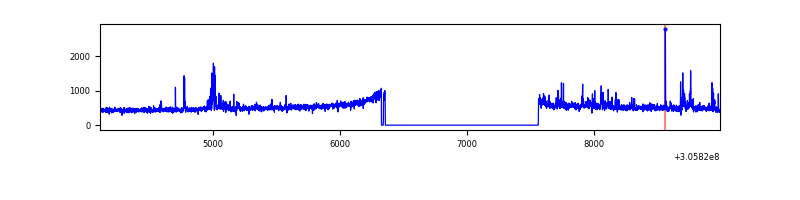 |
| C | 4881 | 3662 | 92 | 92 | 1.88% | 2.51% | 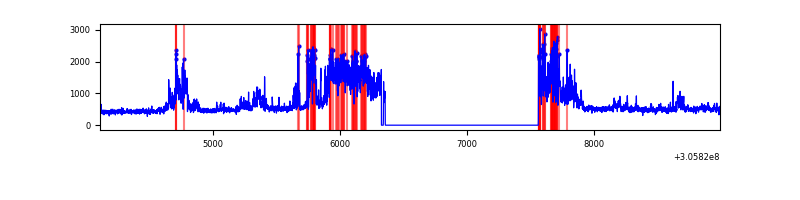 |
| D | 4881 | 3662 | 60 | 60 | 1.23% | 1.64% | 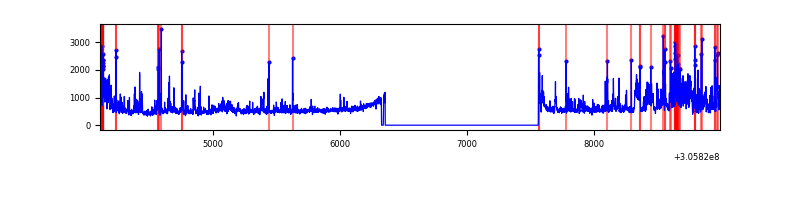 |
Top three noisy pixels from each quadrant. If the there are fewer than three noisy pixels in the level2.evt file, extra rows are filled as -1
| Pixel properties | Quadrant properties | ||||||
|---|---|---|---|---|---|---|---|
| Quadrant | DetID | PixID | Counts | Sigma | Mean | Median | Sigma |
| A | 5 | 168 | 77741 | 788.56 | 476 | 467 | 98.0 |
| A | 12 | 96 | 7251 | 69.23 | 476 | 467 | 98.0 |
| A | 13 | 254 | 5917 | 55.62 | 476 | 467 | 98.0 |
| B | 3 | 64 | 45976 | 499.45 | 472 | 461 | 91.1 |
| B | 0 | 190 | 34338 | 371.74 | 472 | 461 | 91.1 |
| B | 0 | 230 | 17251 | 184.24 | 472 | 461 | 91.1 |
| C | 3 | 233 | 1029049 | 10038.57 | 436 | 438 | 102.5 |
| C | 14 | 238 | 69333 | 672.37 | 436 | 438 | 102.5 |
| C | 13 | 61 | 3036 | 25.35 | 436 | 438 | 102.5 |
| D | 12 | 235 | 423357 | 3791.62 | 453 | 438 | 111.5 |
| D | 1 | 52 | 226364 | 2025.51 | 453 | 438 | 111.5 |
| D | 6 | 143 | 99525 | 888.35 | 453 | 438 | 111.5 |
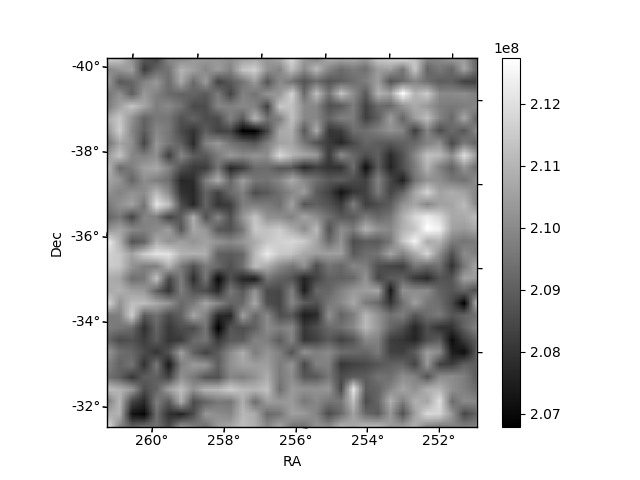
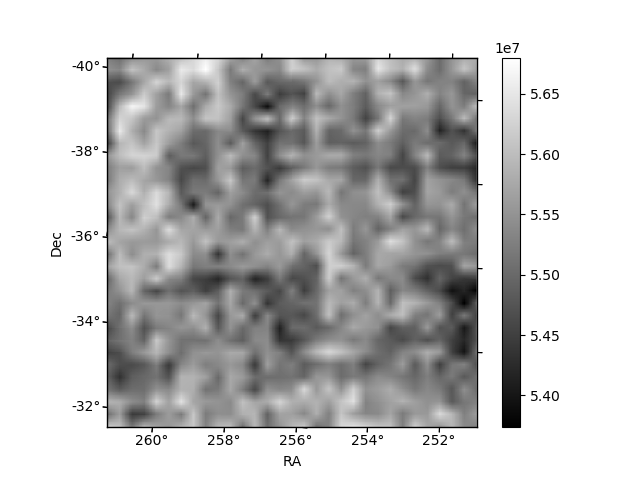
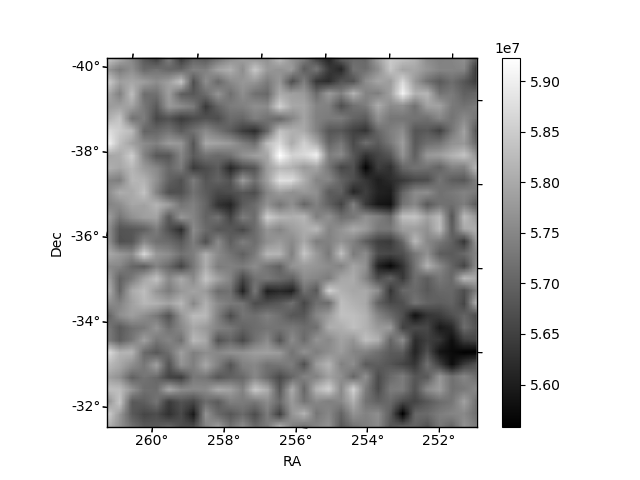
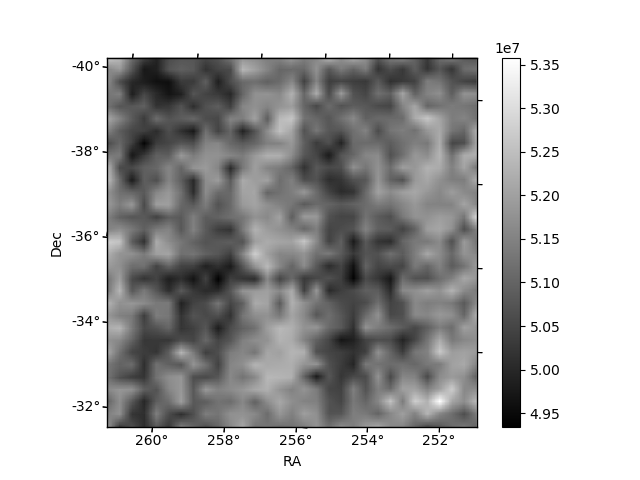
Histogram calculated using DETX and DETY for each event in the final _common_clean file
| Quadrant A | 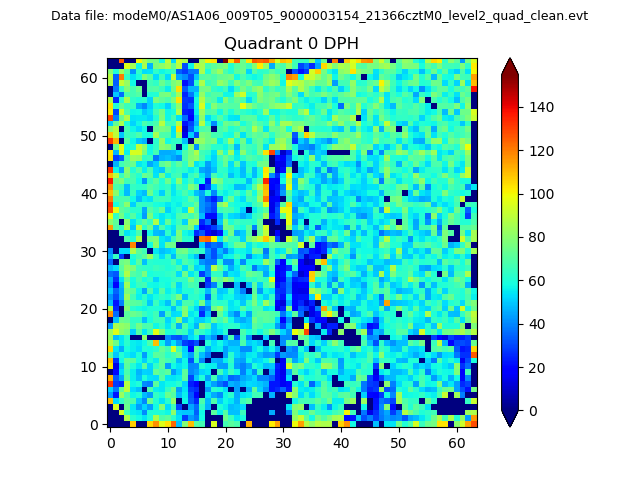 |
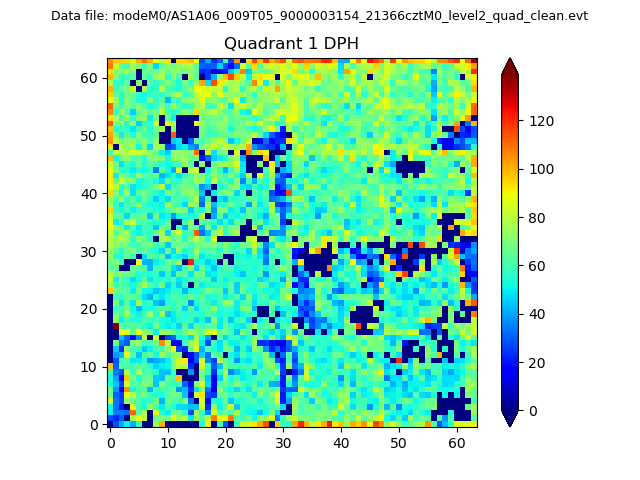 |
Quadrant B |
|---|---|---|---|
| Quadrant D | 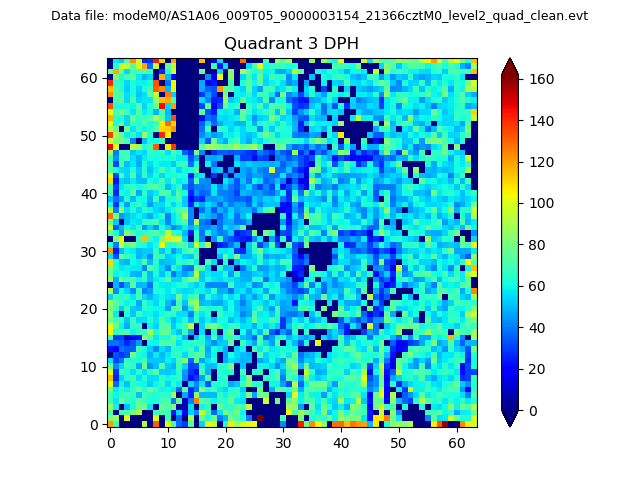 |
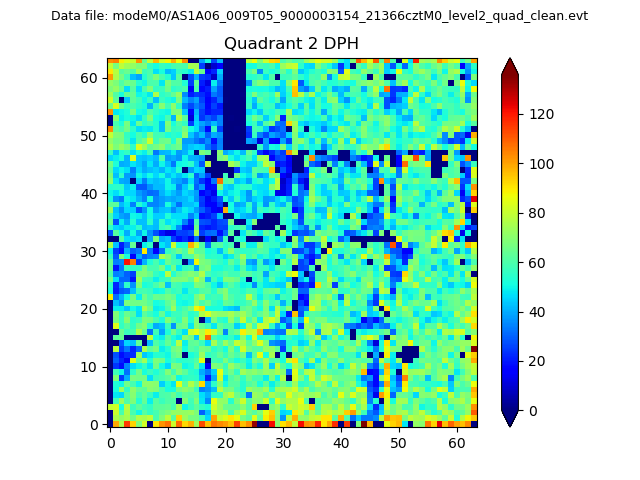 |
Quadrant C |
| Plot type | Count rate plots | Images |
|---|---|---|
| Comparison with Poisson distribution Blue bars denote a histogram of data divided into 1 sec bins. Red curve is a Poisson curve with rate = median count rate of data. |
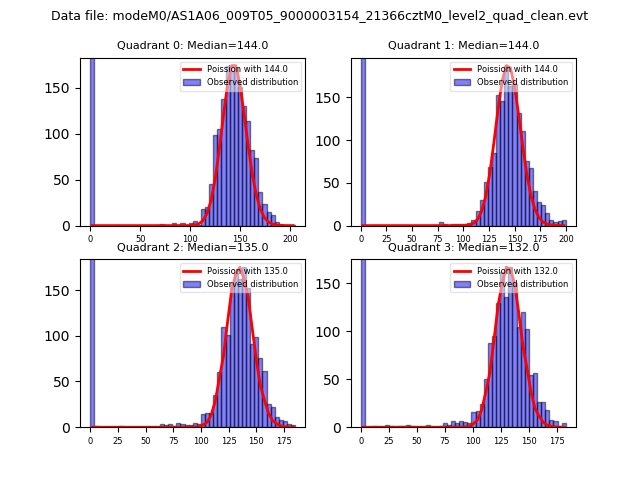 |
 |
| Quadrant-wise count rates Data is divided into 100 sec bins |
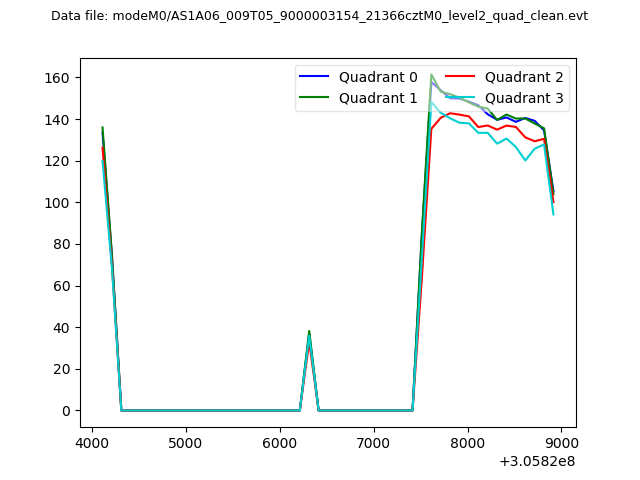 |
|
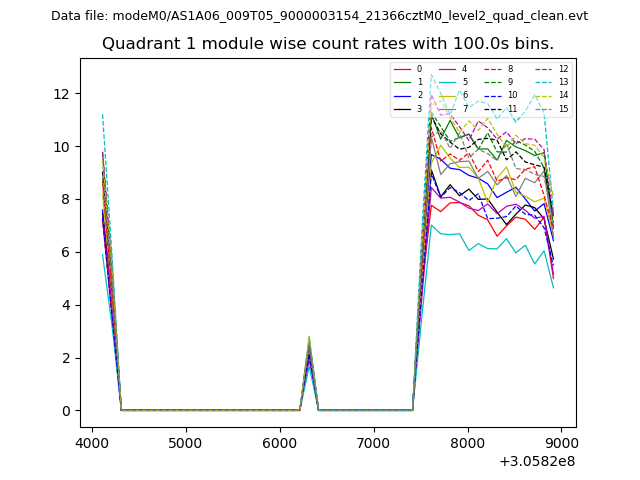
| Module-wise count rates for Quadrant A Data is divided into 100 sec bins |
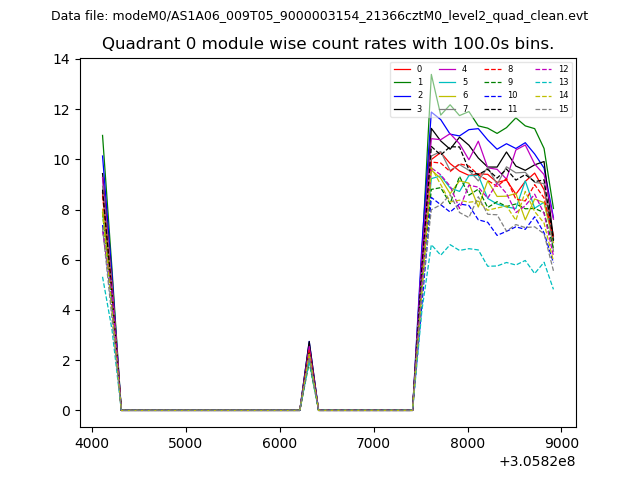 |
 |
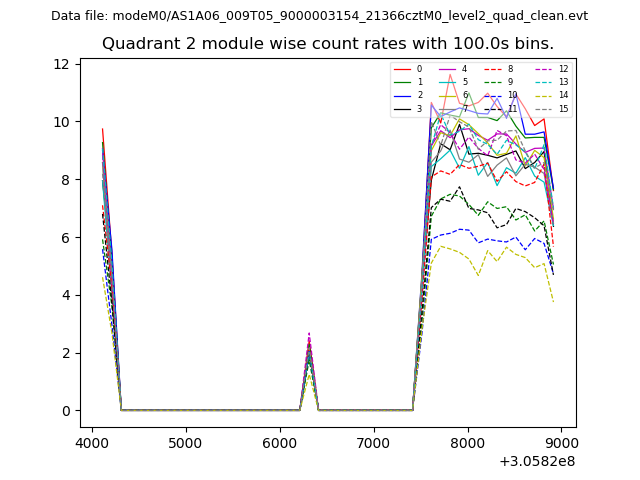
| Module-wise count rates for Quadrant B Data is divided into 100 sec bins |
 |
 |
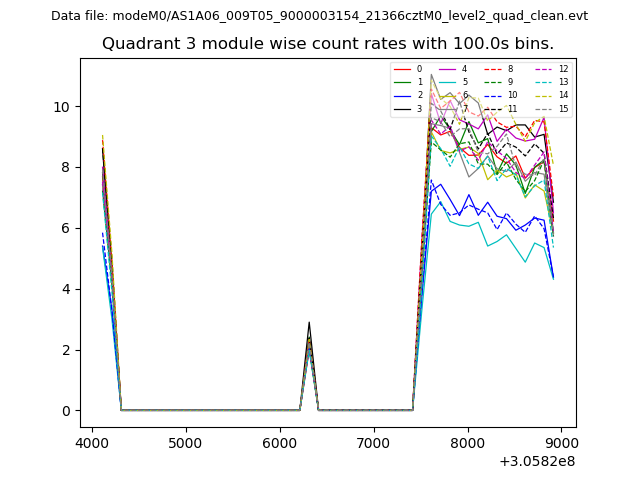
| Module-wise count rates for Quadrant C Data is divided into 100 sec bins |
 |
 |
| Module-wise count rates for Quadrant D Data is divided into 100 sec bins |
 |
 |
| Parameter | Plot |
|---|---|
| CZT HV Monitor | 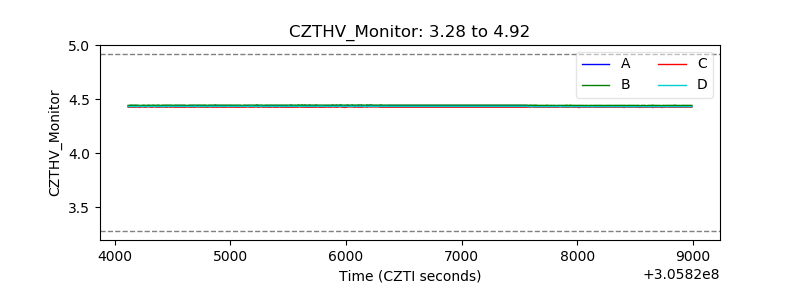 |
| D_VDD | 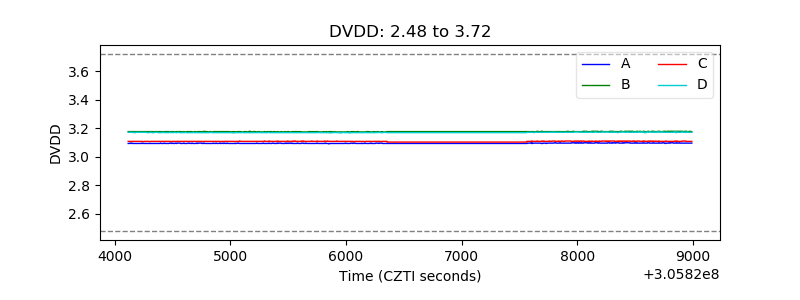 |
| Temperature 1 | 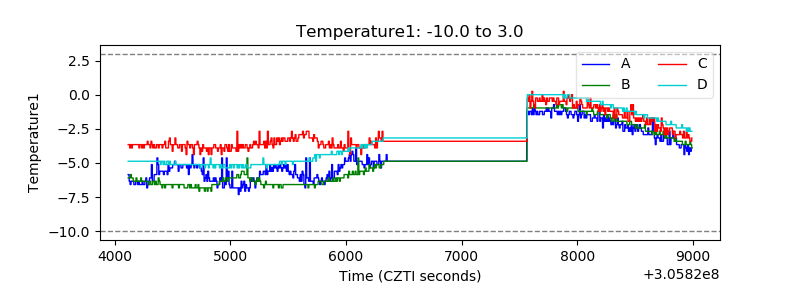 |
| Veto HV Monitor |  |
| Veto LLD | 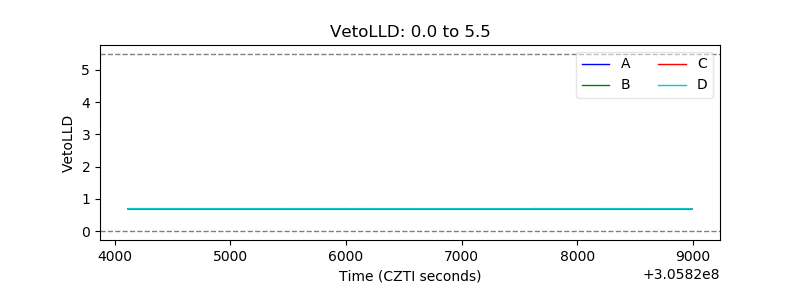 |
| Alpha Counter | 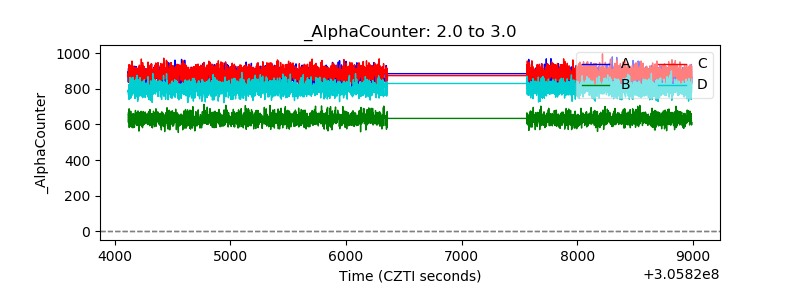 |
| _CPM_Rate | 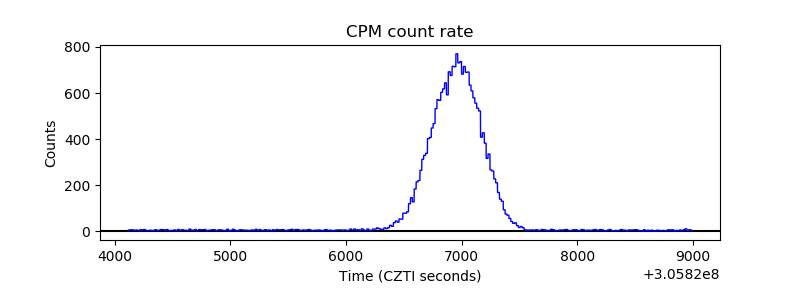 |
| CZT Counter | 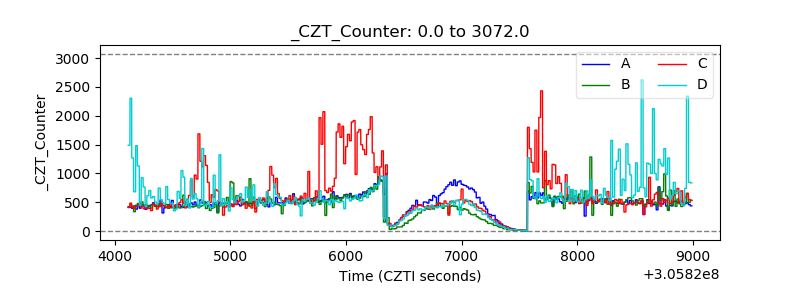 |
| +2.5 Volts monitor |  |
| +5 Volts monitor |  |
| _ROLL_ROT | 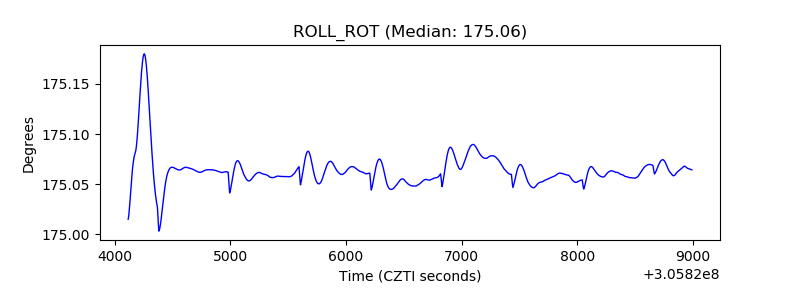 |
| _Roll_DEC | 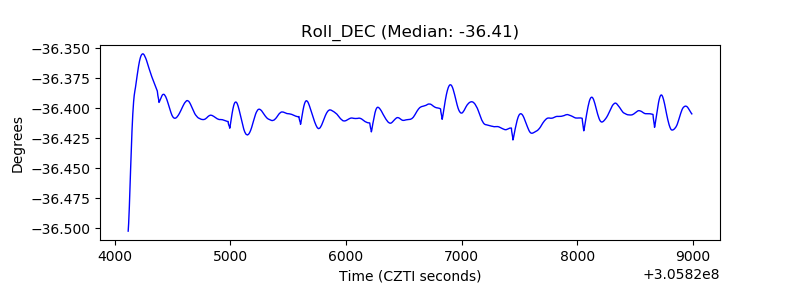 |
| _Roll_RA | 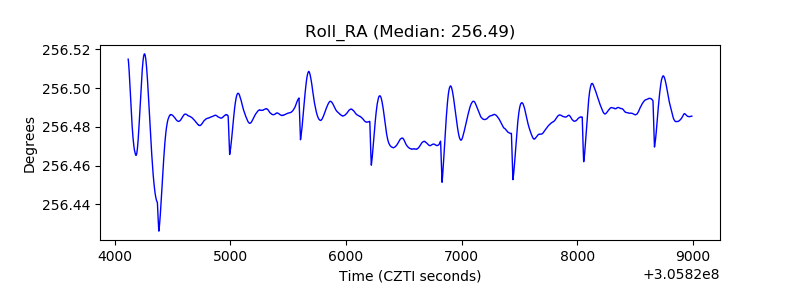 |
| Veto Counter | 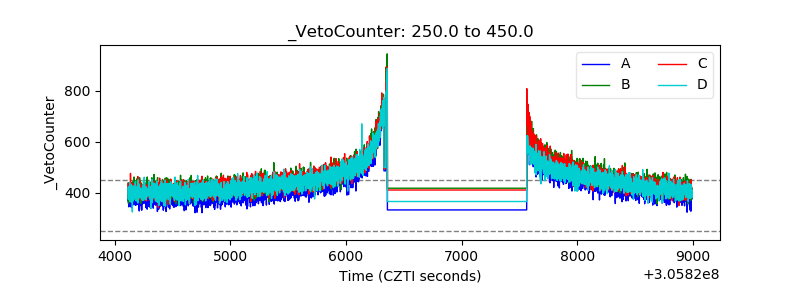 |