| Param | Original file | Final file |
|---|---|---|
| Filename | modeM0/AS1A06_009T05_9000003154_21368cztM0_level2.evt | modeM0/AS1A06_009T05_9000003154_21368cztM0_level2_quad_clean.evt |
| Size (bytes) | 526,927,680 | 105,410,880 |
| Size | 502.5 MB | 100.5 MB |
| Events in quadrant A | 3,617,647 | 687,357 |
| Events in quadrant B | 3,729,072 | 689,537 |
| Events in quadrant C | 3,970,818 | 665,704 |
| Events in quadrant D | 4,155,135 | 651,778 |
| Mode SS | |||
|---|---|---|---|
| Quadrant | BADHDUFLAG | Total packets | Discarded packets |
| A | 0 | 144 | 0 |
| B | 0 | 144 | 0 |
| C | 0 | 144 | 0 |
| D | 0 | 144 | 0 |
| Mode M0 | |||
|---|---|---|---|
| Quadrant | BADHDUFLAG | Total packets | Discarded packets |
| A | 0 | 15284 | 2 |
| B | 0 | 15756 | 2 |
| C | 0 | 16670 | 2 |
| D | 0 | 17157 | 2 |
| Mode M9 | |||
|---|---|---|---|
| Quadrant | BADHDUFLAG | Total packets | Discarded packets |
| A | 0 | 5 | 0 |
| B | 0 | 6 | 0 |
| C | 0 | 6 | 0 |
| D | 0 | 6 | 0 |
| Quadrant | Total seconds | Saturated seconds | Saturation percentage |
|---|---|---|---|
| A | 7159 | 68 | 0.949853% |
| B | 7159 | 121 | 1.690180% |
| C | 7159 | 139 | 1.941612% |
| D | 7159 | 77 | 1.075569% |
Noise dominated data is calculated using 1-second bins in cleaned event files. If a bin has >2000 counts, and if more than 50% of those come from <1% of pixels, then it is considered to be noise-dominated and hence unusable.
| Quadrant | # 1 sec bins | Bins with >0 counts | Bins with >2000 counts | High rate bins dominated by noise | Noise dominated (total time) | Noise dominated (detector-on time) | Marked lightcurve |
|---|---|---|---|---|---|---|---|
| A | 7654 | 7160 | 18 | 18 | 0.24% | 0.25% | 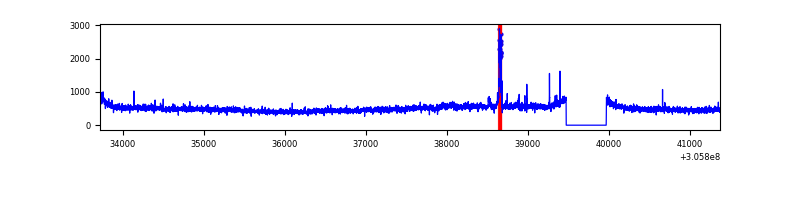 |
| B | 7654 | 7160 | 22 | 22 | 0.29% | 0.31% | 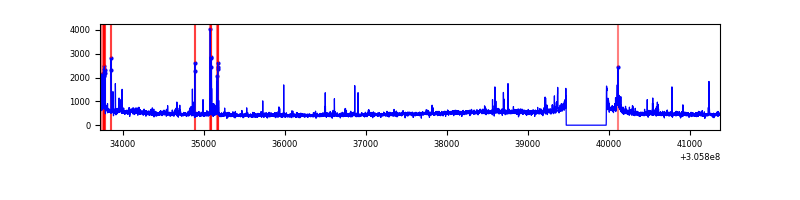 |
| C | 7654 | 7160 | 5 | 5 | 0.07% | 0.07% | 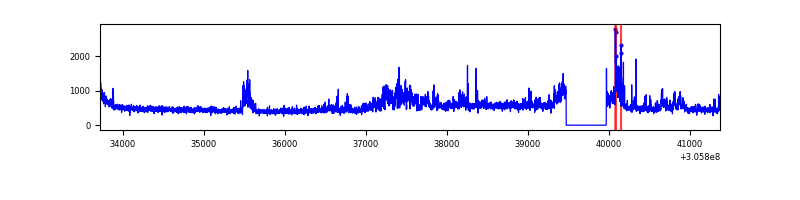 |
| D | 7654 | 7160 | 28 | 28 | 0.37% | 0.39% | 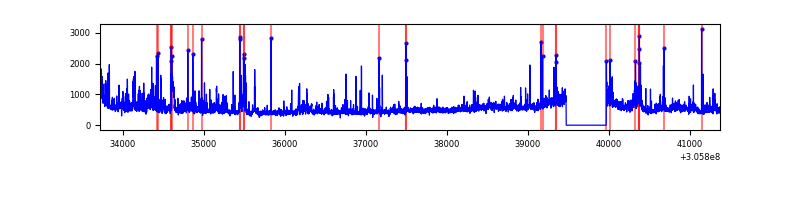 |
Top three noisy pixels from each quadrant. If the there are fewer than three noisy pixels in the level2.evt file, extra rows are filled as -1
| Pixel properties | Quadrant properties | ||||||
|---|---|---|---|---|---|---|---|
| Quadrant | DetID | PixID | Counts | Sigma | Mean | Median | Sigma |
| A | 5 | 168 | 167943 | 951.11 | 873 | 855 | 175.7 |
| A | 15 | 174 | 73885 | 415.71 | 873 | 855 | 175.7 |
| A | 13 | 254 | 12034 | 63.63 | 873 | 855 | 175.7 |
| B | 0 | 189 | 59733 | 359.05 | 867 | 847 | 164.0 |
| B | 0 | 230 | 44874 | 268.45 | 867 | 847 | 164.0 |
| B | 0 | 190 | 39925 | 238.27 | 867 | 847 | 164.0 |
| C | 3 | 233 | 621368 | 3209.75 | 825 | 828 | 193.3 |
| C | 14 | 238 | 129143 | 663.71 | 825 | 828 | 193.3 |
| C | 13 | 61 | 5842 | 25.93 | 825 | 828 | 193.3 |
| D | 12 | 235 | 351395 | 1703.4 | 839 | 814 | 205.8 |
| D | 1 | 52 | 272165 | 1318.44 | 839 | 814 | 205.8 |
| D | 7 | 38 | 144330 | 697.32 | 839 | 814 | 205.8 |
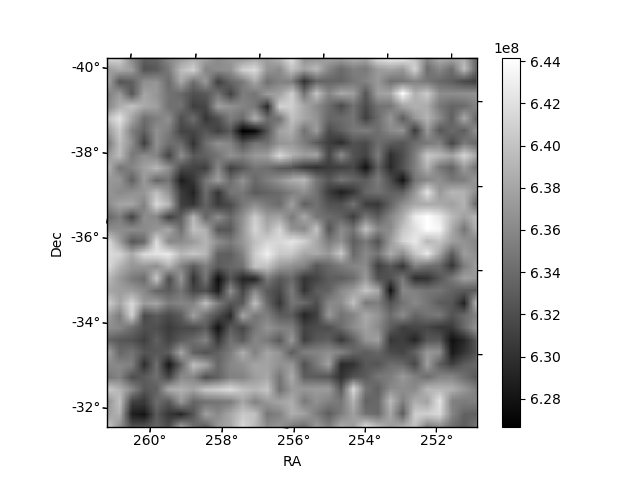
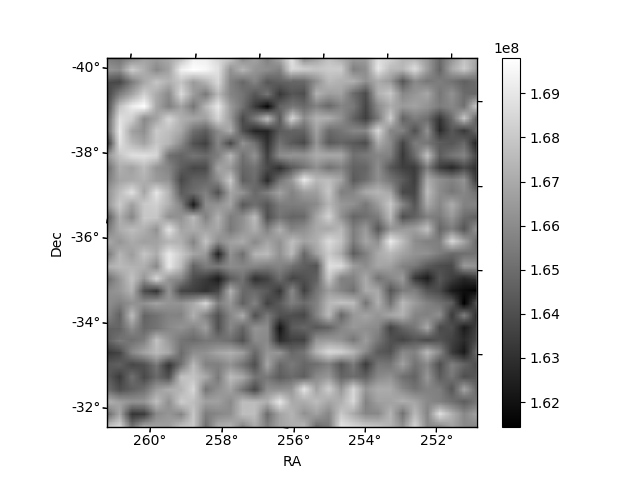
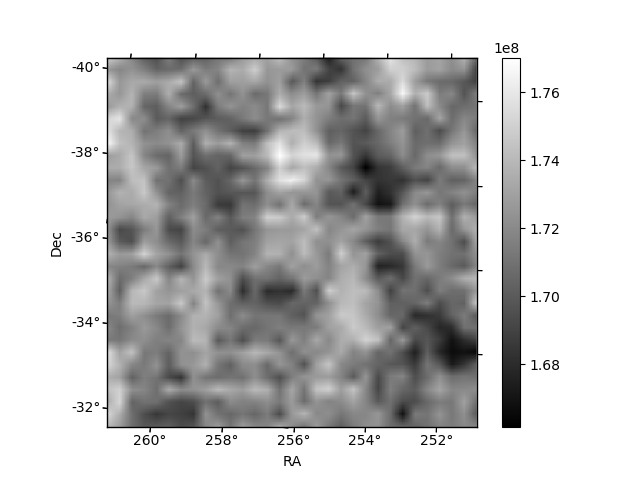
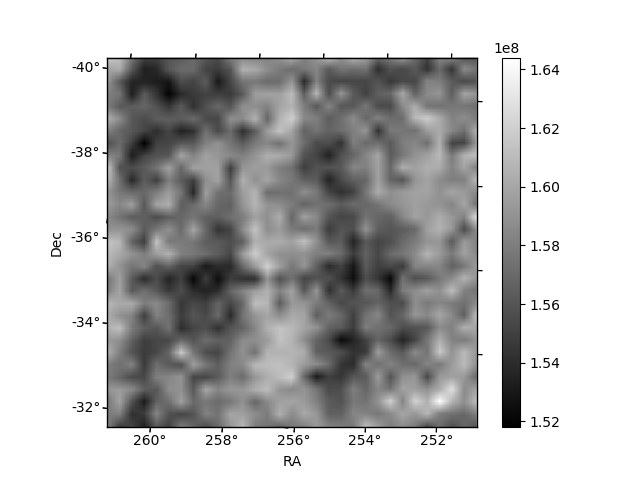
Histogram calculated using DETX and DETY for each event in the final _common_clean file
| Quadrant A | 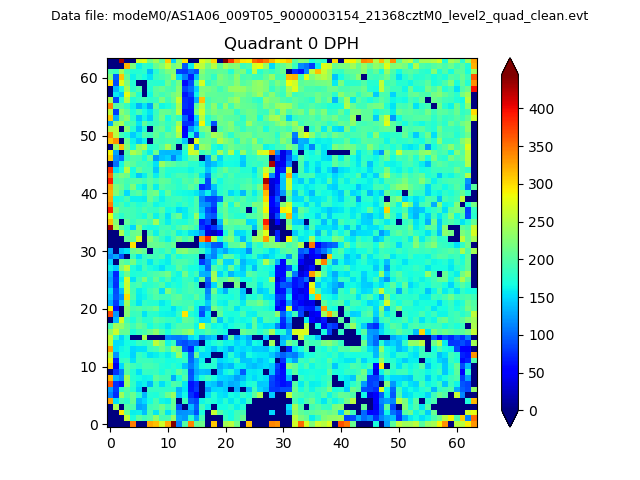 |
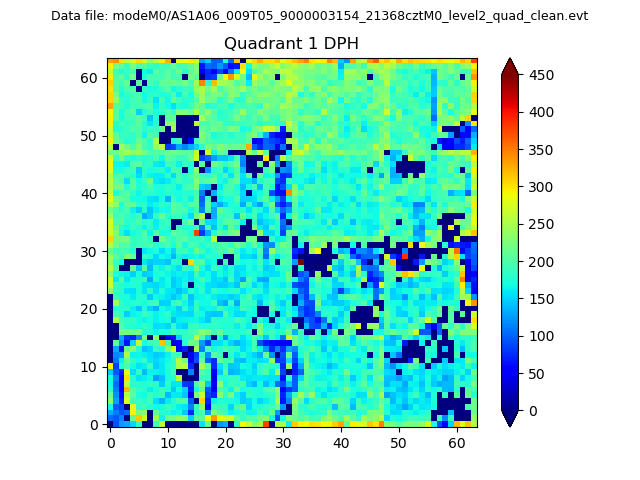 |
Quadrant B |
|---|---|---|---|
| Quadrant D | 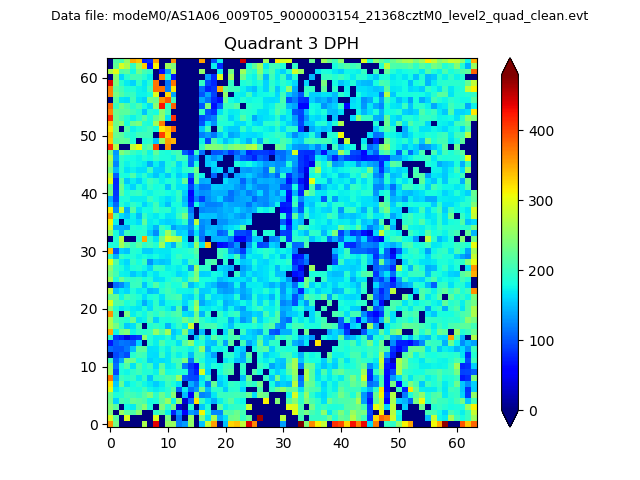 |
 |
Quadrant C |
| Plot type | Count rate plots | Images |
|---|---|---|
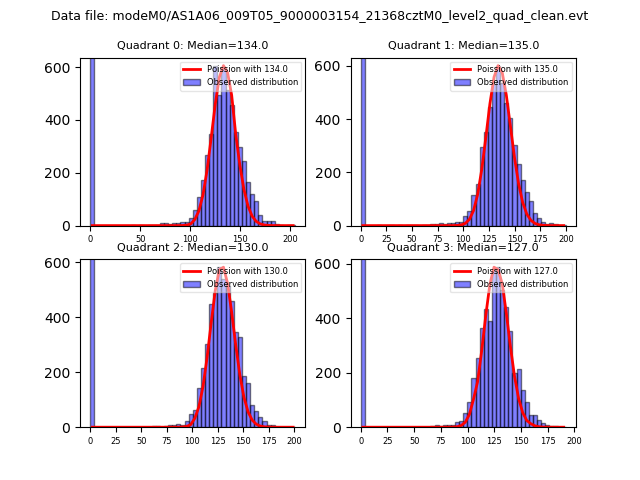
| Comparison with Poisson distribution Blue bars denote a histogram of data divided into 1 sec bins. Red curve is a Poisson curve with rate = median count rate of data. |
 |
 |
| Quadrant-wise count rates Data is divided into 100 sec bins |
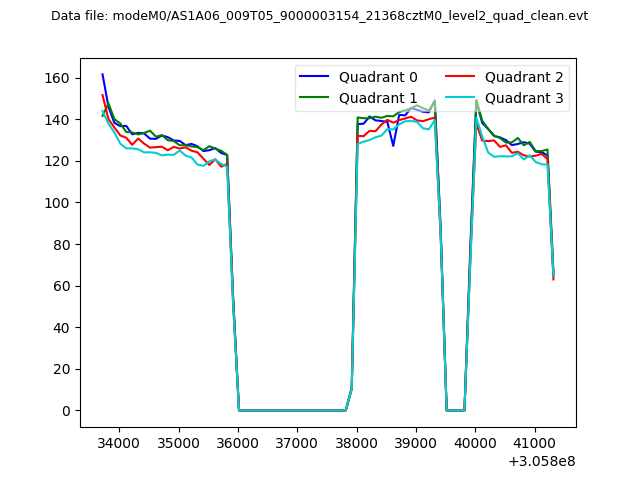 |
|
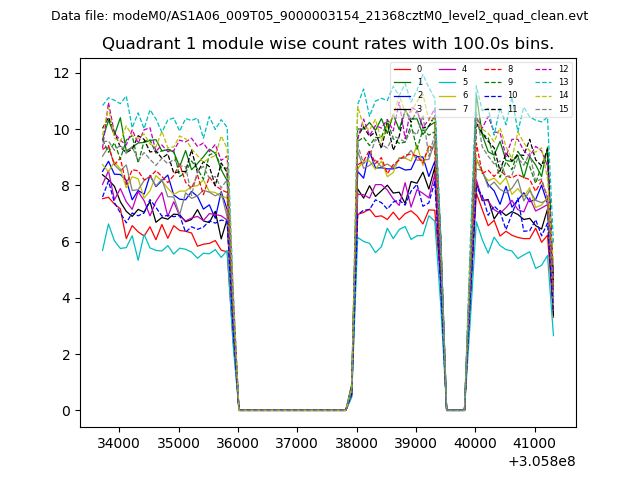
| Module-wise count rates for Quadrant A Data is divided into 100 sec bins |
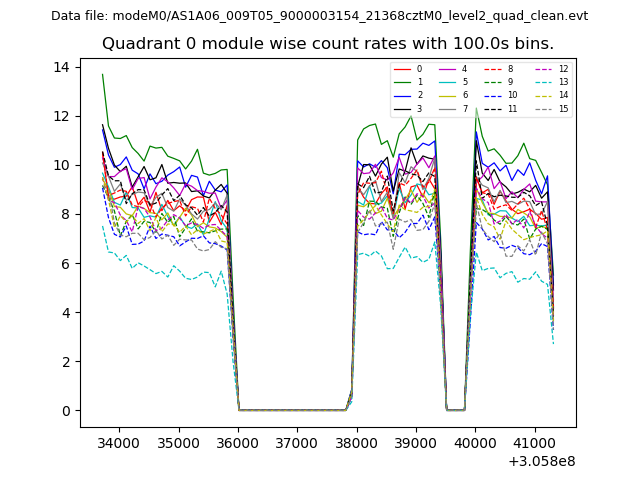 |
 |
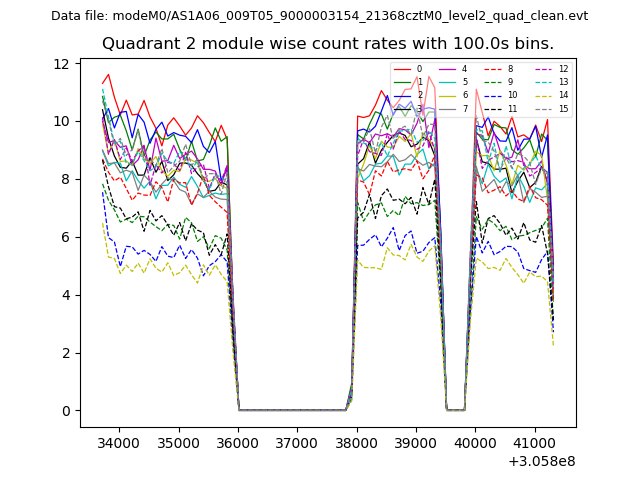
| Module-wise count rates for Quadrant B Data is divided into 100 sec bins |
 |
 |
| Module-wise count rates for Quadrant C Data is divided into 100 sec bins |
 |
 |
| Module-wise count rates for Quadrant D Data is divided into 100 sec bins |
 |
 |
| Parameter | Plot |
|---|---|
| CZT HV Monitor | 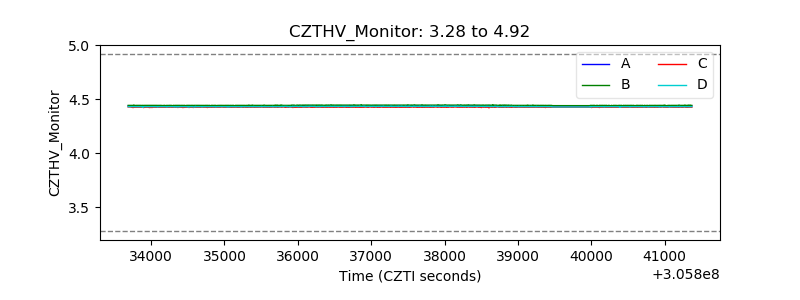 |
| D_VDD |  |
| Temperature 1 | 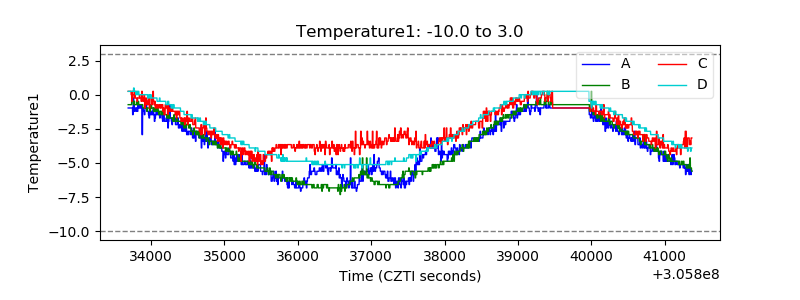 |
| Veto HV Monitor |  |
| Veto LLD | 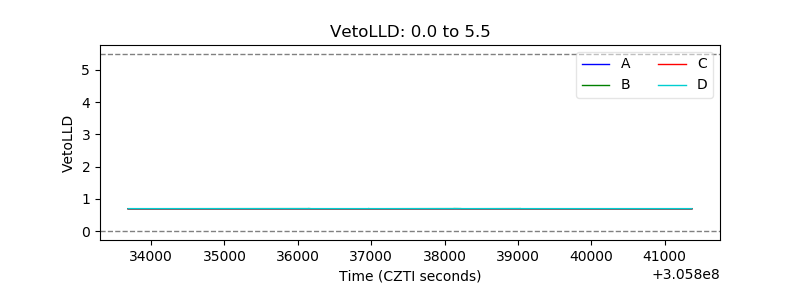 |
| Alpha Counter | 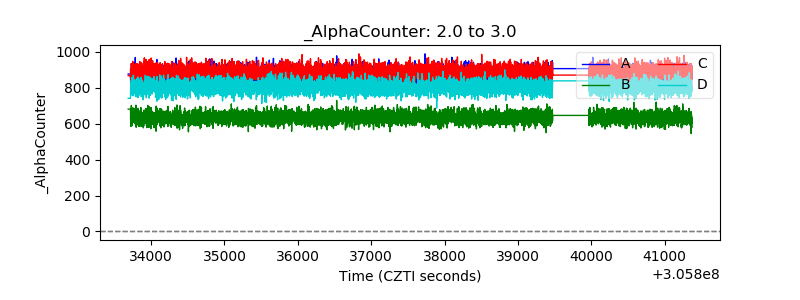 |
| _CPM_Rate | 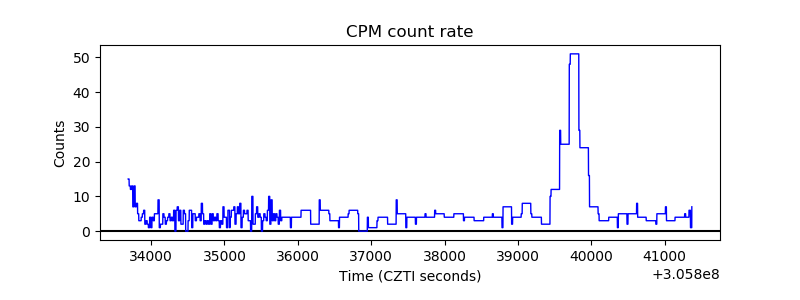 |
| CZT Counter |  |
| +2.5 Volts monitor |  |
| +5 Volts monitor | 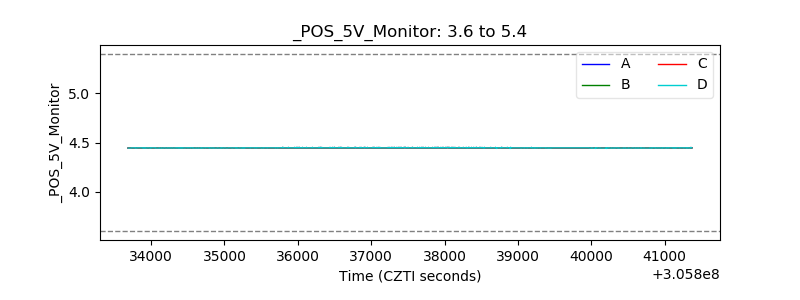 |
| _ROLL_ROT | 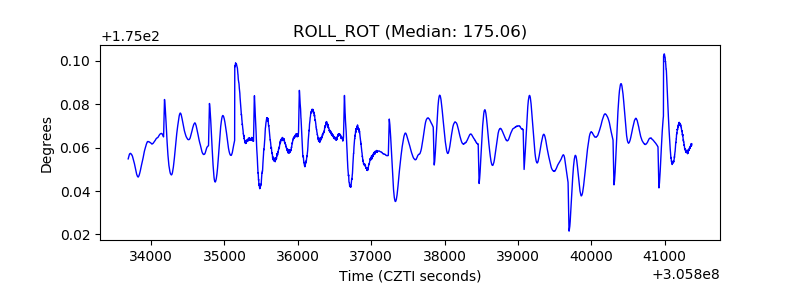 |
| _Roll_DEC | 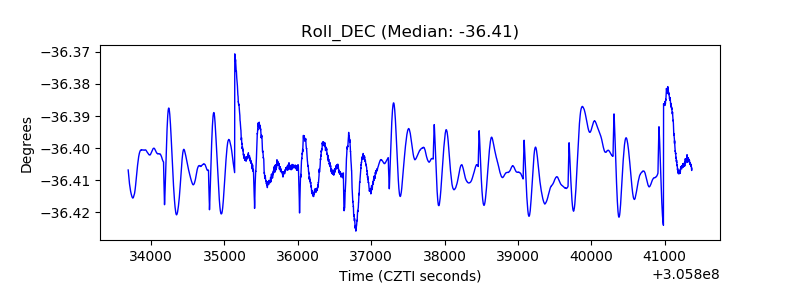 |
| _Roll_RA | 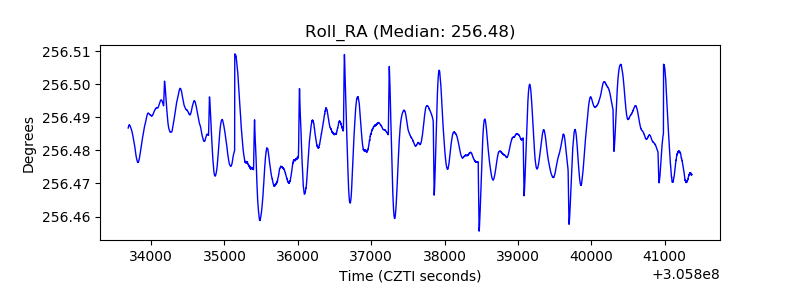 |
| Veto Counter | 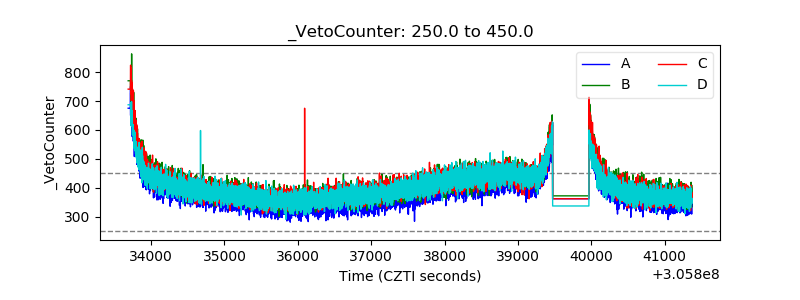 |