| Param | Original file | Final file |
|---|---|---|
| Filename | modeM0/AS1A06_009T05_9000003154_21369cztM0_level2.evt | modeM0/AS1A06_009T05_9000003154_21369cztM0_level2_quad_clean.evt |
| Size (bytes) | 532,848,960 | 108,901,440 |
| Size | 508.2 MB | 103.9 MB |
| Events in quadrant A | 3,640,669 | 709,115 |
| Events in quadrant B | 3,782,439 | 714,104 |
| Events in quadrant C | 3,834,949 | 686,094 |
| Events in quadrant D | 4,371,918 | 668,588 |
| Mode SS | |||
|---|---|---|---|
| Quadrant | BADHDUFLAG | Total packets | Discarded packets |
| A | 0 | 154 | 0 |
| B | 0 | 154 | 0 |
| C | 0 | 154 | 0 |
| D | 0 | 154 | 0 |
| Mode M0 | |||
|---|---|---|---|
| Quadrant | BADHDUFLAG | Total packets | Discarded packets |
| A | 0 | 15600 | 2 |
| B | 0 | 16118 | 2 |
| C | 0 | 16366 | 2 |
| D | 0 | 17955 | 2 |
| Mode M9 | |||
|---|---|---|---|
| Quadrant | BADHDUFLAG | Total packets | Discarded packets |
| A | 0 | 8 | 0 |
| B | 0 | 8 | 0 |
| C | 0 | 8 | 0 |
| D | 0 | 8 | 0 |
| Quadrant | Total seconds | Saturated seconds | Saturation percentage |
|---|---|---|---|
| A | 7475 | 60 | 0.802676% |
| B | 7476 | 108 | 1.444623% |
| C | 7476 | 128 | 1.712146% |
| D | 7476 | 86 | 1.150348% |
Noise dominated data is calculated using 1-second bins in cleaned event files. If a bin has >2000 counts, and if more than 50% of those come from <1% of pixels, then it is considered to be noise-dominated and hence unusable.
| Quadrant | # 1 sec bins | Bins with >0 counts | Bins with >2000 counts | High rate bins dominated by noise | Noise dominated (total time) | Noise dominated (detector-on time) | Marked lightcurve |
|---|---|---|---|---|---|---|---|
| A | 8260 | 7477 | 0 | 0 | 0.00% | 0.00% | 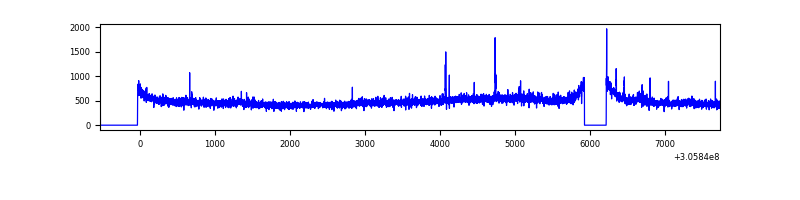 |
| B | 8261 | 7478 | 4 | 4 | 0.05% | 0.05% | 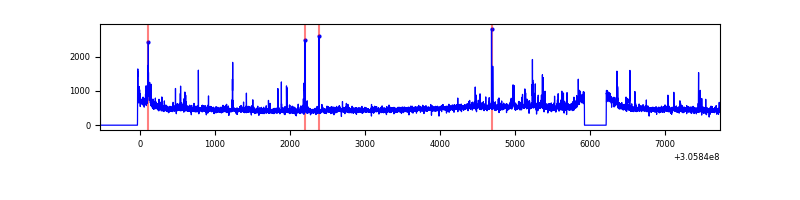 |
| C | 8261 | 7478 | 5 | 5 | 0.06% | 0.07% | 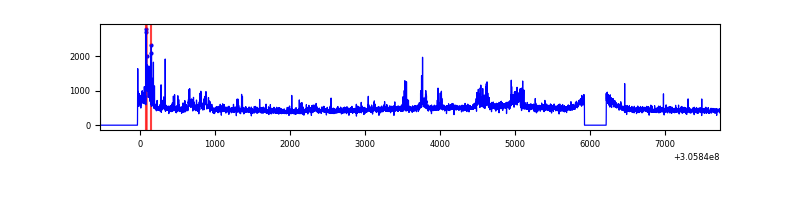 |
| D | 8261 | 7478 | 55 | 55 | 0.67% | 0.74% | 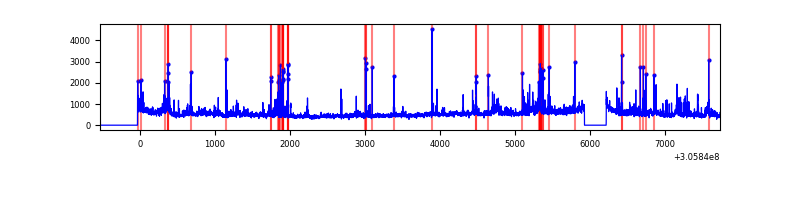 |
Top three noisy pixels from each quadrant. If the there are fewer than three noisy pixels in the level2.evt file, extra rows are filled as -1
| Pixel properties | Quadrant properties | ||||||
|---|---|---|---|---|---|---|---|
| Quadrant | DetID | PixID | Counts | Sigma | Mean | Median | Sigma |
| A | 5 | 168 | 119602 | 649.17 | 904 | 887 | 182.9 |
| A | 15 | 174 | 21028 | 110.14 | 904 | 887 | 182.9 |
| A | 13 | 254 | 12400 | 62.96 | 904 | 887 | 182.9 |
| B | 0 | 190 | 61645 | 352.7 | 900 | 877 | 172.3 |
| B | 0 | 245 | 33660 | 190.27 | 900 | 877 | 172.3 |
| B | 0 | 230 | 27870 | 156.67 | 900 | 877 | 172.3 |
| C | 3 | 233 | 358836 | 1779.35 | 857 | 862 | 201.2 |
| C | 14 | 238 | 133279 | 658.19 | 857 | 862 | 201.2 |
| C | 13 | 61 | 6241 | 26.74 | 857 | 862 | 201.2 |
| D | 12 | 235 | 488105 | 2293.94 | 868 | 844 | 212.4 |
| D | 1 | 52 | 281968 | 1323.48 | 868 | 844 | 212.4 |
| D | 7 | 38 | 133903 | 626.42 | 868 | 844 | 212.4 |
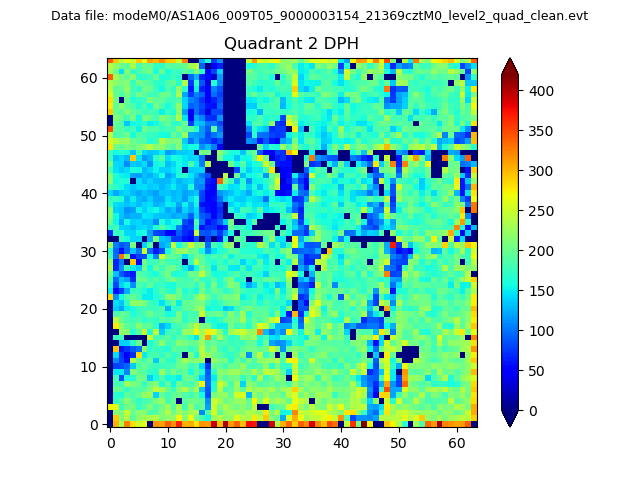
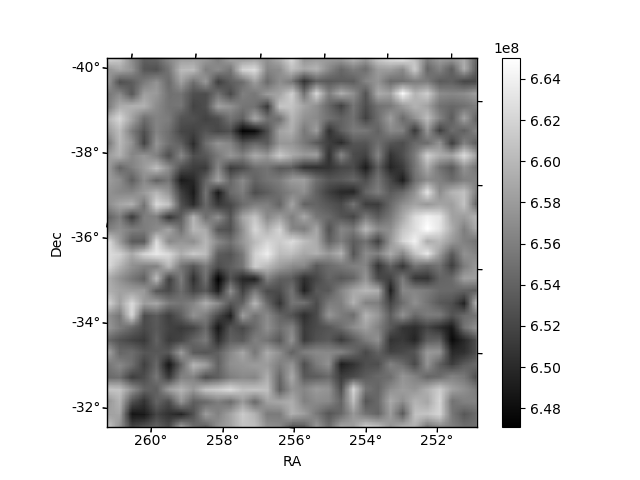
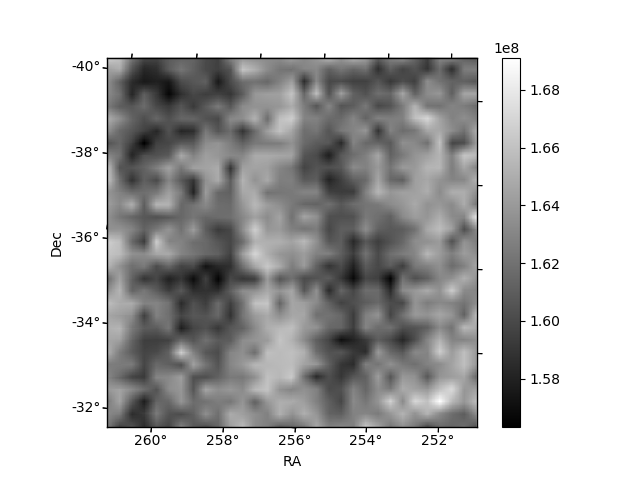
Histogram calculated using DETX and DETY for each event in the final _common_clean file
| Quadrant A | 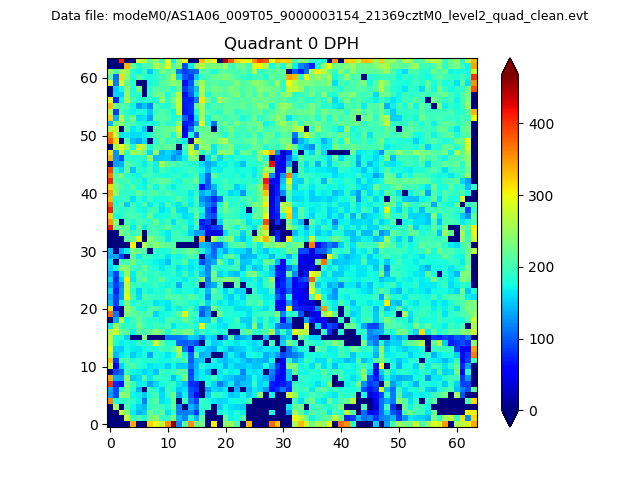 |
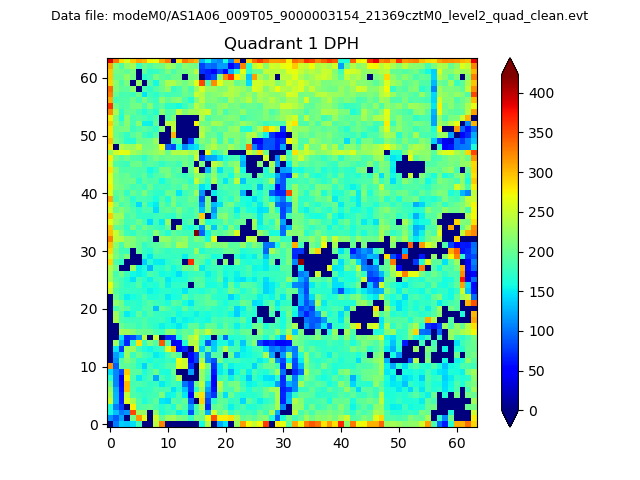 |
Quadrant B |
|---|---|---|---|
| Quadrant D | 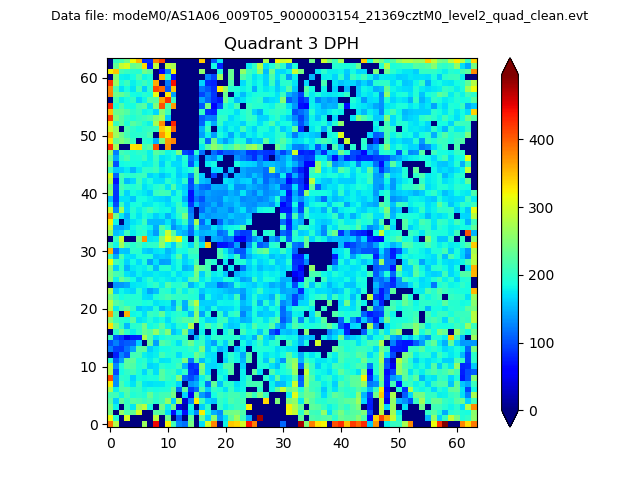 |
 |
Quadrant C |
| Plot type | Count rate plots | Images |
|---|---|---|
| Comparison with Poisson distribution Blue bars denote a histogram of data divided into 1 sec bins. Red curve is a Poisson curve with rate = median count rate of data. |
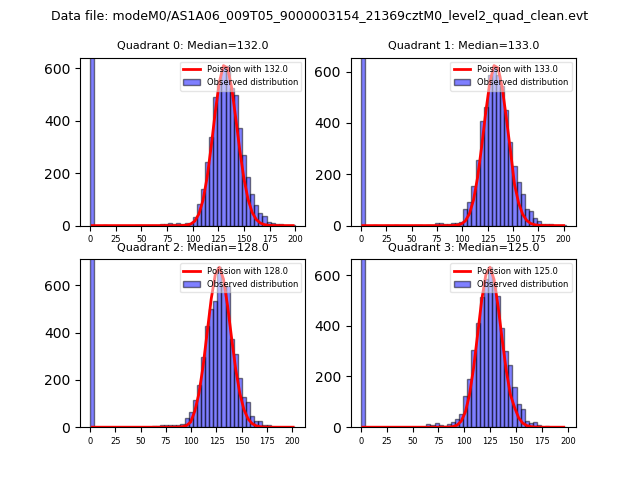 |
 |
| Quadrant-wise count rates Data is divided into 100 sec bins |
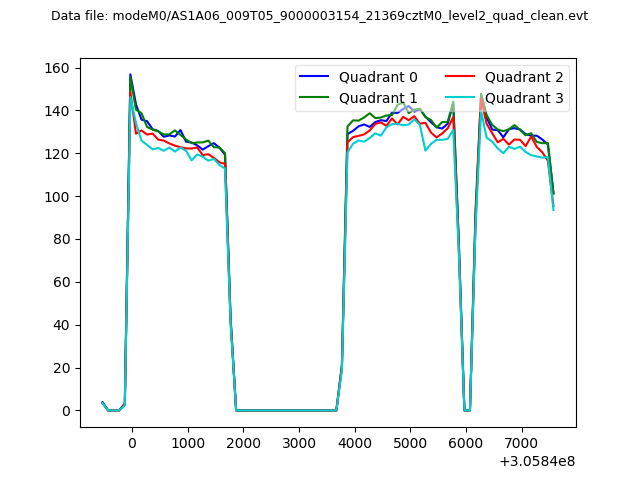 |
|
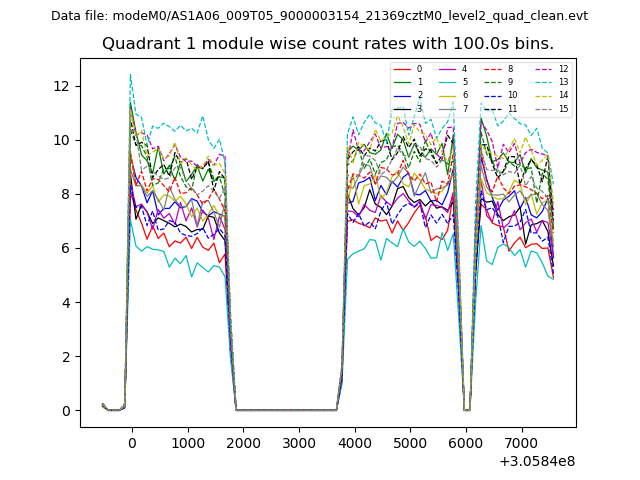
| Module-wise count rates for Quadrant A Data is divided into 100 sec bins |
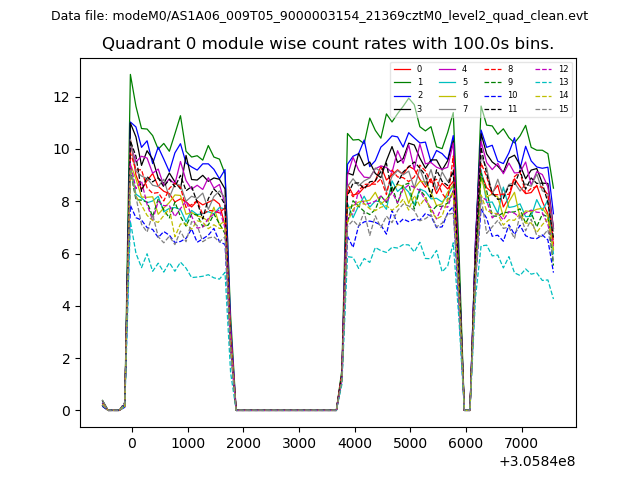 |
 |
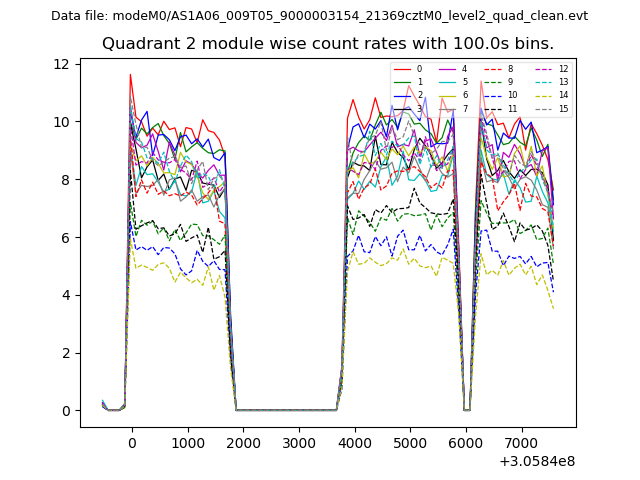
| Module-wise count rates for Quadrant B Data is divided into 100 sec bins |
 |
 |
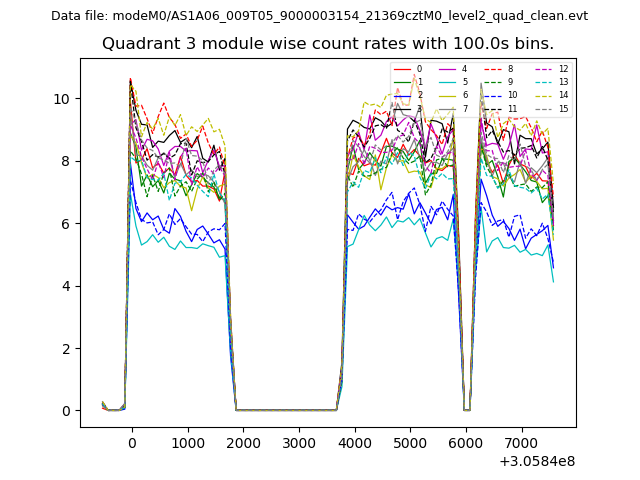
| Module-wise count rates for Quadrant C Data is divided into 100 sec bins |
 |
 |
| Module-wise count rates for Quadrant D Data is divided into 100 sec bins |
 |
 |
| Parameter | Plot |
|---|---|
| CZT HV Monitor | 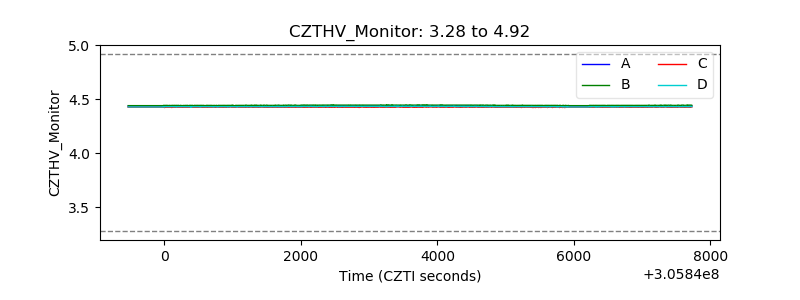 |
| D_VDD | 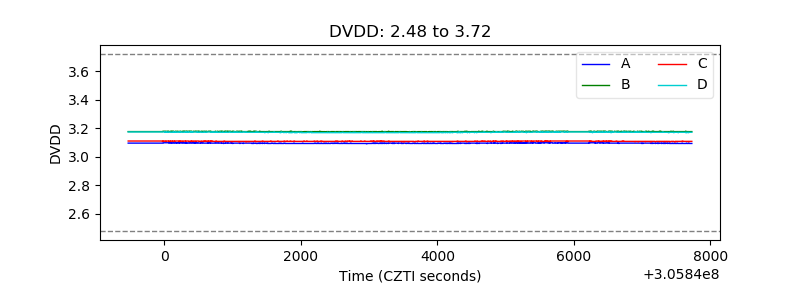 |
| Temperature 1 | 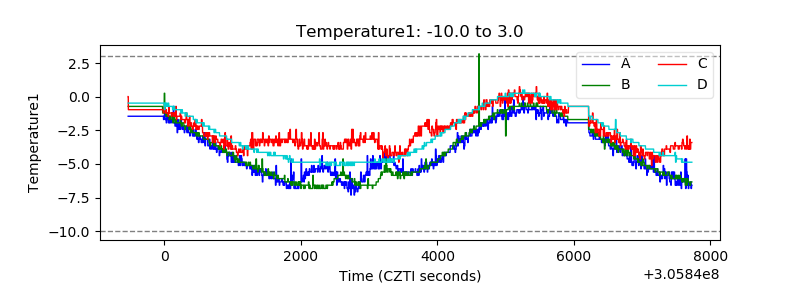 |
| Veto HV Monitor | 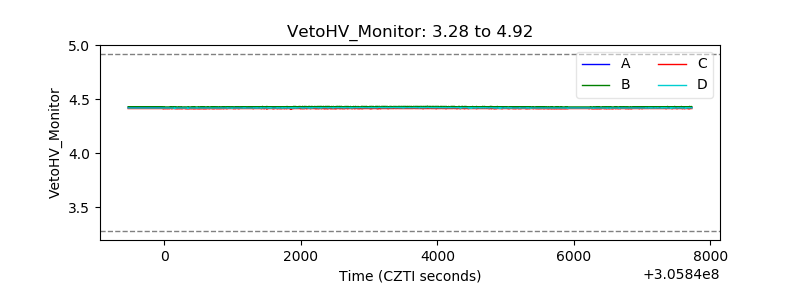 |
| Veto LLD | 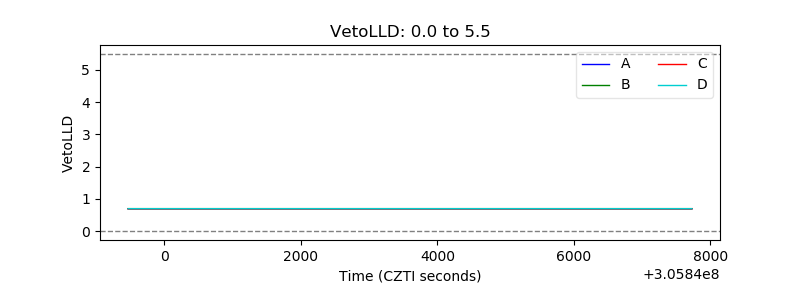 |
| Alpha Counter | 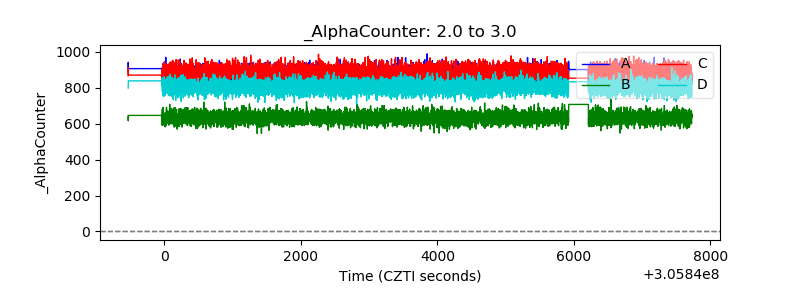 |
| _CPM_Rate | 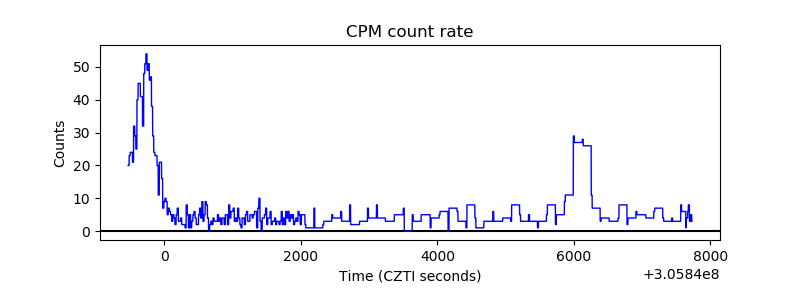 |
| CZT Counter | 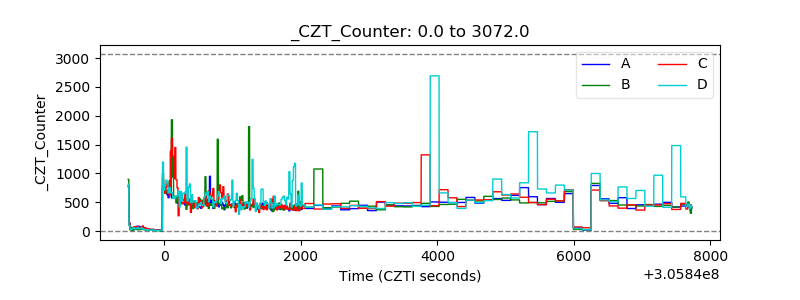 |
| +2.5 Volts monitor |  |
| +5 Volts monitor | 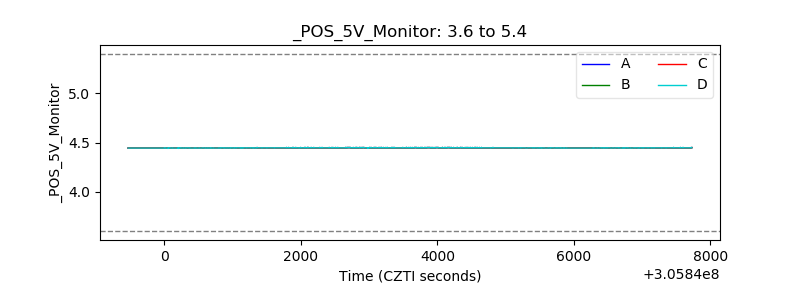 |
| _ROLL_ROT |  |
| _Roll_DEC | 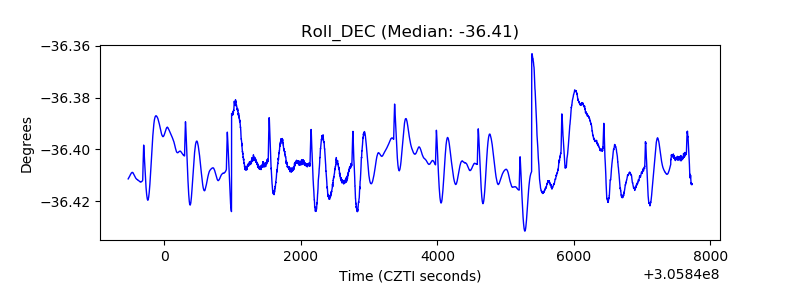 |
| _Roll_RA | 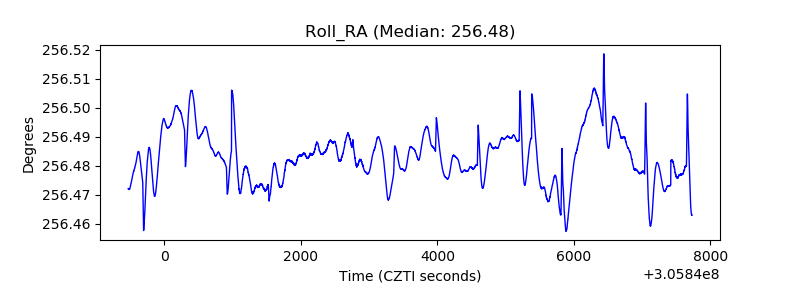 |
| Veto Counter | 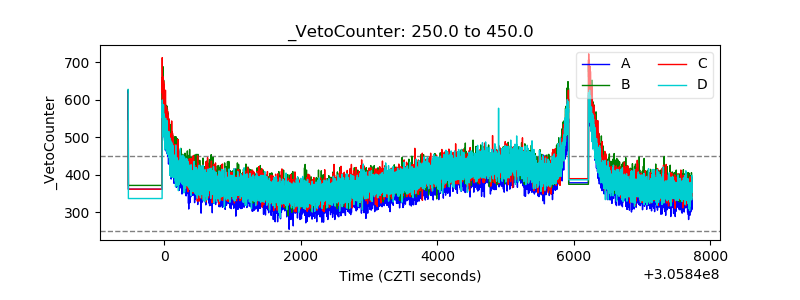 |