| Param | Original file | Final file |
|---|---|---|
| Filename | modeM0/AS1A06_009T05_9000003154_21370cztM0_level2.evt | modeM0/AS1A06_009T05_9000003154_21370cztM0_level2_quad_clean.evt |
| Size (bytes) | 519,546,240 | 97,280,640 |
| Size | 495.5 MB | 92.8 MB |
| Events in quadrant A | 3,603,683 | 619,831 |
| Events in quadrant B | 3,649,227 | 624,279 |
| Events in quadrant C | 3,407,937 | 601,644 |
| Events in quadrant D | 4,570,029 | 583,979 |
| Mode SS | |||
|---|---|---|---|
| Quadrant | BADHDUFLAG | Total packets | Discarded packets |
| A | 0 | 150 | 0 |
| B | 0 | 150 | 0 |
| C | 0 | 150 | 0 |
| D | 0 | 150 | 0 |
| Mode M0 | |||
|---|---|---|---|
| Quadrant | BADHDUFLAG | Total packets | Discarded packets |
| A | 0 | 15485 | 1 |
| B | 0 | 15688 | 1 |
| C | 0 | 15107 | 2 |
| D | 0 | 18555 | 1 |
| Mode M9 | |||
|---|---|---|---|
| Quadrant | BADHDUFLAG | Total packets | Discarded packets |
| A | 0 | 4 | 0 |
| B | 0 | 4 | 0 |
| C | 0 | 4 | 0 |
| D | 0 | 4 | 0 |
| Quadrant | Total seconds | Saturated seconds | Saturation percentage |
|---|---|---|---|
| A | 7420 | 29 | 0.390836% |
| B | 7420 | 34 | 0.458221% |
| C | 7419 | 39 | 0.525677% |
| D | 7420 | 145 | 1.954178% |
Noise dominated data is calculated using 1-second bins in cleaned event files. If a bin has >2000 counts, and if more than 50% of those come from <1% of pixels, then it is considered to be noise-dominated and hence unusable.
| Quadrant | # 1 sec bins | Bins with >0 counts | Bins with >2000 counts | High rate bins dominated by noise | Noise dominated (total time) | Noise dominated (detector-on time) | Marked lightcurve |
|---|---|---|---|---|---|---|---|
| A | 7845 | 7421 | 6 | 6 | 0.08% | 0.08% | 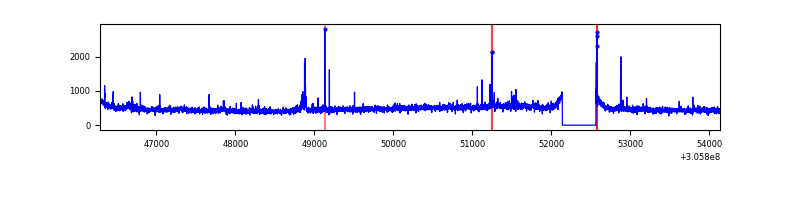 |
| B | 7845 | 7420 | 0 | 0 | 0.00% | 0.00% | 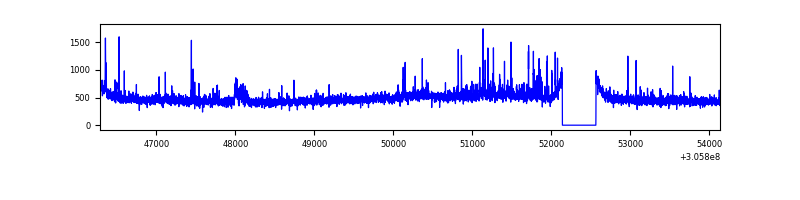 |
| C | 7844 | 7420 | 1 | 1 | 0.01% | 0.01% | 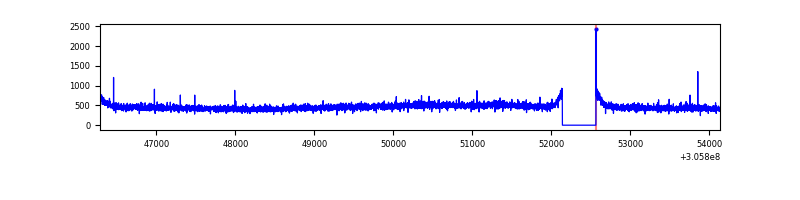 |
| D | 7845 | 7421 | 114 | 114 | 1.45% | 1.54% | 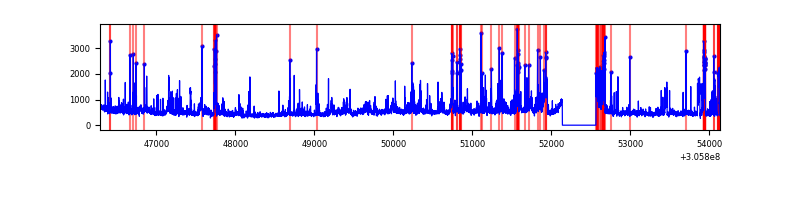 |
Top three noisy pixels from each quadrant. If the there are fewer than three noisy pixels in the level2.evt file, extra rows are filled as -1
| Pixel properties | Quadrant properties | ||||||
|---|---|---|---|---|---|---|---|
| Quadrant | DetID | PixID | Counts | Sigma | Mean | Median | Sigma |
| A | 5 | 168 | 112481 | 630.42 | 880 | 862 | 177.1 |
| A | 5 | 16 | 76874 | 429.31 | 880 | 862 | 177.1 |
| A | 15 | 174 | 14093 | 74.73 | 880 | 862 | 177.1 |
| B | 0 | 230 | 66961 | 391.7 | 880 | 858 | 168.8 |
| B | 0 | 190 | 39641 | 229.81 | 880 | 858 | 168.8 |
| B | 12 | 111 | 20063 | 113.8 | 880 | 858 | 168.8 |
| C | 14 | 238 | 130717 | 657.29 | 838 | 842 | 197.6 |
| C | 10 | 91 | 6198 | 27.11 | 838 | 842 | 197.6 |
| C | 13 | 61 | 5961 | 25.91 | 838 | 842 | 197.6 |
| D | 1 | 52 | 645172 | 3130.26 | 843 | 817 | 205.8 |
| D | 12 | 235 | 288801 | 1399.02 | 843 | 817 | 205.8 |
| D | 13 | 153 | 102563 | 494.28 | 843 | 817 | 205.8 |
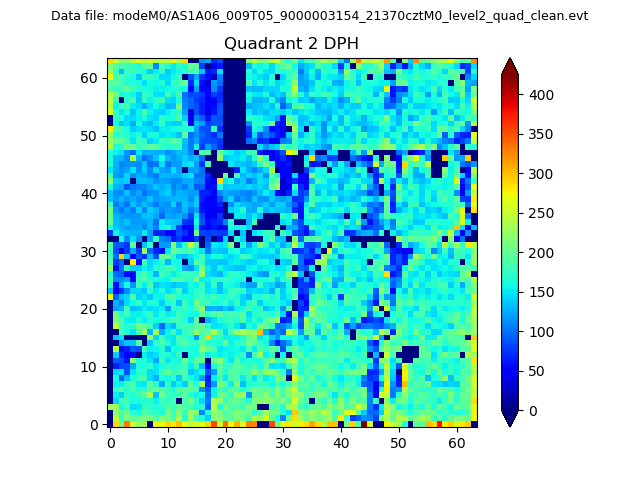
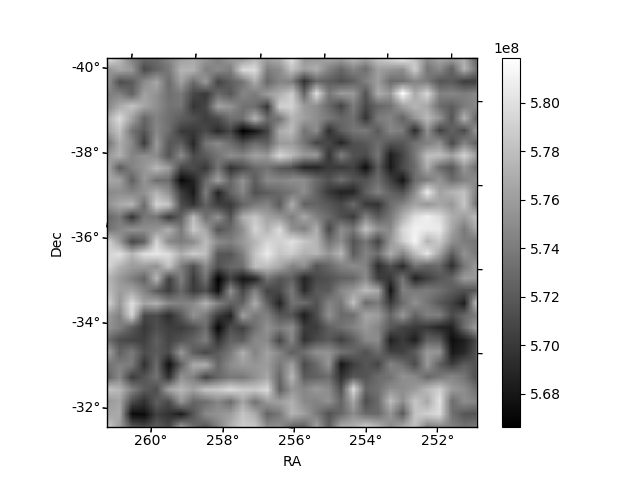
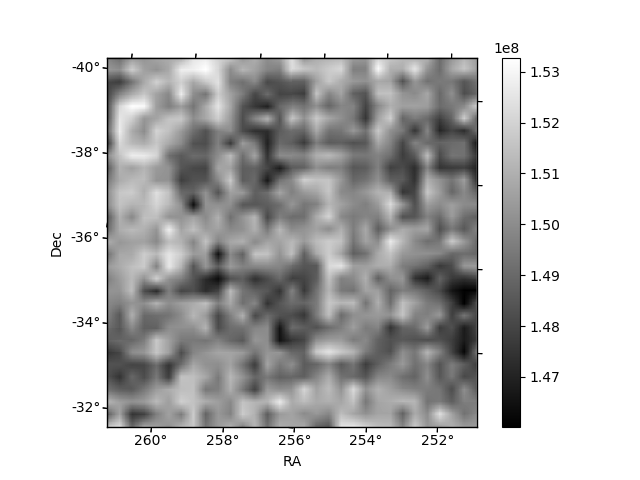
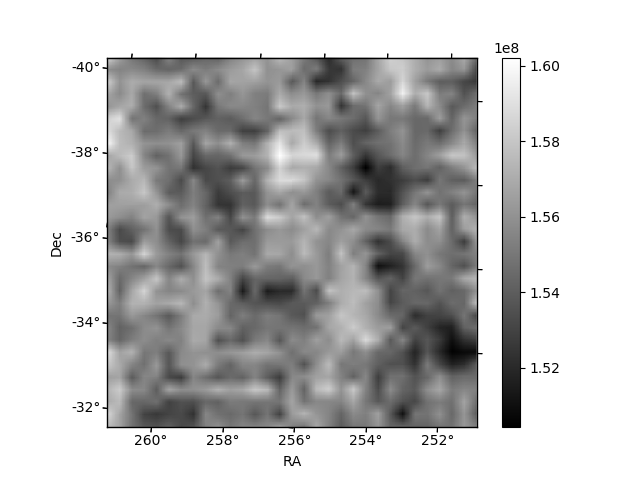
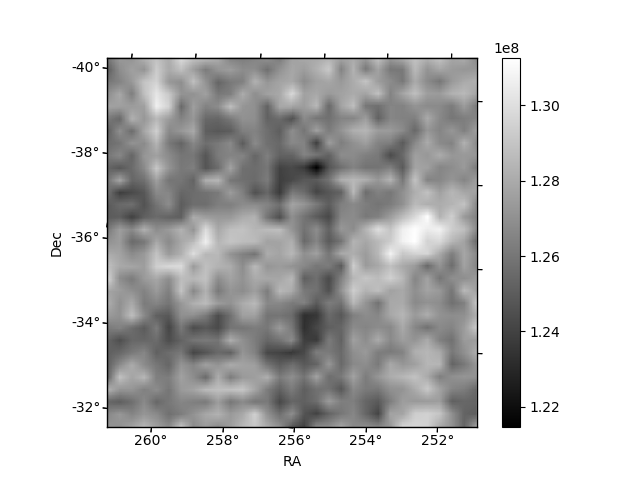
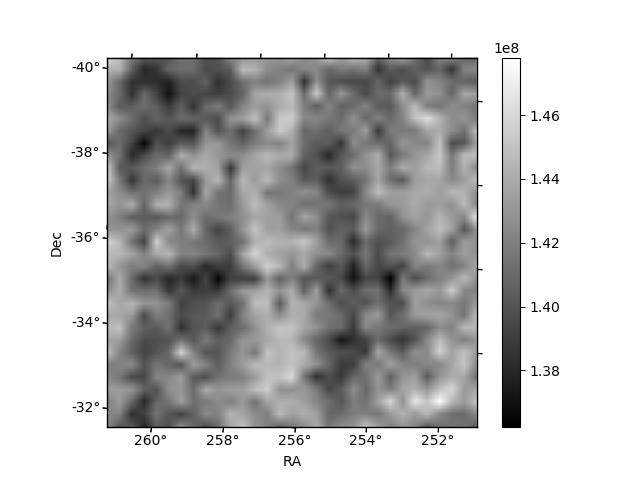
Histogram calculated using DETX and DETY for each event in the final _common_clean file
| Quadrant A | 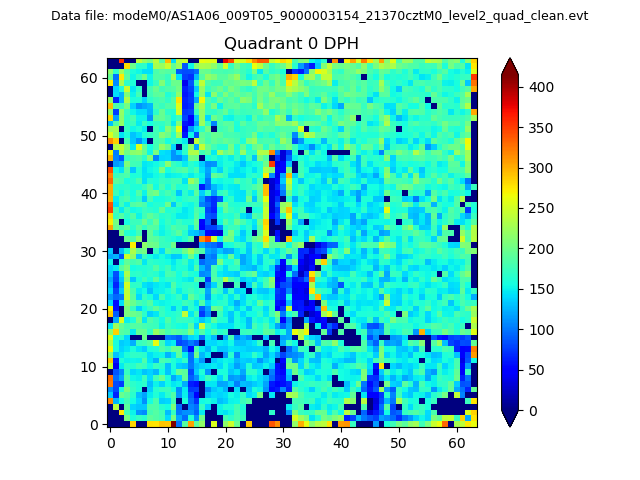 |
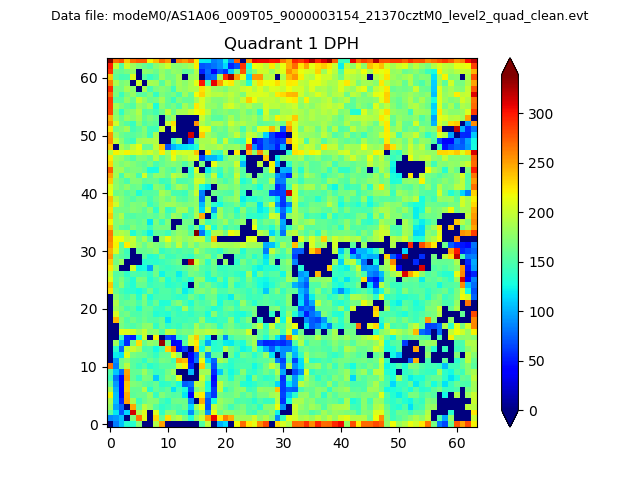 |
Quadrant B |
|---|---|---|---|
| Quadrant D | 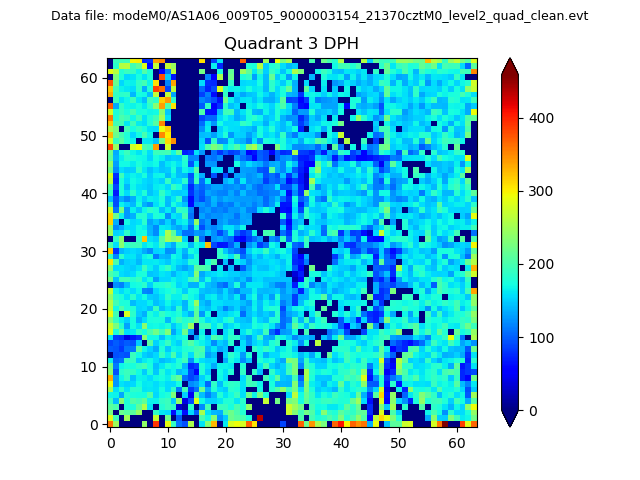 |
 |
Quadrant C |
| Plot type | Count rate plots | Images |
|---|---|---|
| Comparison with Poisson distribution Blue bars denote a histogram of data divided into 1 sec bins. Red curve is a Poisson curve with rate = median count rate of data. |
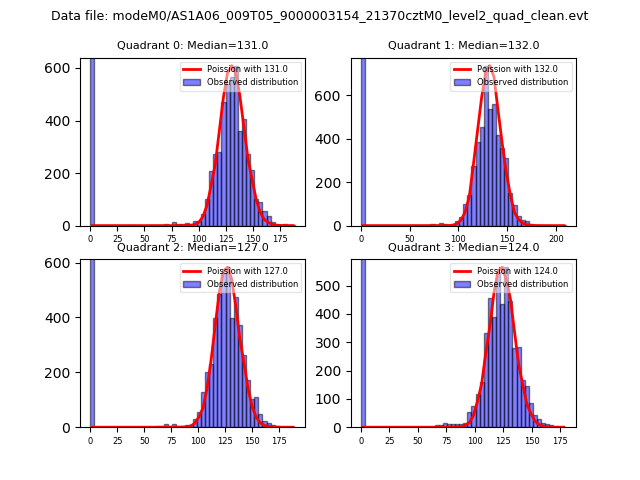 |
 |
| Quadrant-wise count rates Data is divided into 100 sec bins |
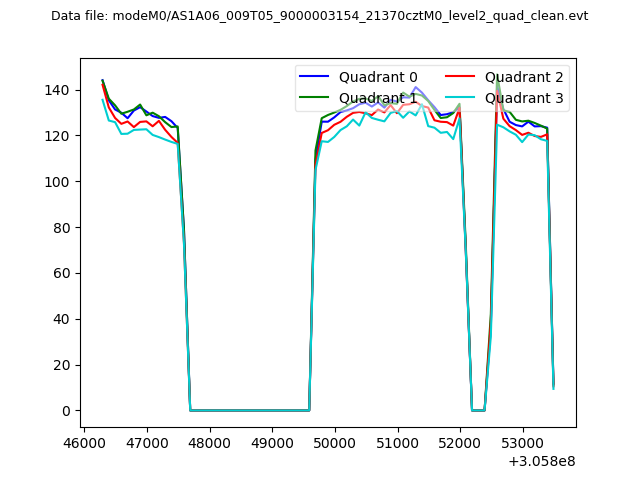 |
|
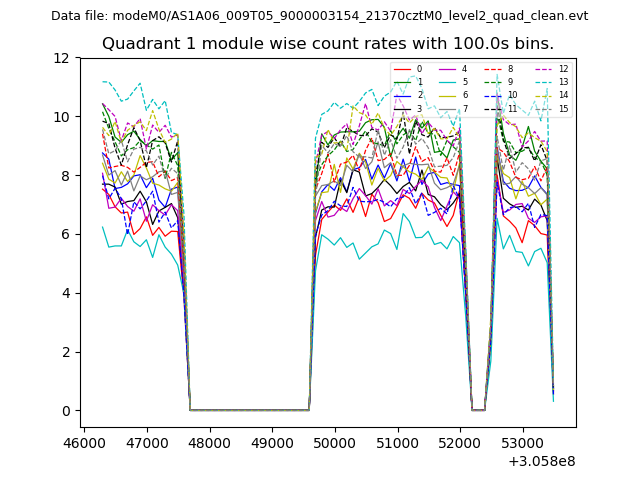
| Module-wise count rates for Quadrant A Data is divided into 100 sec bins |
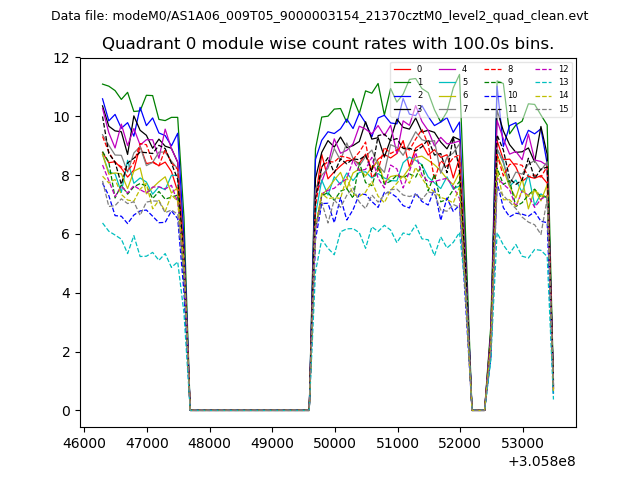 |
 |
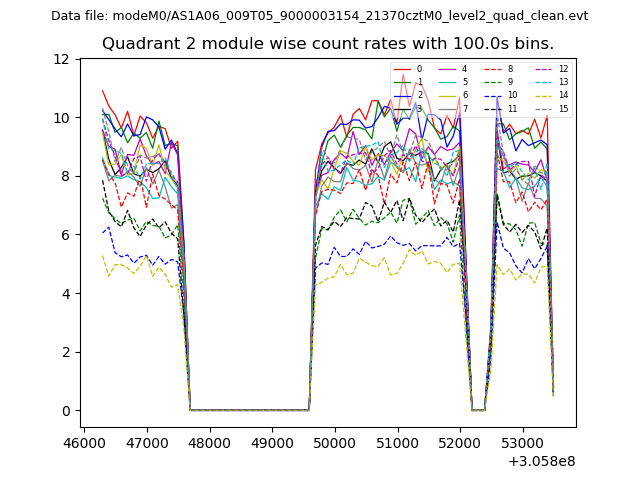
| Module-wise count rates for Quadrant B Data is divided into 100 sec bins |
 |
 |
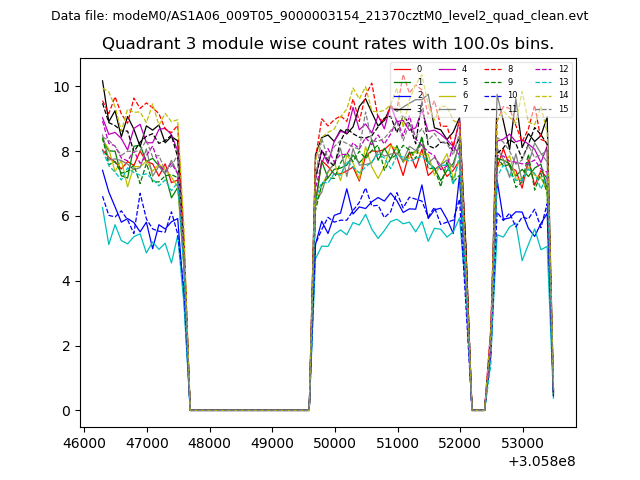
| Module-wise count rates for Quadrant C Data is divided into 100 sec bins |
 |
 |
| Module-wise count rates for Quadrant D Data is divided into 100 sec bins |
 |
 |
| Parameter | Plot |
|---|---|
| CZT HV Monitor | 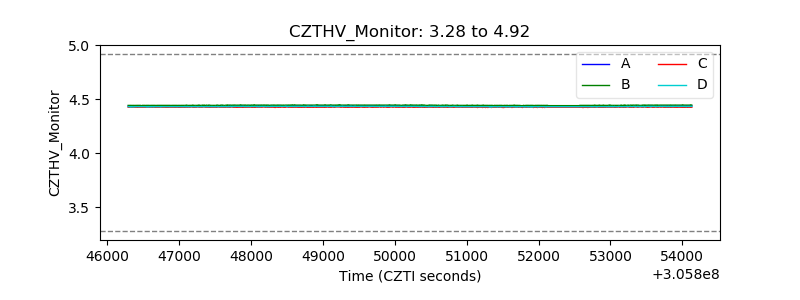 |
| D_VDD | 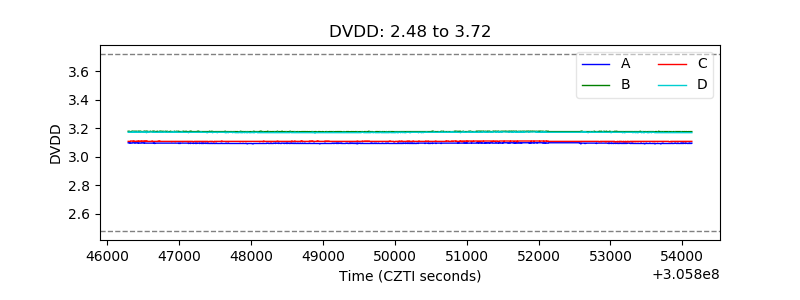 |
| Temperature 1 | 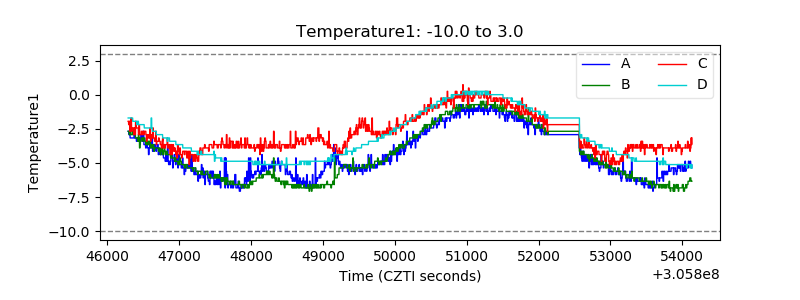 |
| Veto HV Monitor |  |
| Veto LLD | 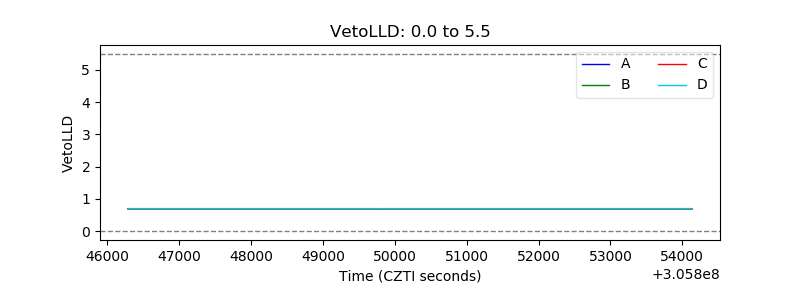 |
| Alpha Counter | 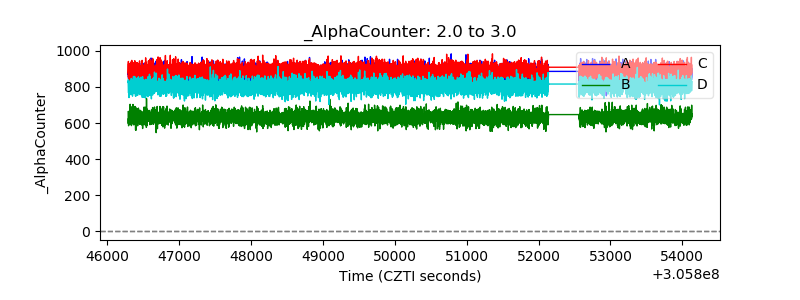 |
| _CPM_Rate |  |
| CZT Counter | 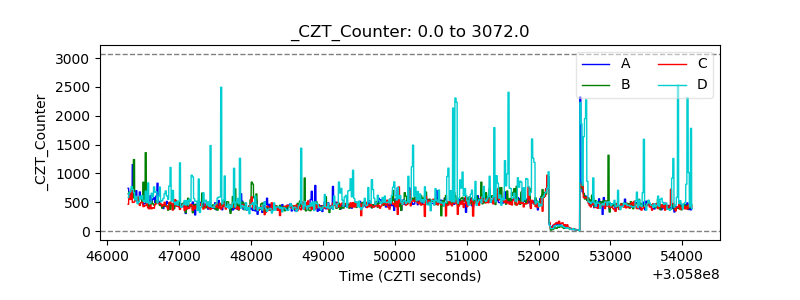 |
| +2.5 Volts monitor |  |
| +5 Volts monitor |  |
| _ROLL_ROT | 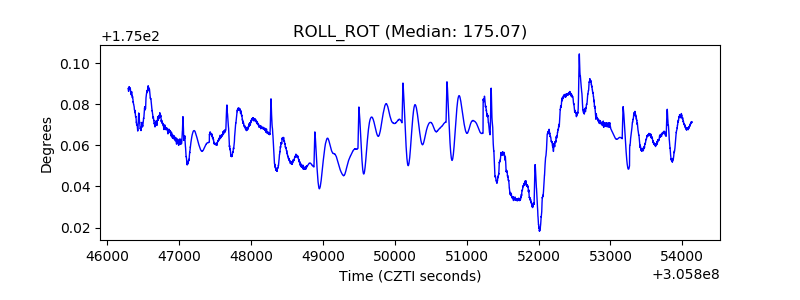 |
| _Roll_DEC | 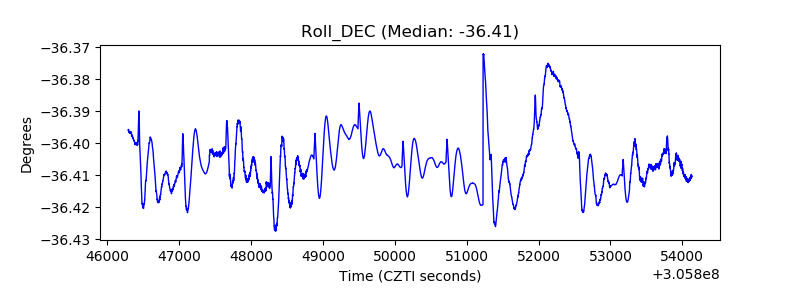 |
| _Roll_RA | 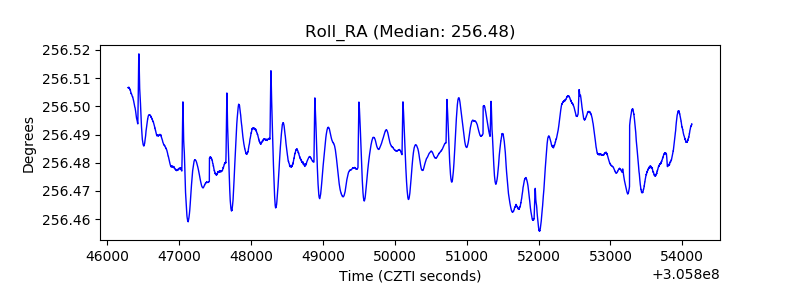 |
| Veto Counter | 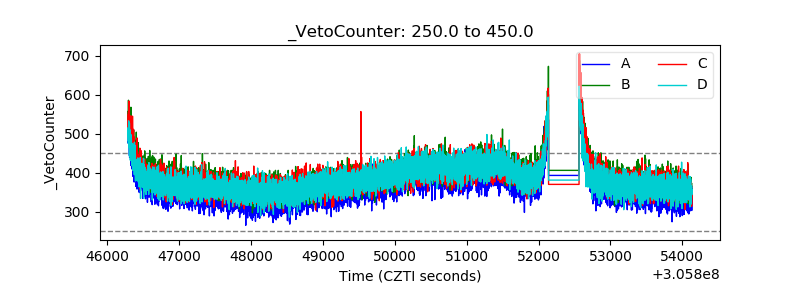 |