| Param | Original file | Final file |
|---|---|---|
| Filename | modeM0/AS1A06_009T05_9000003154_21373cztM0_level2.evt | modeM0/AS1A06_009T05_9000003154_21373cztM0_level2_quad_clean.evt |
| Size (bytes) | 414,296,640 | 73,834,560 |
| Size | 395.1 MB | 70.4 MB |
| Events in quadrant A | 2,675,045 | 470,349 |
| Events in quadrant B | 2,717,677 | 474,214 |
| Events in quadrant C | 2,647,882 | 457,049 |
| Events in quadrant D | 4,121,423 | 438,086 |
| Mode SS | |||
|---|---|---|---|
| Quadrant | BADHDUFLAG | Total packets | Discarded packets |
| A | 0 | 114 | 0 |
| B | 0 | 114 | 0 |
| C | 0 | 114 | 0 |
| D | 0 | 114 | 0 |
| Mode M0 | |||
|---|---|---|---|
| Quadrant | BADHDUFLAG | Total packets | Discarded packets |
| A | 0 | 11533 | 1 |
| B | 0 | 11717 | 1 |
| C | 0 | 11606 | 1 |
| D | 0 | 16094 | 1 |
| Mode M9 | |||
|---|---|---|---|
| Quadrant | BADHDUFLAG | Total packets | Discarded packets |
| A | 0 | 1 | 0 |
| B | 0 | 2 | 0 |
| C | 0 | 2 | 0 |
| D | 0 | 2 | 0 |
| Quadrant | Total seconds | Saturated seconds | Saturation percentage |
|---|---|---|---|
| A | 5658 | 19 | 0.335808% |
| B | 5658 | 14 | 0.247437% |
| C | 5658 | 47 | 0.830682% |
| D | 5658 | 231 | 4.082715% |
Noise dominated data is calculated using 1-second bins in cleaned event files. If a bin has >2000 counts, and if more than 50% of those come from <1% of pixels, then it is considered to be noise-dominated and hence unusable.
| Quadrant | # 1 sec bins | Bins with >0 counts | Bins with >2000 counts | High rate bins dominated by noise | Noise dominated (total time) | Noise dominated (detector-on time) | Marked lightcurve |
|---|---|---|---|---|---|---|---|
| A | 5658 | 5658 | 3 | 3 | 0.05% | 0.05% | 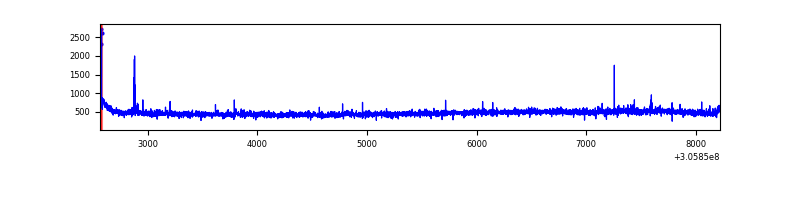 |
| B | 5658 | 5658 | 1 | 1 | 0.02% | 0.02% | 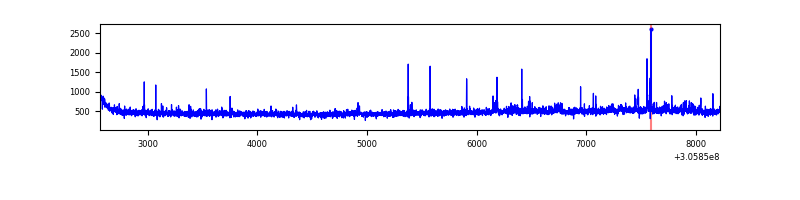 |
| C | 5658 | 5658 | 21 | 21 | 0.37% | 0.37% | 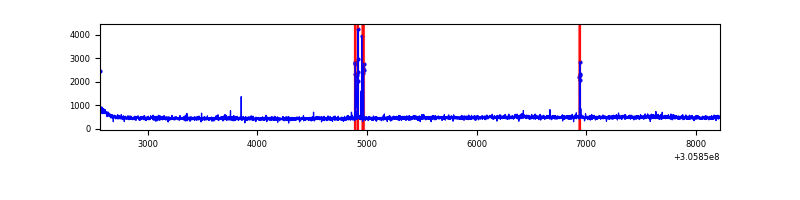 |
| D | 5658 | 5658 | 198 | 198 | 3.50% | 3.50% | 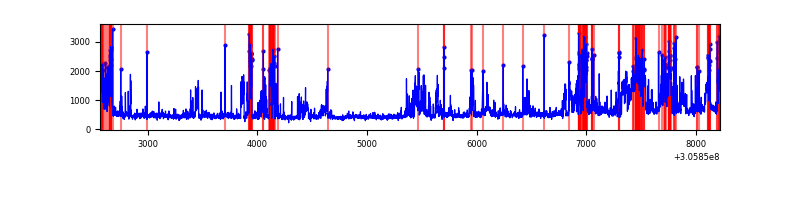 |
Top three noisy pixels from each quadrant. If the there are fewer than three noisy pixels in the level2.evt file, extra rows are filled as -1
| Pixel properties | Quadrant properties | ||||||
|---|---|---|---|---|---|---|---|
| Quadrant | DetID | PixID | Counts | Sigma | Mean | Median | Sigma |
| A | 5 | 168 | 62772 | 459.64 | 669 | 655 | 135.1 |
| A | 5 | 16 | 26354 | 190.16 | 669 | 655 | 135.1 |
| A | 13 | 254 | 8270 | 56.35 | 669 | 655 | 135.1 |
| B | 0 | 230 | 27255 | 207.46 | 666 | 649 | 128.2 |
| B | 3 | 64 | 22722 | 172.11 | 666 | 649 | 128.2 |
| B | 0 | 190 | 21736 | 164.42 | 666 | 649 | 128.2 |
| C | 14 | 238 | 99383 | 656.1 | 634 | 637 | 150.5 |
| C | 14 | 128 | 67762 | 446.0 | 634 | 637 | 150.5 |
| C | 10 | 91 | 5606 | 33.01 | 634 | 637 | 150.5 |
| D | 1 | 52 | 1007004 | 6505.19 | 636 | 619 | 154.7 |
| D | 12 | 235 | 235360 | 1517.35 | 636 | 619 | 154.7 |
| D | 13 | 153 | 182753 | 1177.3 | 636 | 619 | 154.7 |
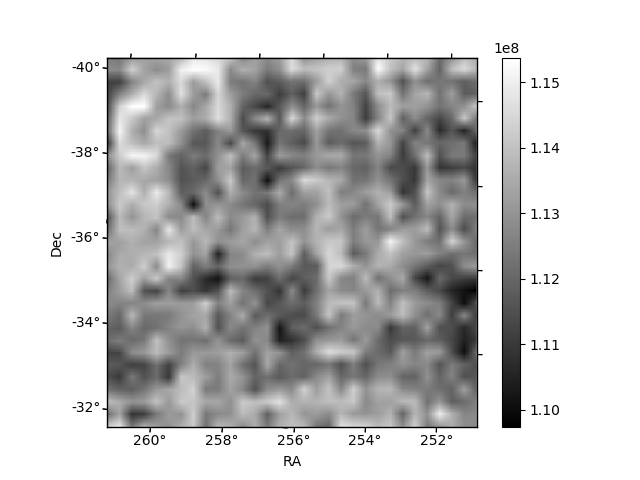
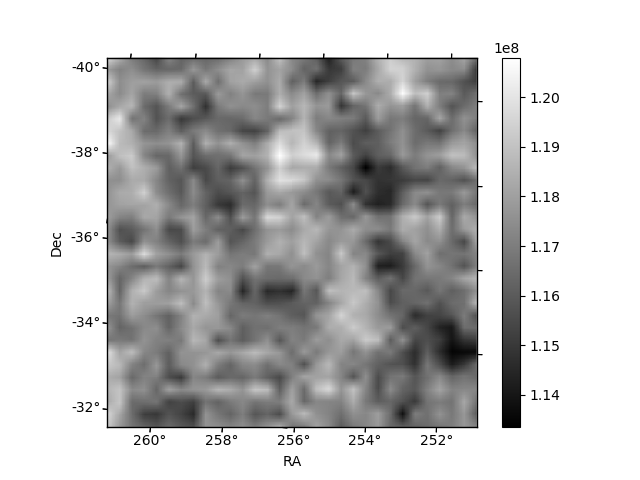
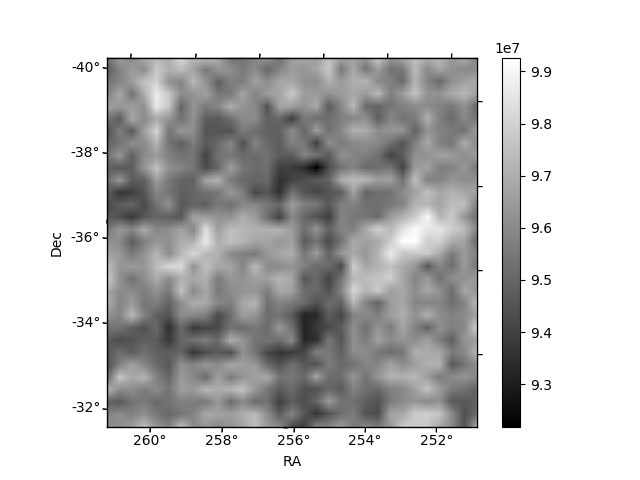
Histogram calculated using DETX and DETY for each event in the final _common_clean file
| Quadrant A | 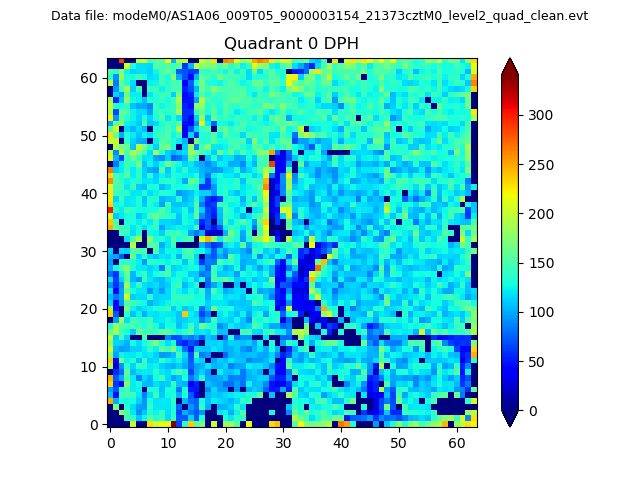 |
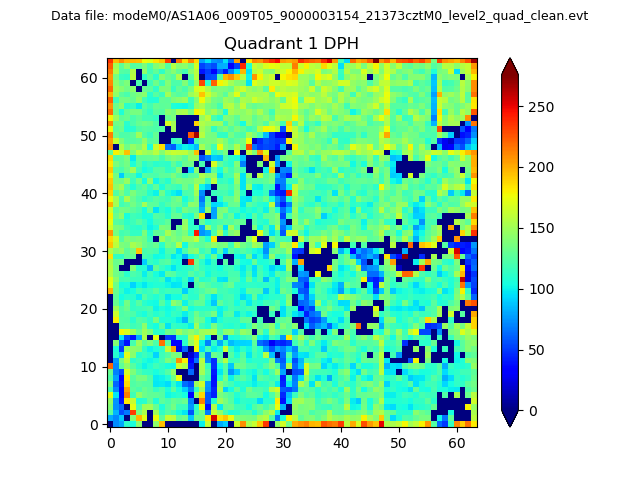 |
Quadrant B |
|---|---|---|---|
| Quadrant D | 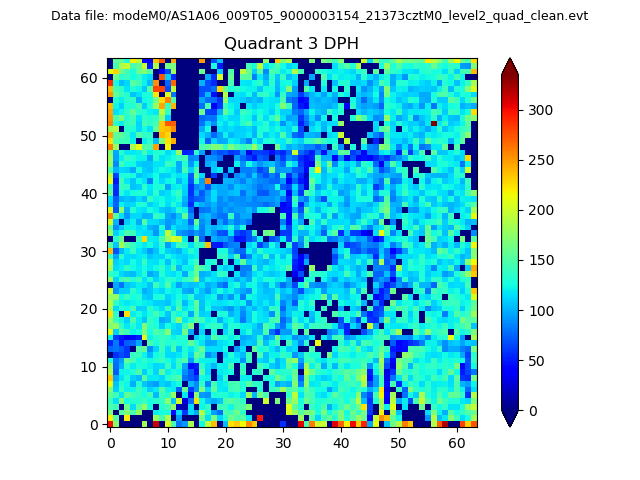 |
 |
Quadrant C |
| Plot type | Count rate plots | Images |
|---|---|---|
| Comparison with Poisson distribution Blue bars denote a histogram of data divided into 1 sec bins. Red curve is a Poisson curve with rate = median count rate of data. |
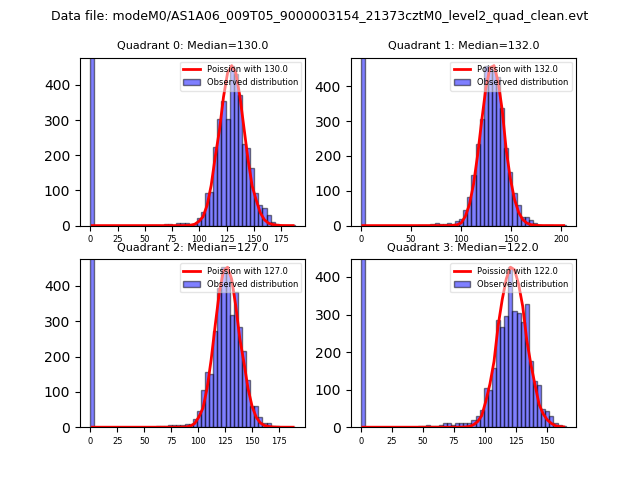 |
 |
| Quadrant-wise count rates Data is divided into 100 sec bins |
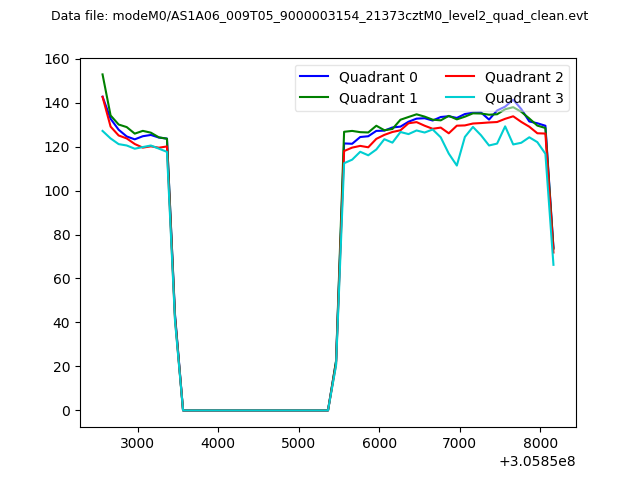 |
|
| Module-wise count rates for Quadrant A Data is divided into 100 sec bins |
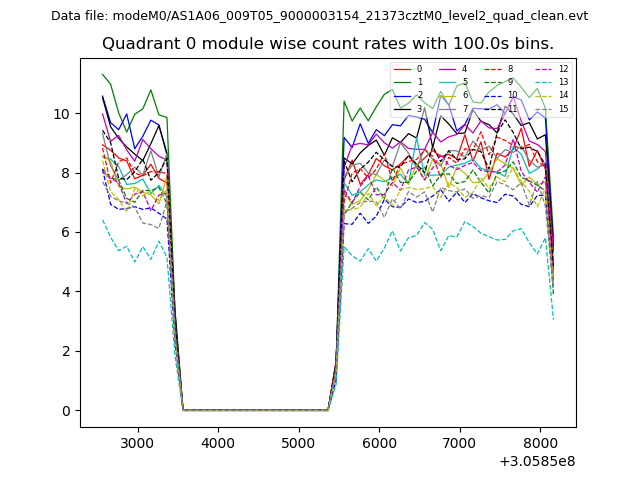 |
 |
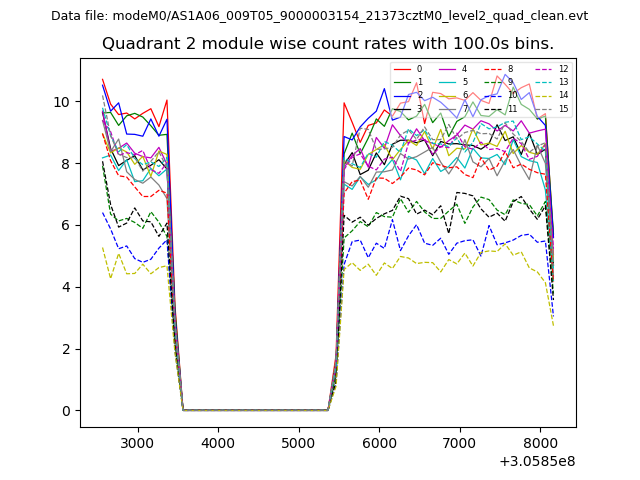
| Module-wise count rates for Quadrant B Data is divided into 100 sec bins |
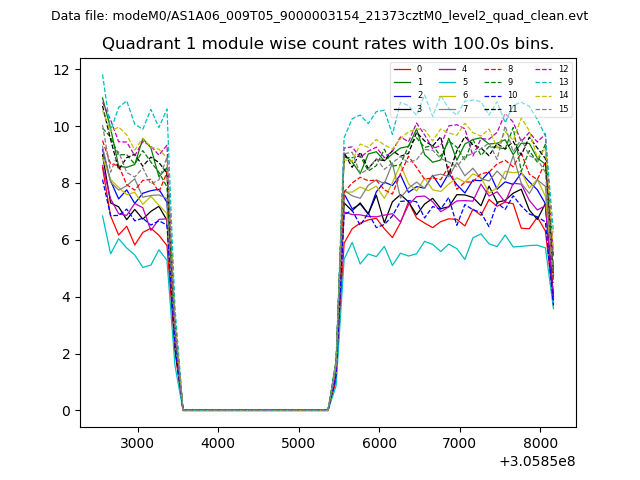 |
 |
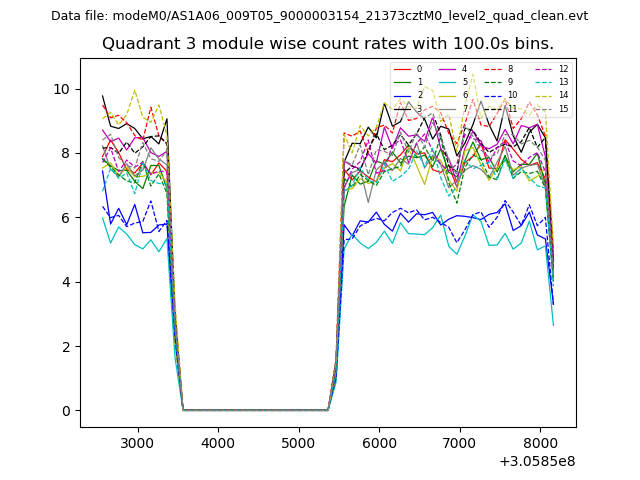
| Module-wise count rates for Quadrant C Data is divided into 100 sec bins |
 |
 |
| Module-wise count rates for Quadrant D Data is divided into 100 sec bins |
 |
 |
| Parameter | Plot |
|---|---|
| CZT HV Monitor | 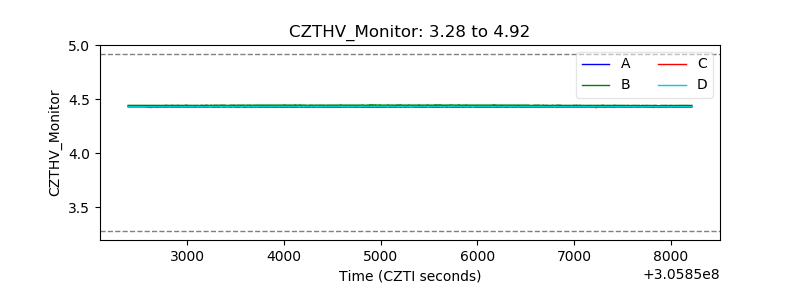 |
| D_VDD | 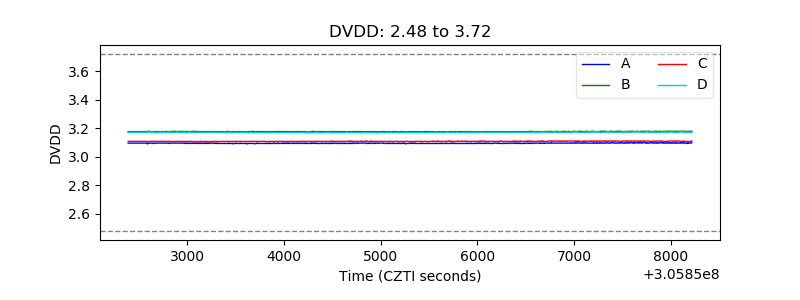 |
| Temperature 1 | 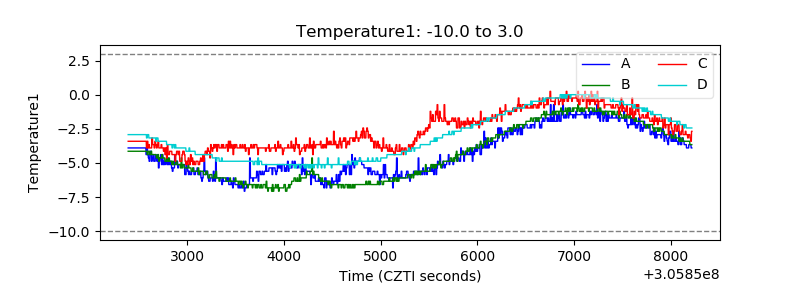 |
| Veto HV Monitor | 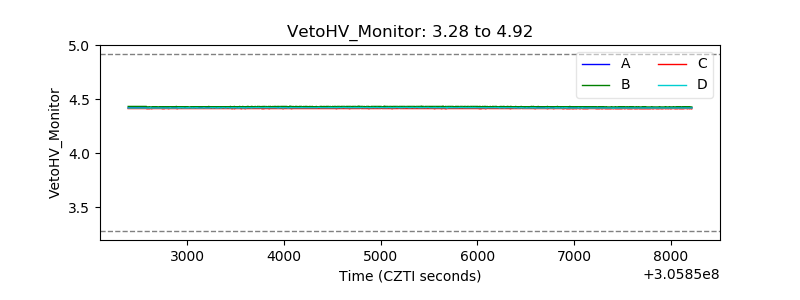 |
| Veto LLD | 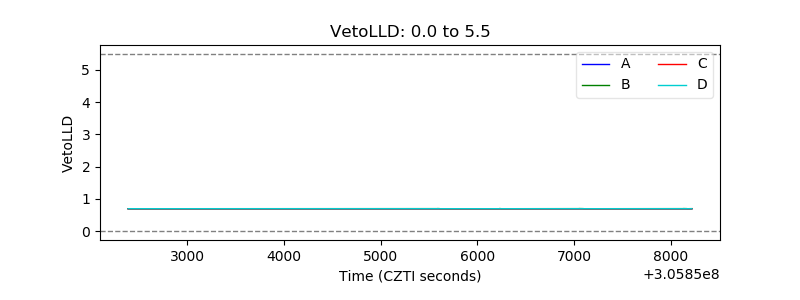 |
| Alpha Counter | 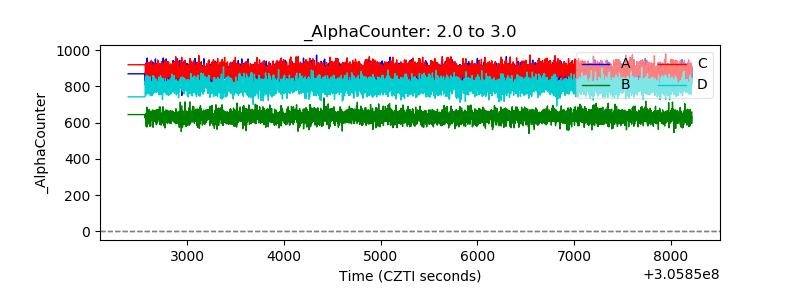 |
| _CPM_Rate | 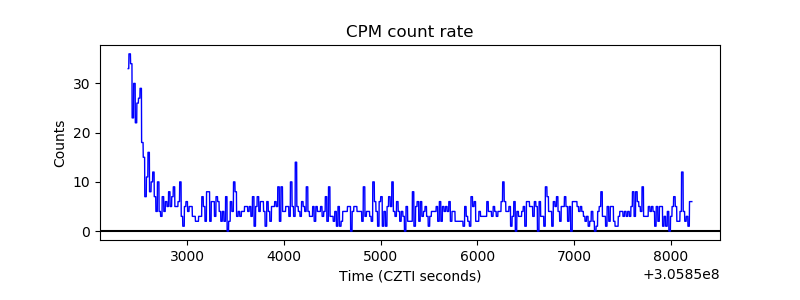 |
| CZT Counter |  |
| +2.5 Volts monitor |  |
| +5 Volts monitor |  |
| _ROLL_ROT | 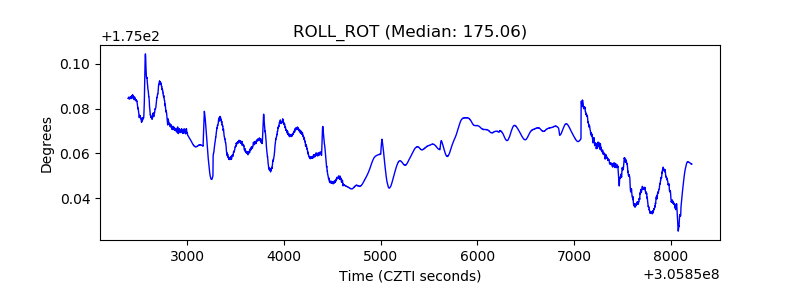 |
| _Roll_DEC | 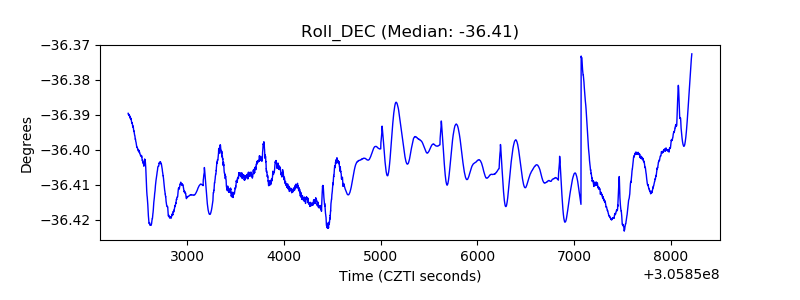 |
| _Roll_RA |  |
| Veto Counter | 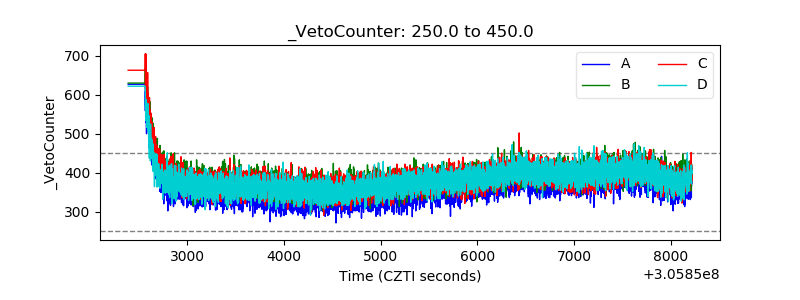 |