| Param | Original file | Final file |
|---|---|---|
| Filename | modeM0/AS1C04_001T01_9000003156cztM0_level2.fits | modeM0/AS1C04_001T01_9000003156cztM0_level2_quad_clean.evt |
| Size (bytes) | 850,464,000 | 952,629,120 |
| Size | 811.1 MB | 908.5 MB |
| Events in quadrant A | 5,264,282 | 6,079,087 |
| Events in quadrant B | 5,012,776 | 6,080,719 |
| Events in quadrant C | 5,006,508 | 5,486,314 |
| Events in quadrant D | 4,357,368 | 5,093,835 |
| Mode M0 | |||
|---|---|---|---|
| Quadrant | BADHDUFLAG | Total packets | Discarded packets |
| A | 0 | 192449 | 0 |
| B | 0 | 190736 | 0 |
| C | 0 | 225113 | 0 |
| D | 0 | 250004 | 0 |
| Mode M9 | |||
|---|---|---|---|
| Quadrant | BADHDUFLAG | Total packets | Discarded packets |
| A | 0 | 142 | 0 |
| B | 0 | 142 | 0 |
| C | 0 | 142 | 0 |
| D | 0 | 142 | 0 |
| Mode SS | |||
|---|---|---|---|
| Quadrant | BADHDUFLAG | Total packets | Discarded packets |
| A | 0 | 1814 | 0 |
| B | 0 | 1814 | 0 |
| C | 0 | 1814 | 0 |
| D | 0 | 1814 | 0 |
| Quadrant | Total seconds | Saturated seconds | Saturation percentage |
|---|---|---|---|
| A | 89156 | 1204 | 1.350442% |
| B | 89156 | 1001 | 1.122751% |
| C | 89155 | 4214 | 4.726600% |
| D | 89155 | 5708 | 6.402333% |
Noise dominated data is calculated using 1-second bins in cleaned event files. If a bin has >2000 counts, and if more than 50% of those come from <1% of pixels, then it is considered to be noise-dominated and hence unusable.
| Quadrant | # 1 sec bins | Bins with >0 counts | Bins with >2000 counts | High rate bins dominated by noise | Noise dominated (total time) | Noise dominated (detector-on time) | Marked lightcurve |
|---|---|---|---|---|---|---|---|
| A | 110535 | 89129 | 0 | 0 | 0.00% | 0.00% | 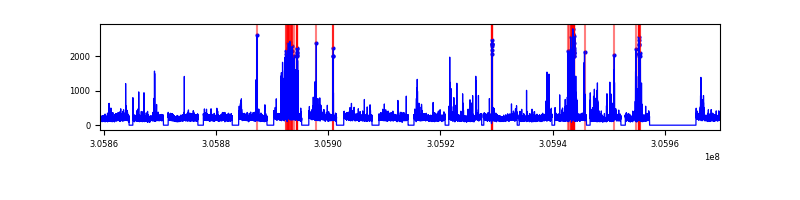 |
| B | 110535 | 89142 | 0 | 0 | 0.00% | 0.00% |  |
| C | 110535 | 89143 | 0 | 0 | 0.00% | 0.00% | 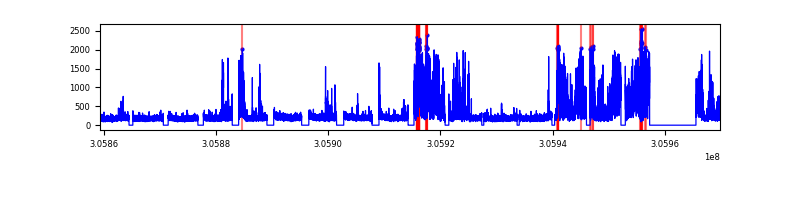 |
| D | 110535 | 89107 | 0 | 0 | 0.00% | 0.00% |  |
Top three noisy pixels from each quadrant. If the there are fewer than three noisy pixels in the level2.evt file, extra rows are filled as -1
| Pixel properties | Quadrant properties | ||||||
|---|---|---|---|---|---|---|---|
| Quadrant | DetID | PixID | Counts | Sigma | Mean | Median | Sigma |
| A | 0 | 29 | 5054 | 11.14 | 1374 | 1294 | 337.5 |
| A | 7 | 110 | 4189 | 8.58 | 1374 | 1294 | 337.5 |
| A | 9 | 19 | 4059 | 8.19 | 1374 | 1294 | 337.5 |
| B | 2 | 9 | 3969 | 10.58 | 1327 | 1274 | 254.6 |
| B | 2 | 8 | 3420 | 8.43 | 1327 | 1274 | 254.6 |
| B | 14 | 254 | 3323 | 8.05 | 1327 | 1274 | 254.6 |
| C | 1 | 81 | 3817 | 7.57 | 1321 | 1237 | 341.0 |
| C | 1 | 80 | 3803 | 7.53 | 1321 | 1237 | 341.0 |
| C | 12 | 241 | 3622 | 6.99 | 1321 | 1237 | 341.0 |
| D | 3 | 14 | 3284 | 6.47 | 1247 | 1139 | 331.3 |
| D | 7 | 3 | 3101 | 5.92 | 1247 | 1139 | 331.3 |
| D | 6 | 231 | 3082 | 5.87 | 1247 | 1139 | 331.3 |
Histogram calculated using DETX and DETY for each event in the final _common_clean file
| Quadrant A | 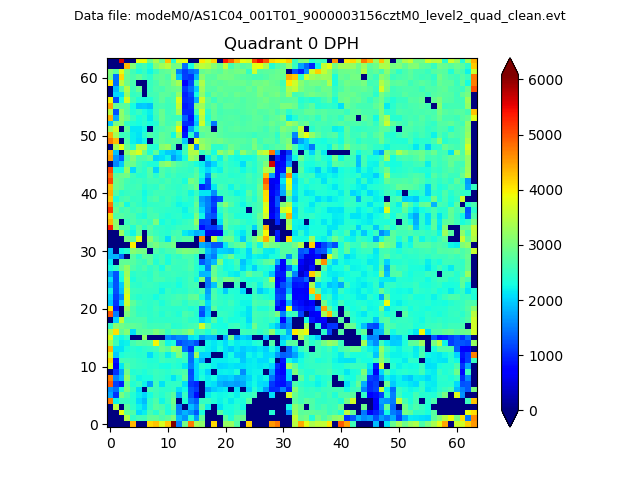 |
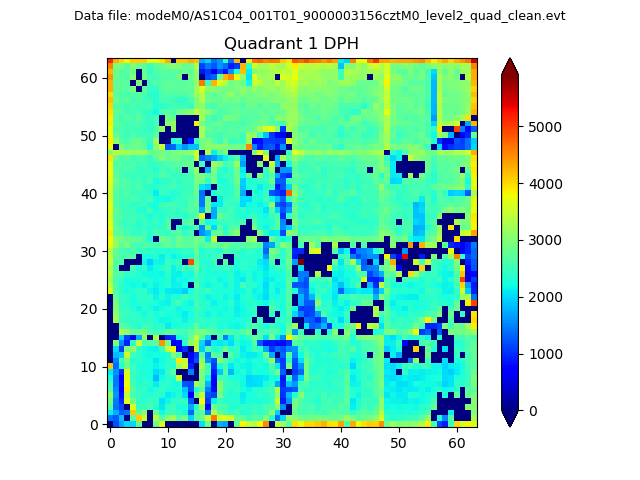 |
Quadrant B |
|---|---|---|---|
| Quadrant D | 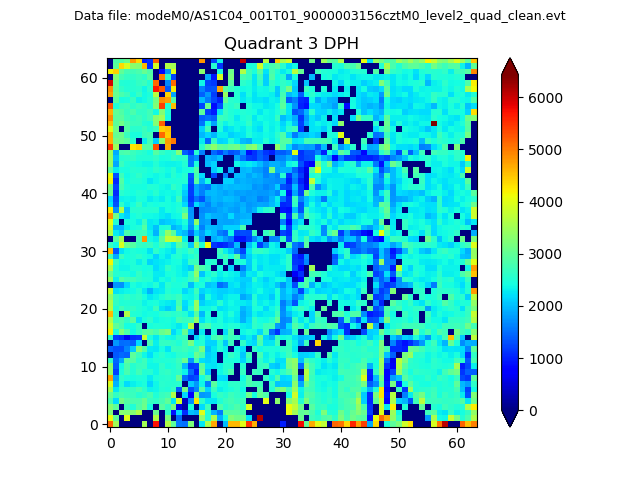 |
 |
Quadrant C |
| Plot type | Count rate plots | Images |
|---|---|---|
| Comparison with Poisson distribution Blue bars denote a histogram of data divided into 1 sec bins. Red curve is a Poisson curve with rate = median count rate of data. |
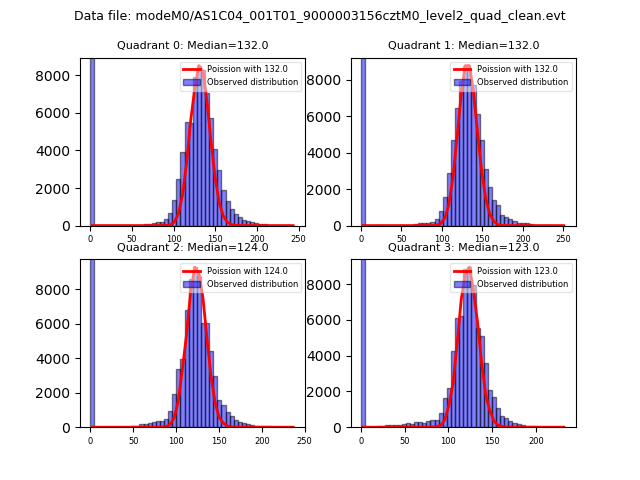 |
 |
| Quadrant-wise count rates Data is divided into 100 sec bins |
 |
|
| Module-wise count rates for Quadrant A Data is divided into 100 sec bins |
 |
 |
| Module-wise count rates for Quadrant B Data is divided into 100 sec bins |
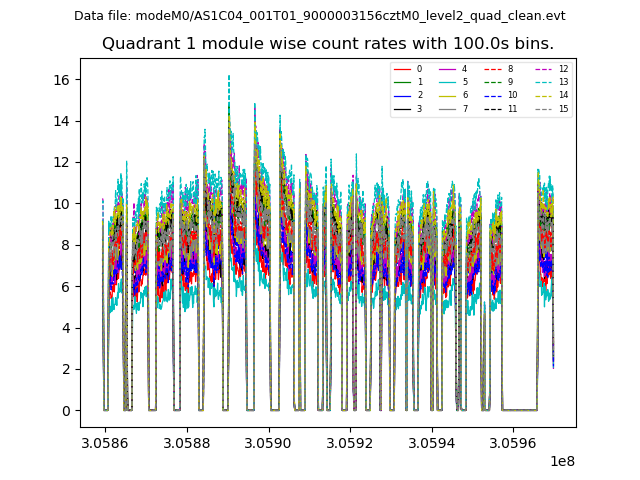 |
 |
| Module-wise count rates for Quadrant C Data is divided into 100 sec bins |
 |
 |
| Module-wise count rates for Quadrant D Data is divided into 100 sec bins |
 |
 |
| Parameter | Plot |
|---|---|
| CZT HV Monitor |  |
| D_VDD | 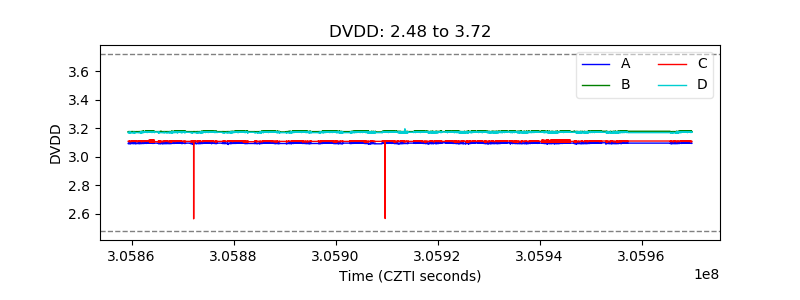 |
| Temperature 1 |  |
| Veto HV Monitor | 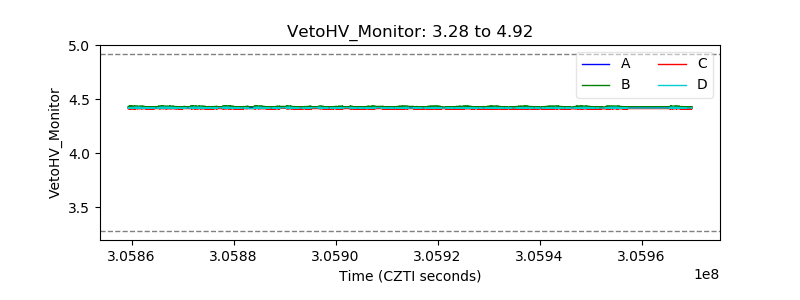 |
| Veto LLD |  |
| Alpha Counter |  |
| _CPM_Rate |  |
| CZT Counter |  |
| +2.5 Volts monitor |  |
| +5 Volts monitor |  |
| _ROLL_ROT | 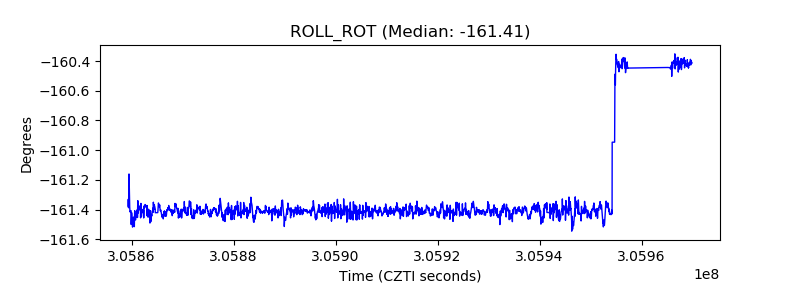 |
| _Roll_DEC | 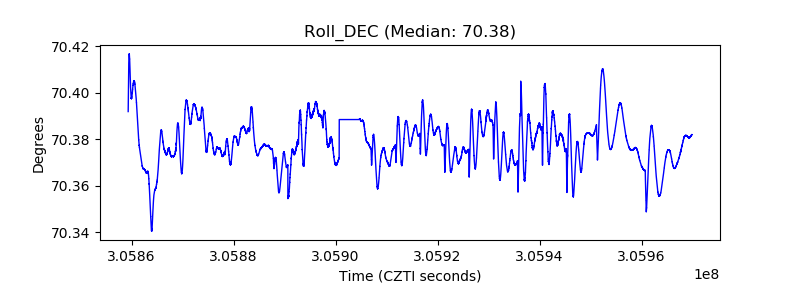 |
| _Roll_RA |  |
| Veto Counter |  |