| Param | Original file | Final file |
|---|---|---|
| Filename | modeM0/AS1C04_001T01_9000003156_21373cztM0_level2.evt | modeM0/AS1C04_001T01_9000003156_21373cztM0_level2_quad_clean.evt |
| Size (bytes) | 853,830,720 | 165,945,600 |
| Size | 814.3 MB | 158.3 MB |
| Events in quadrant A | 5,647,674 | 1,070,968 |
| Events in quadrant B | 5,862,033 | 1,082,473 |
| Events in quadrant C | 5,522,491 | 1,031,018 |
| Events in quadrant D | 8,011,381 | 1,009,178 |
| Mode M0 | |||
|---|---|---|---|
| Quadrant | BADHDUFLAG | Total packets | Discarded packets |
| A | 0 | 24581 | 2 |
| B | 0 | 25272 | 2 |
| C | 0 | 24480 | 3 |
| D | 0 | 32262 | 2 |
| Mode M9 | |||
|---|---|---|---|
| Quadrant | BADHDUFLAG | Total packets | Discarded packets |
| A | 0 | 14 | 0 |
| B | 0 | 14 | 0 |
| C | 0 | 14 | 0 |
| D | 0 | 14 | 0 |
| Mode SS | |||
|---|---|---|---|
| Quadrant | BADHDUFLAG | Total packets | Discarded packets |
| A | 0 | 246 | 0 |
| B | 0 | 246 | 0 |
| C | 0 | 246 | 0 |
| D | 0 | 246 | 0 |
| Quadrant | Total seconds | Saturated seconds | Saturation percentage |
|---|---|---|---|
| A | 12032 | 69 | 0.573471% |
| B | 12032 | 125 | 1.038896% |
| C | 12031 | 106 | 0.881057% |
| D | 12031 | 393 | 3.266561% |
Noise dominated data is calculated using 1-second bins in cleaned event files. If a bin has >2000 counts, and if more than 50% of those come from <1% of pixels, then it is considered to be noise-dominated and hence unusable.
| Quadrant | # 1 sec bins | Bins with >0 counts | Bins with >2000 counts | High rate bins dominated by noise | Noise dominated (total time) | Noise dominated (detector-on time) | Marked lightcurve |
|---|---|---|---|---|---|---|---|
| A | 13567 | 12032 | 0 | 0 | 0.00% | 0.00% | 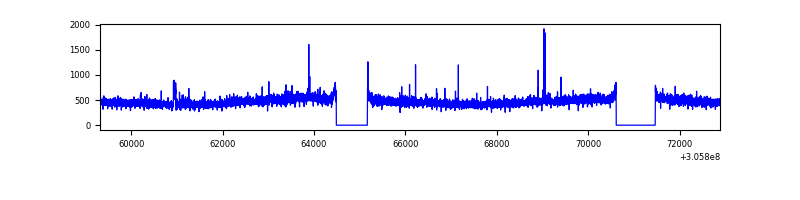 |
| B | 13567 | 12032 | 29 | 29 | 0.21% | 0.24% | 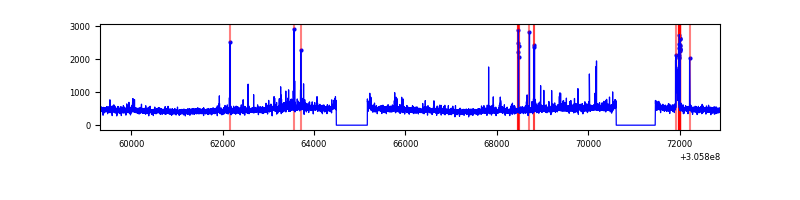 |
| C | 13566 | 12031 | 0 | 0 | 0.00% | 0.00% | 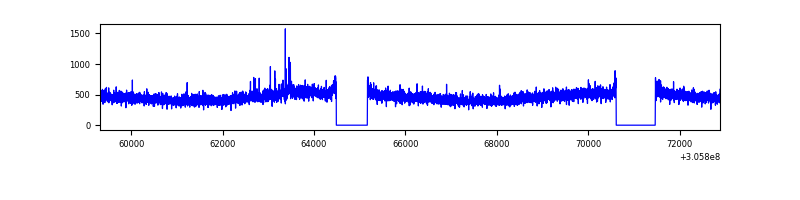 |
| D | 13566 | 12031 | 303 | 303 | 2.23% | 2.52% | 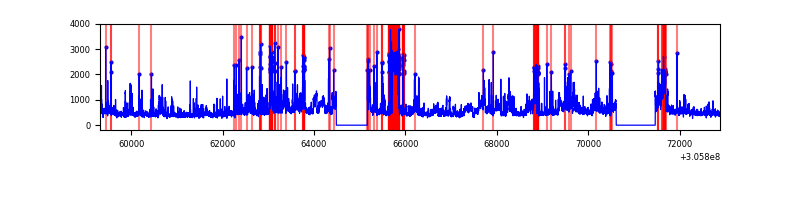 |
Top three noisy pixels from each quadrant. If the there are fewer than three noisy pixels in the level2.evt file, extra rows are filled as -1
| Pixel properties | Quadrant properties | ||||||
|---|---|---|---|---|---|---|---|
| Quadrant | DetID | PixID | Counts | Sigma | Mean | Median | Sigma |
| A | 5 | 168 | 136490 | 479.55 | 1412 | 1382 | 281.7 |
| A | 15 | 174 | 29826 | 100.96 | 1412 | 1382 | 281.7 |
| A | 12 | 96 | 26269 | 88.33 | 1412 | 1382 | 281.7 |
| B | 3 | 64 | 152744 | 569.23 | 1407 | 1370 | 265.9 |
| B | 0 | 230 | 73704 | 272.01 | 1407 | 1370 | 265.9 |
| B | 0 | 190 | 52765 | 193.27 | 1407 | 1370 | 265.9 |
| C | 14 | 238 | 209223 | 656.57 | 1351 | 1358 | 316.6 |
| C | 3 | 233 | 44220 | 135.39 | 1351 | 1358 | 316.6 |
| C | 13 | 61 | 9511 | 25.75 | 1351 | 1358 | 316.6 |
| D | 1 | 52 | 2282308 | 6980.84 | 1356 | 1316 | 326.8 |
| D | 12 | 235 | 156068 | 473.61 | 1356 | 1316 | 326.8 |
| D | 13 | 153 | 130041 | 393.95 | 1356 | 1316 | 326.8 |
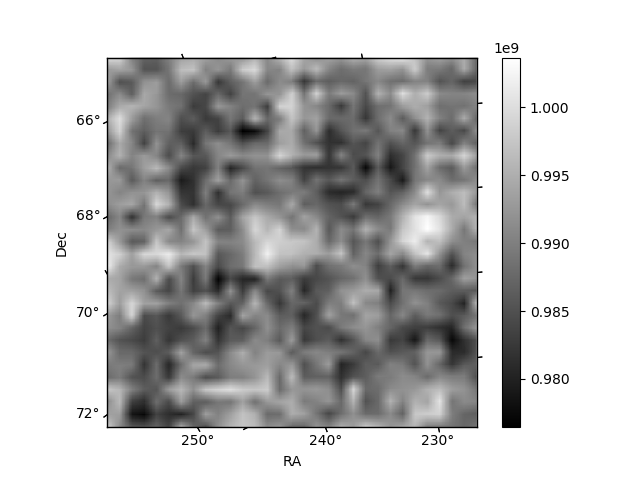
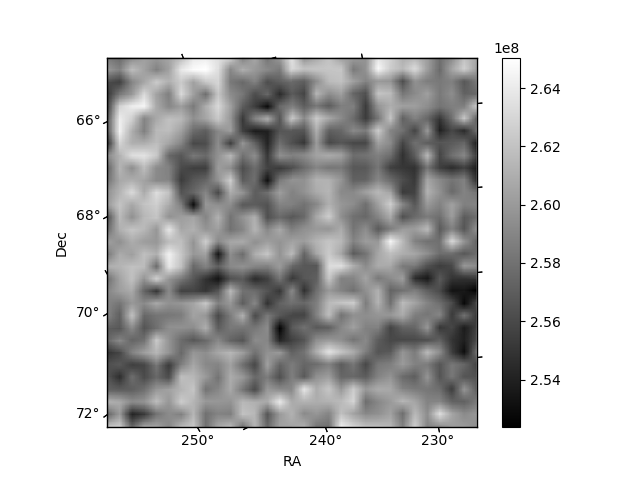
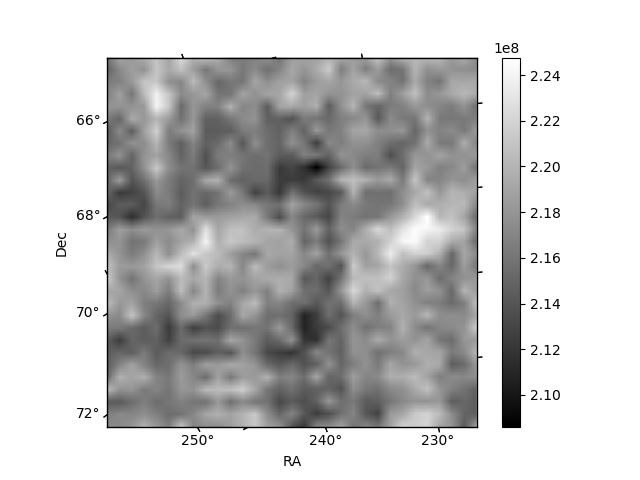
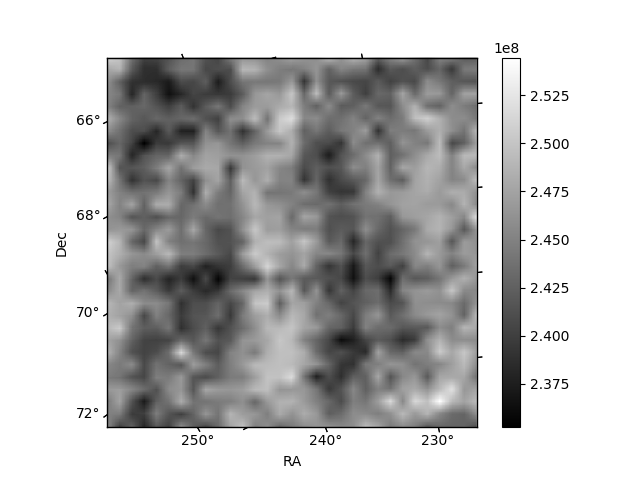
Histogram calculated using DETX and DETY for each event in the final _common_clean file
| Quadrant A | 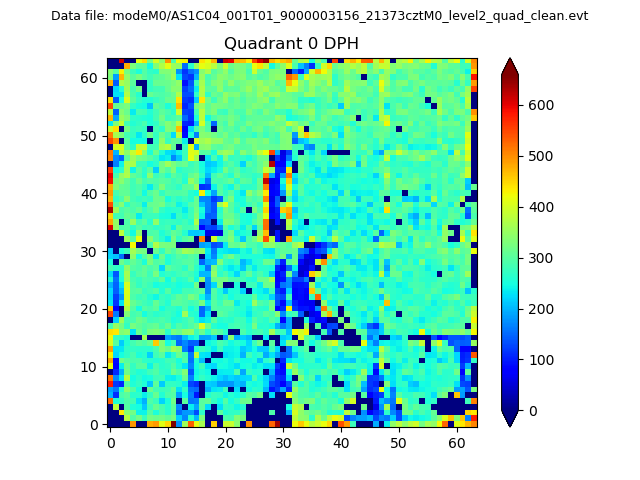 |
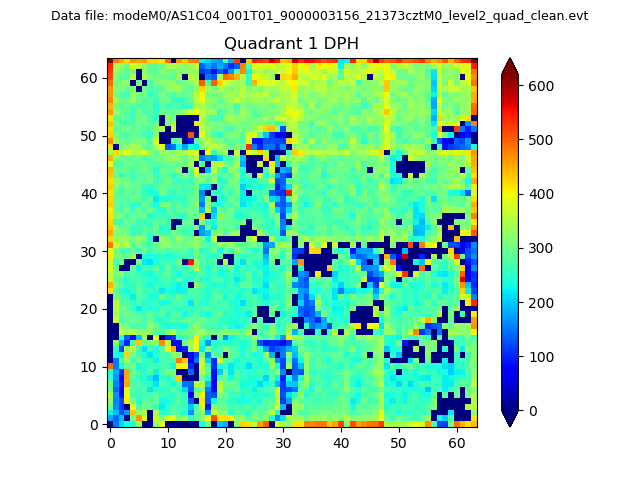 |
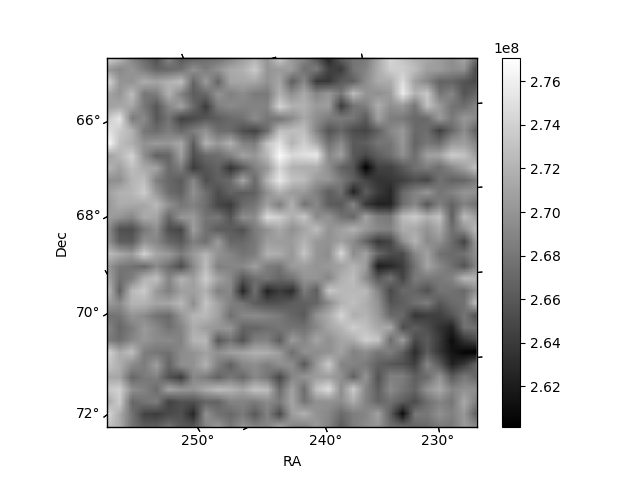
Quadrant B |
|---|---|---|---|
| Quadrant D | 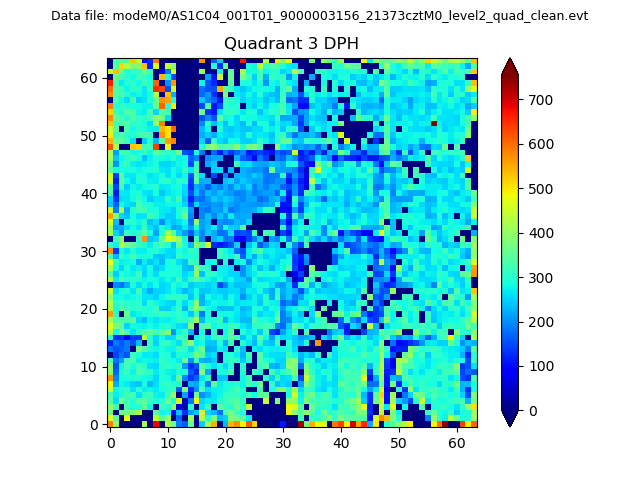 |
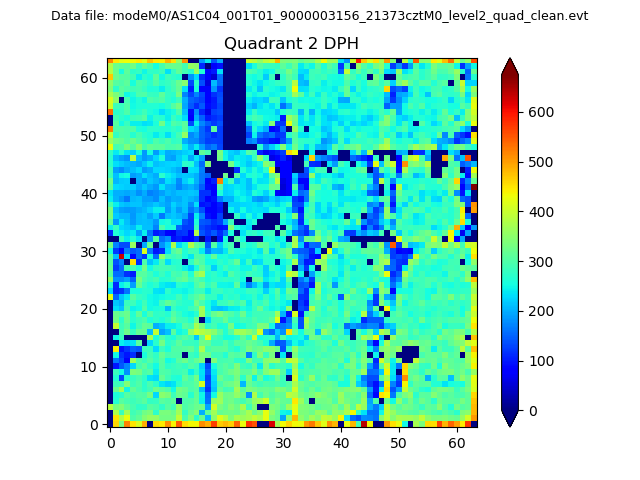 |
Quadrant C |
| Plot type | Count rate plots | Images |
|---|---|---|
| Comparison with Poisson distribution Blue bars denote a histogram of data divided into 1 sec bins. Red curve is a Poisson curve with rate = median count rate of data. |
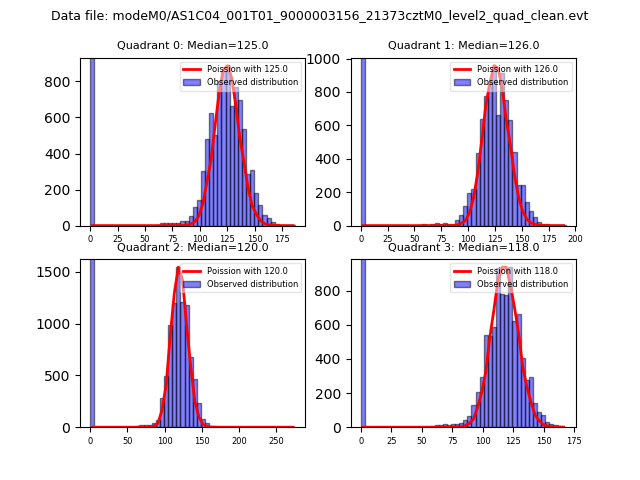 |
 |
| Quadrant-wise count rates Data is divided into 100 sec bins |
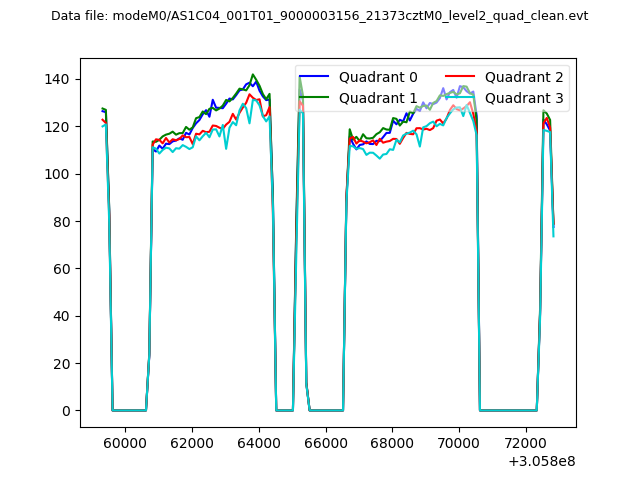 |
|
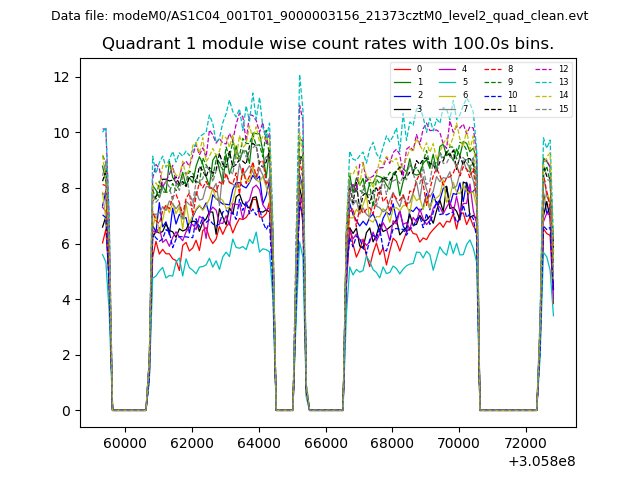
| Module-wise count rates for Quadrant A Data is divided into 100 sec bins |
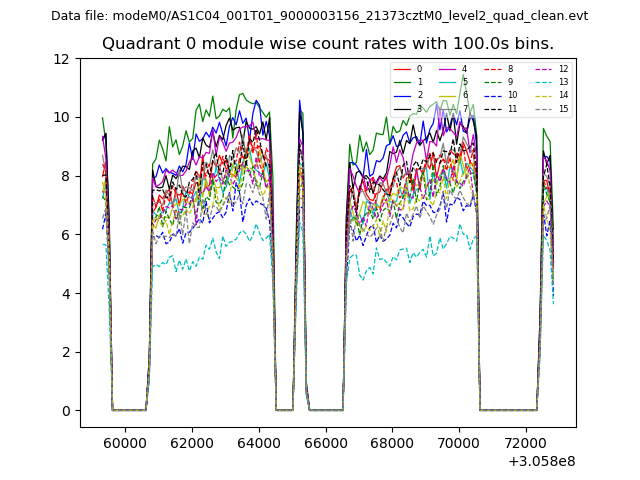 |
 |
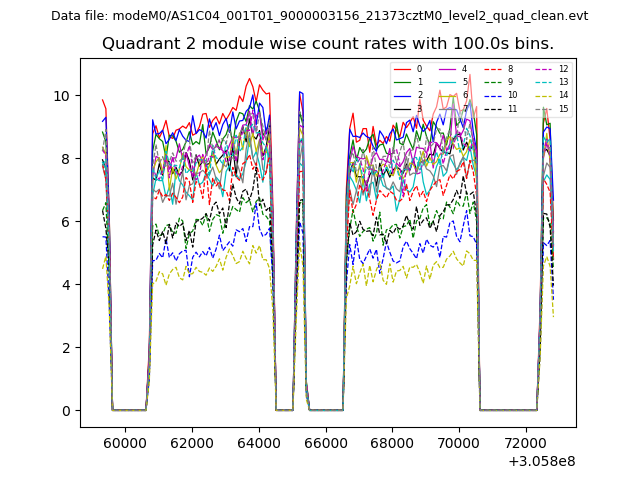
| Module-wise count rates for Quadrant B Data is divided into 100 sec bins |
 |
 |
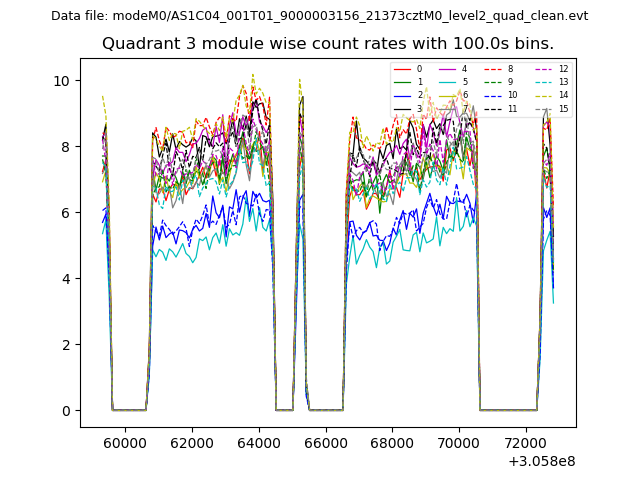
| Module-wise count rates for Quadrant C Data is divided into 100 sec bins |
 |
 |
| Module-wise count rates for Quadrant D Data is divided into 100 sec bins |
 |
 |
| Parameter | Plot |
|---|---|
| CZT HV Monitor | 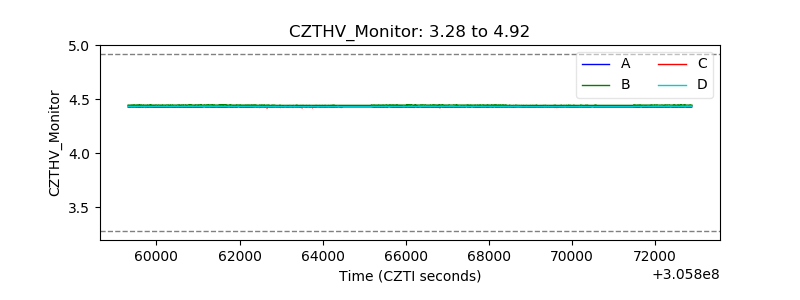 |
| D_VDD | 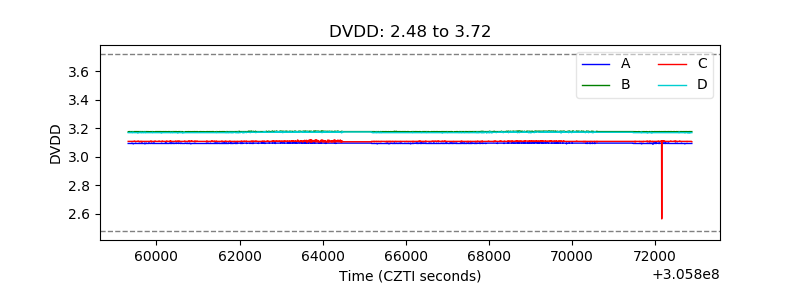 |
| Temperature 1 | 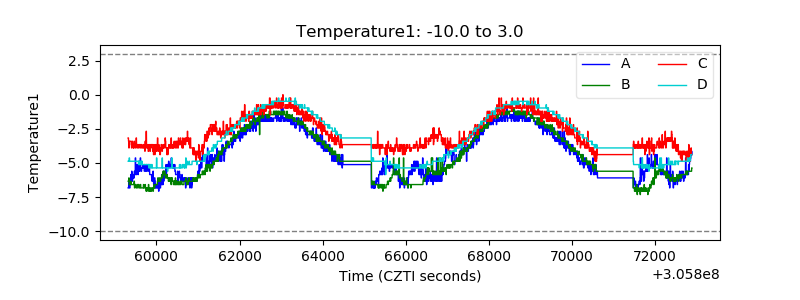 |
| Veto HV Monitor | 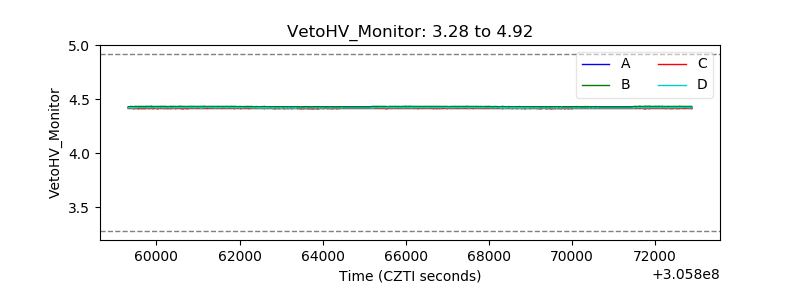 |
| Veto LLD | 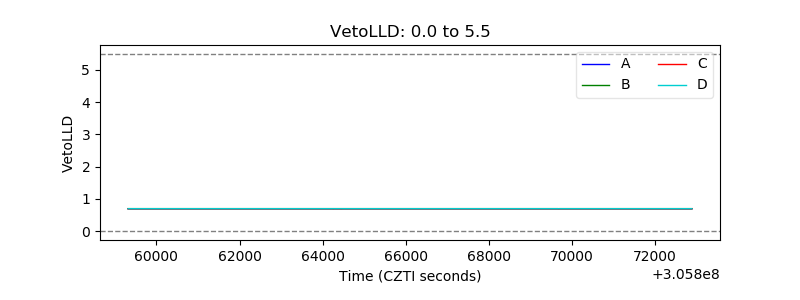 |
| Alpha Counter | 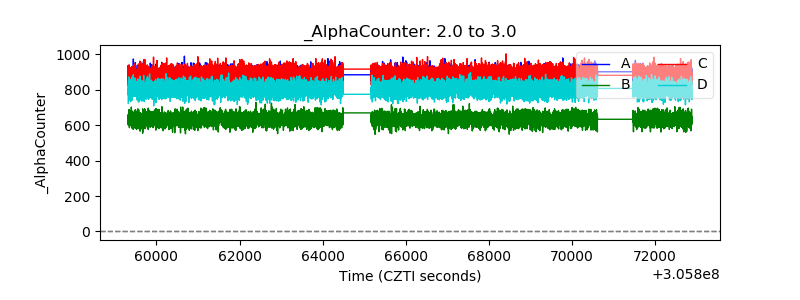 |
| _CPM_Rate | 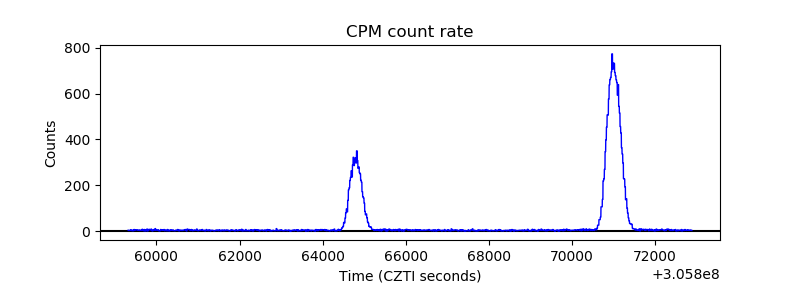 |
| CZT Counter | 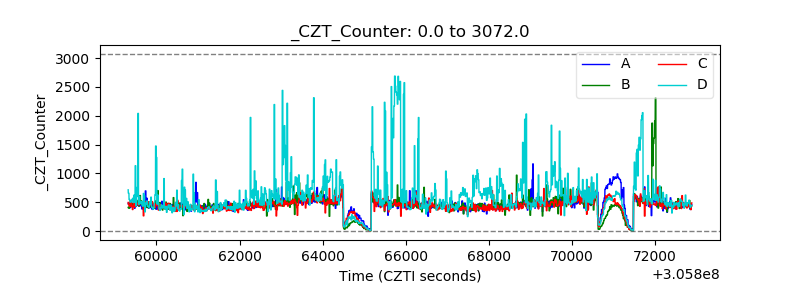 |
| +2.5 Volts monitor |  |
| +5 Volts monitor | 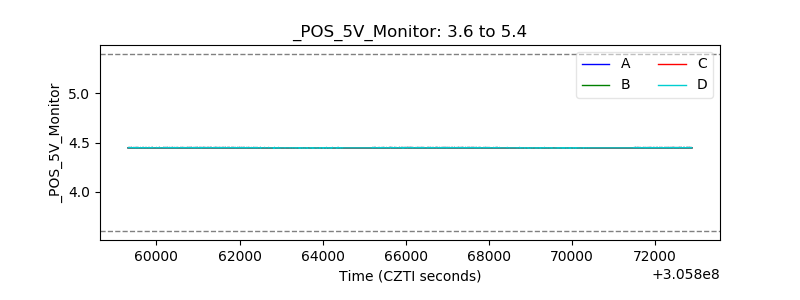 |
| _ROLL_ROT | 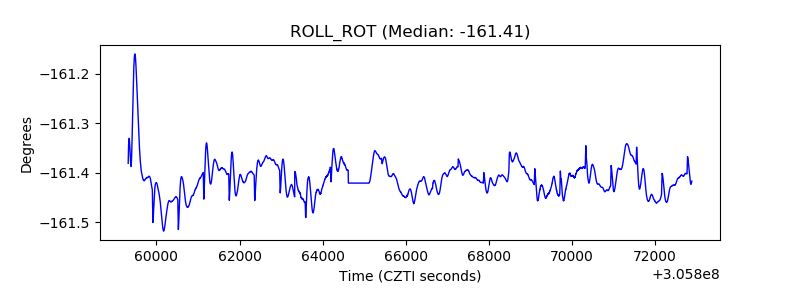 |
| _Roll_DEC | 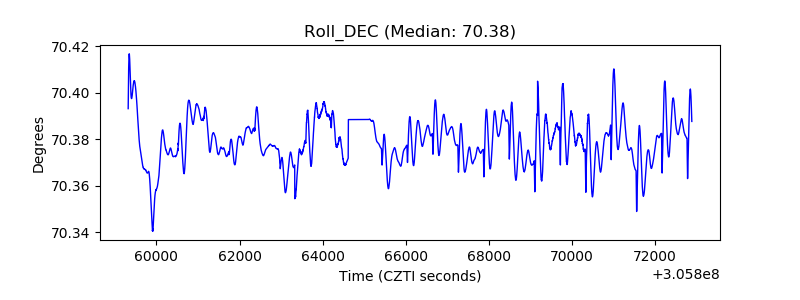 |
| _Roll_RA | 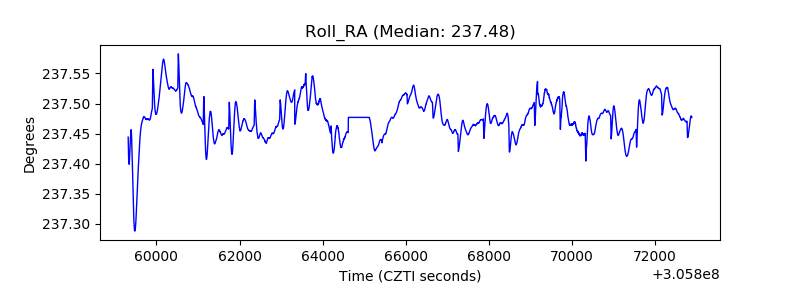 |
| Veto Counter | 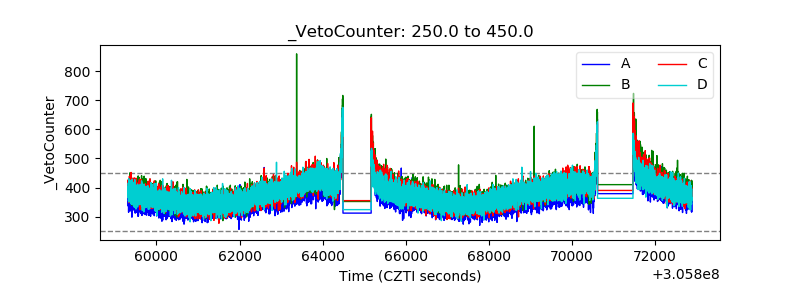 |