| Param | Original file | Final file |
|---|---|---|
| Filename | modeM0/AS1C04_001T01_9000003156_21374cztM0_level2.evt | modeM0/AS1C04_001T01_9000003156_21374cztM0_level2_quad_clean.evt |
| Size (bytes) | 515,004,480 | 98,625,600 |
| Size | 491.1 MB | 94.1 MB |
| Events in quadrant A | 3,243,462 | 646,978 |
| Events in quadrant B | 3,407,336 | 655,615 |
| Events in quadrant C | 3,116,029 | 621,608 |
| Events in quadrant D | 5,375,239 | 595,170 |
| Mode M0 | |||
|---|---|---|---|
| Quadrant | BADHDUFLAG | Total packets | Discarded packets |
| A | 0 | 13757 | 2 |
| B | 0 | 14353 | 2 |
| C | 0 | 13638 | 2 |
| D | 0 | 20487 | 2 |
| Mode M9 | |||
|---|---|---|---|
| Quadrant | BADHDUFLAG | Total packets | Discarded packets |
| A | 0 | 16 | 0 |
| B | 0 | 17 | 0 |
| C | 0 | 17 | 0 |
| D | 0 | 17 | 0 |
| Mode SS | |||
|---|---|---|---|
| Quadrant | BADHDUFLAG | Total packets | Discarded packets |
| A | 0 | 136 | 0 |
| B | 0 | 136 | 0 |
| C | 0 | 136 | 0 |
| D | 0 | 136 | 0 |
| Quadrant | Total seconds | Saturated seconds | Saturation percentage |
|---|---|---|---|
| A | 6704 | 42 | 0.626492% |
| B | 6704 | 90 | 1.342482% |
| C | 6704 | 65 | 0.969570% |
| D | 6704 | 441 | 6.578162% |
Noise dominated data is calculated using 1-second bins in cleaned event files. If a bin has >2000 counts, and if more than 50% of those come from <1% of pixels, then it is considered to be noise-dominated and hence unusable.
| Quadrant | # 1 sec bins | Bins with >0 counts | Bins with >2000 counts | High rate bins dominated by noise | Noise dominated (total time) | Noise dominated (detector-on time) | Marked lightcurve |
|---|---|---|---|---|---|---|---|
| A | 7694 | 6704 | 0 | 0 | 0.00% | 0.00% | 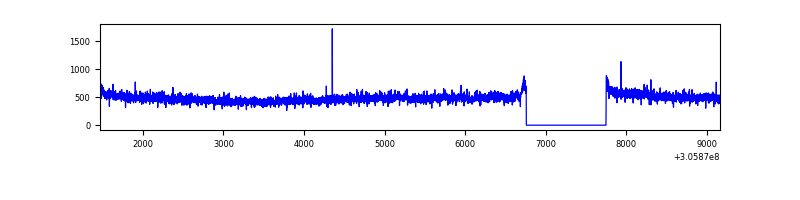 |
| B | 7694 | 6704 | 23 | 23 | 0.30% | 0.34% |  |
| C | 7694 | 6704 | 0 | 0 | 0.00% | 0.00% | 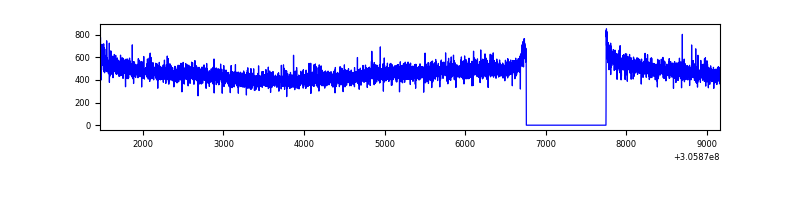 |
| D | 7694 | 6704 | 386 | 386 | 5.02% | 5.76% | 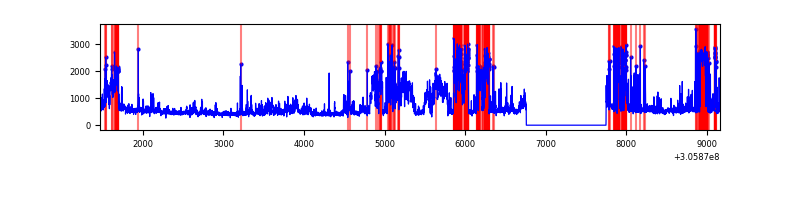 |
Top three noisy pixels from each quadrant. If the there are fewer than three noisy pixels in the level2.evt file, extra rows are filled as -1
| Pixel properties | Quadrant properties | ||||||
|---|---|---|---|---|---|---|---|
| Quadrant | DetID | PixID | Counts | Sigma | Mean | Median | Sigma |
| A | 5 | 168 | 111577 | 684.33 | 810 | 793 | 161.9 |
| A | 13 | 254 | 8936 | 50.3 | 810 | 793 | 161.9 |
| A | 0 | 226 | 6981 | 38.22 | 810 | 793 | 161.9 |
| B | 3 | 64 | 117218 | 763.15 | 805 | 786 | 152.6 |
| B | 0 | 230 | 41619 | 267.64 | 805 | 786 | 152.6 |
| B | 0 | 197 | 29713 | 189.6 | 805 | 786 | 152.6 |
| C | 14 | 238 | 120719 | 668.81 | 766 | 770 | 179.3 |
| C | 3 | 233 | 6942 | 34.41 | 766 | 770 | 179.3 |
| C | 13 | 61 | 5454 | 26.12 | 766 | 770 | 179.3 |
| D | 1 | 52 | 2124016 | 11419.68 | 766 | 742 | 185.9 |
| D | 7 | 238 | 152267 | 814.95 | 766 | 742 | 185.9 |
| D | 5 | 32 | 57549 | 305.52 | 766 | 742 | 185.9 |
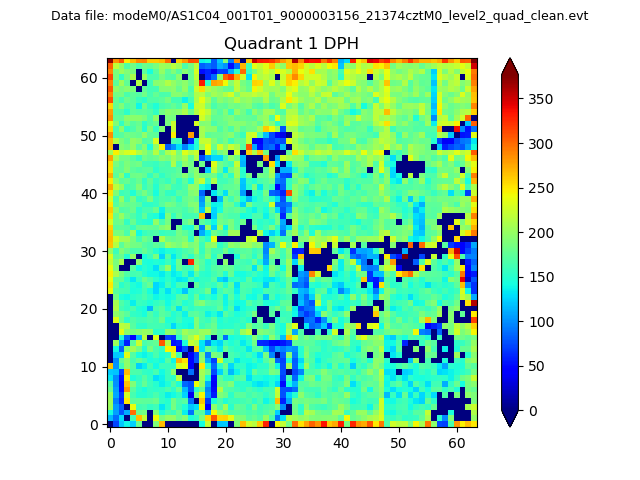
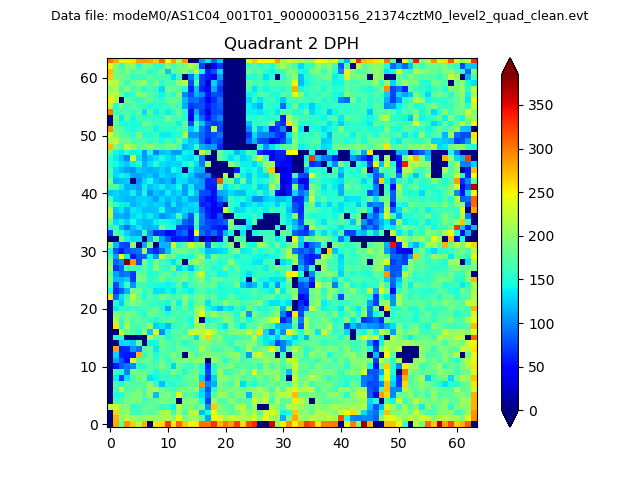
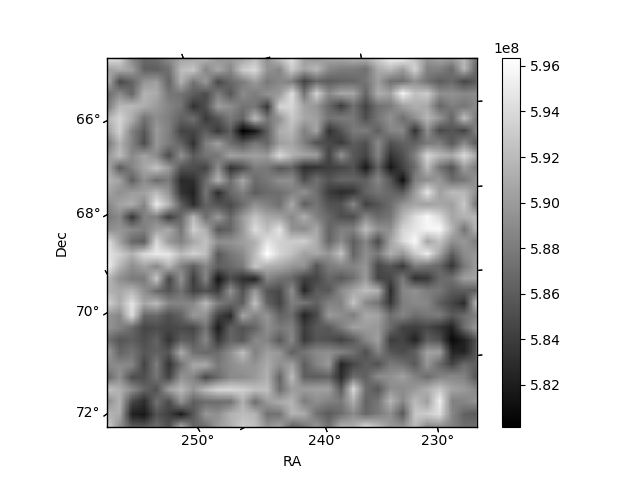
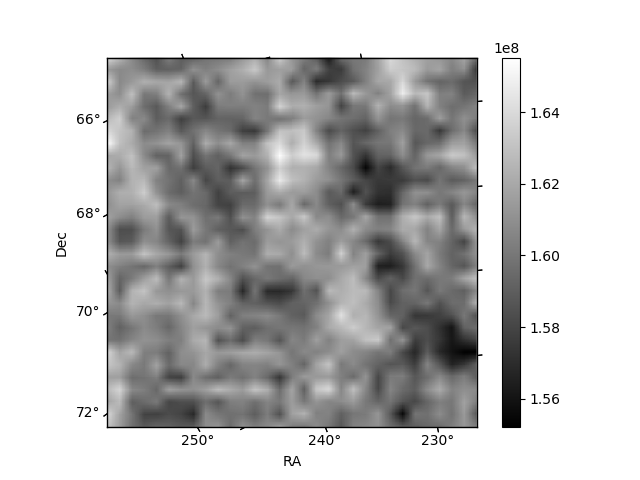
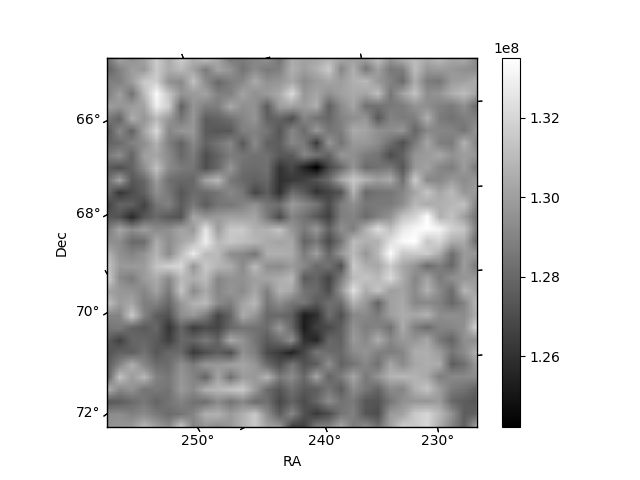
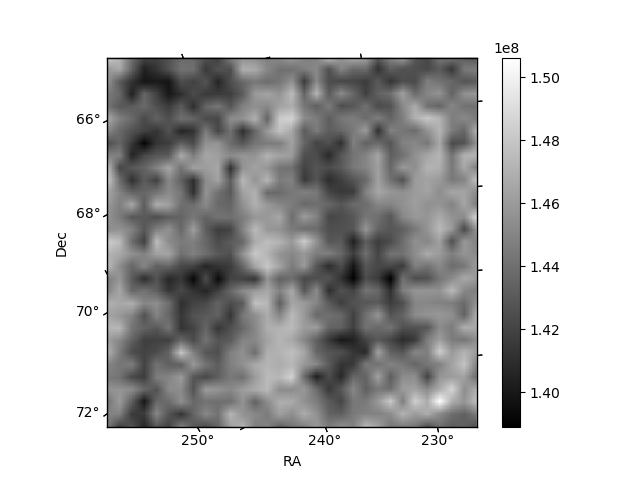
Histogram calculated using DETX and DETY for each event in the final _common_clean file
| Quadrant A | 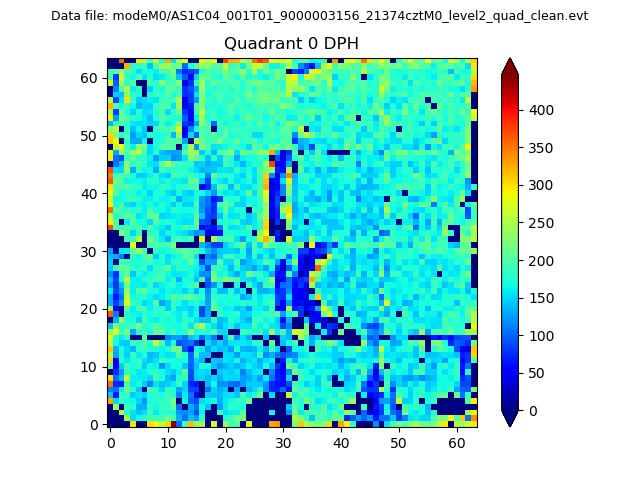 |
 |
Quadrant B |
|---|---|---|---|
| Quadrant D | 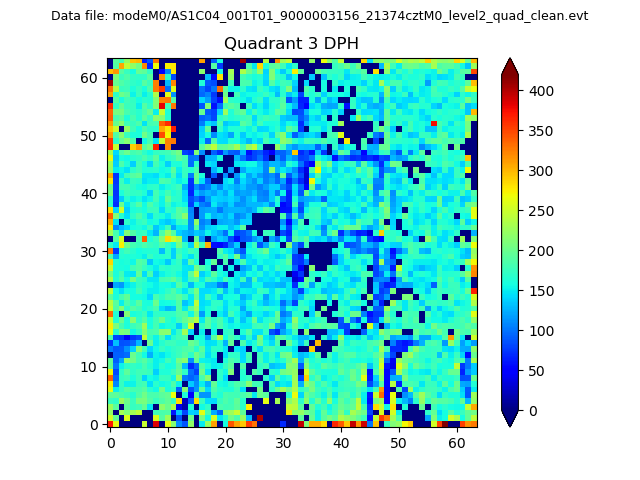 |
 |
Quadrant C |
| Plot type | Count rate plots | Images |
|---|---|---|
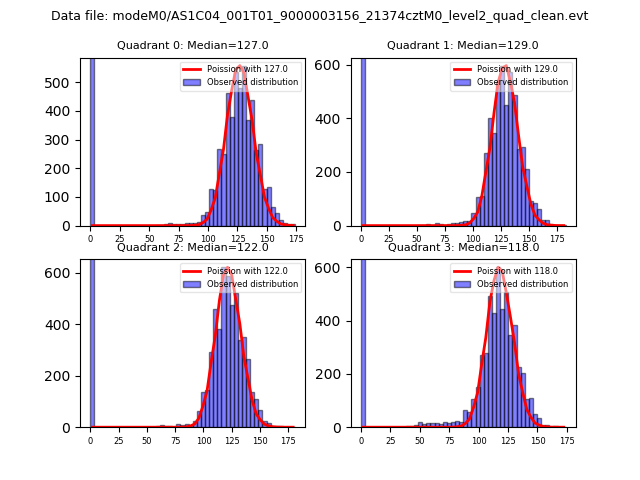
| Comparison with Poisson distribution Blue bars denote a histogram of data divided into 1 sec bins. Red curve is a Poisson curve with rate = median count rate of data. |
 |
 |
| Quadrant-wise count rates Data is divided into 100 sec bins |
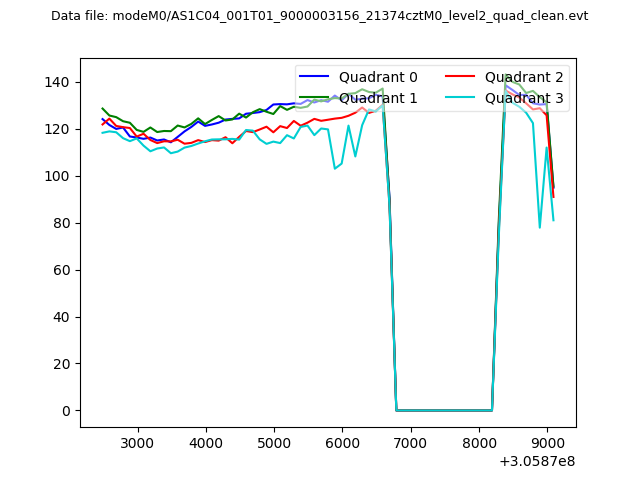 |
|
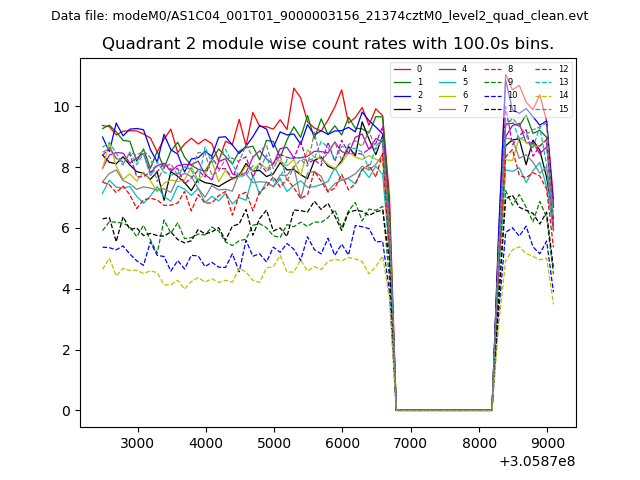
| Module-wise count rates for Quadrant A Data is divided into 100 sec bins |
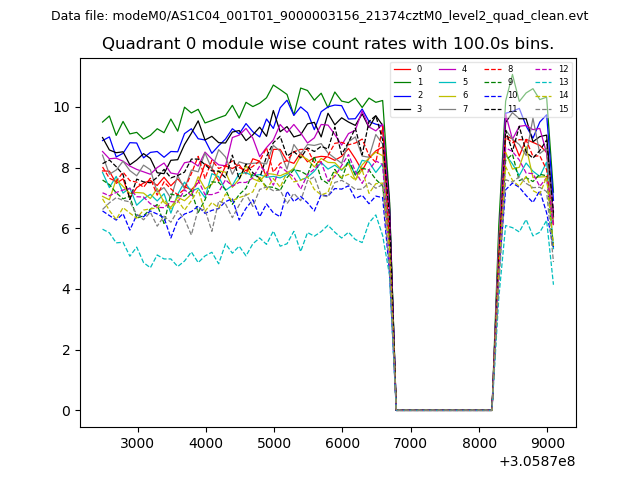 |
 |
| Module-wise count rates for Quadrant B Data is divided into 100 sec bins |
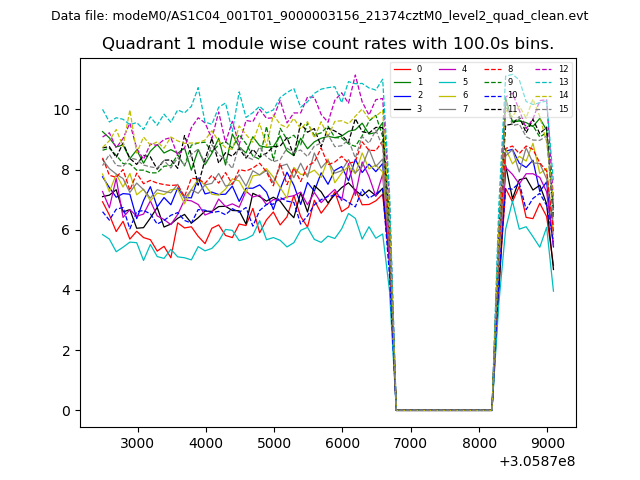 |
 |
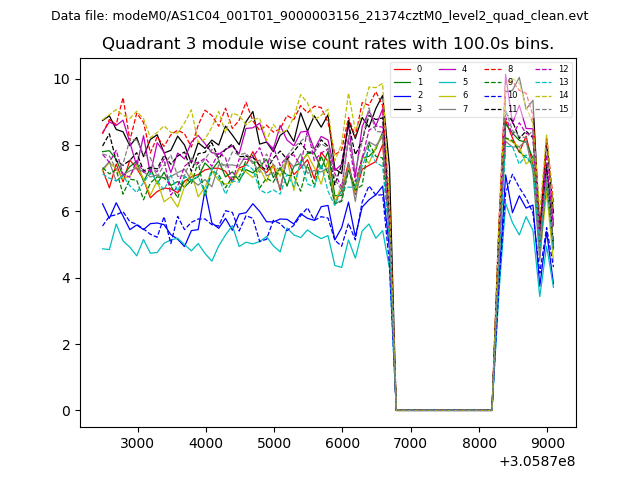
| Module-wise count rates for Quadrant C Data is divided into 100 sec bins |
 |
 |
| Module-wise count rates for Quadrant D Data is divided into 100 sec bins |
 |
 |
| Parameter | Plot |
|---|---|
| CZT HV Monitor | 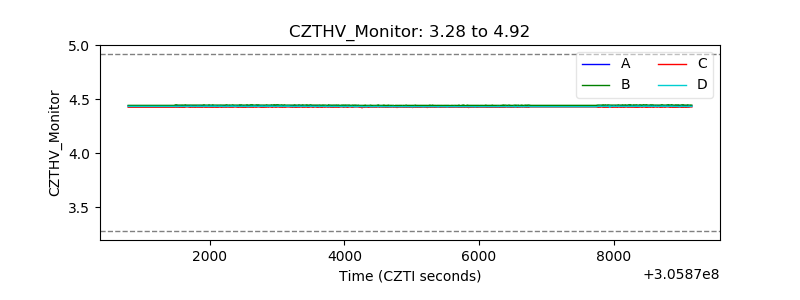 |
| D_VDD | 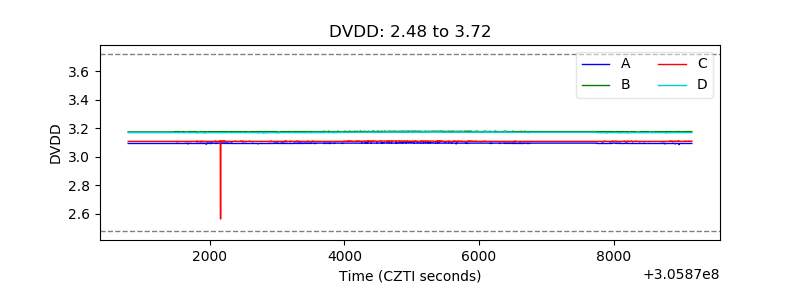 |
| Temperature 1 | 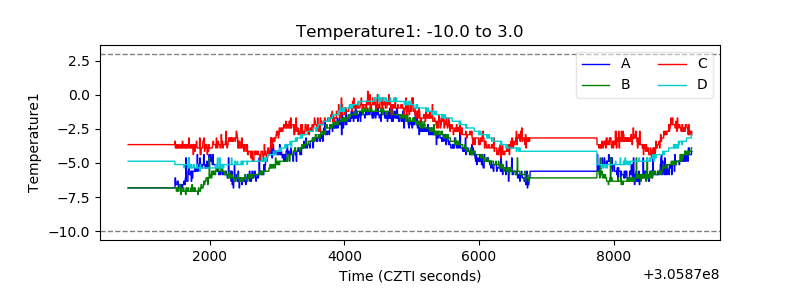 |
| Veto HV Monitor | 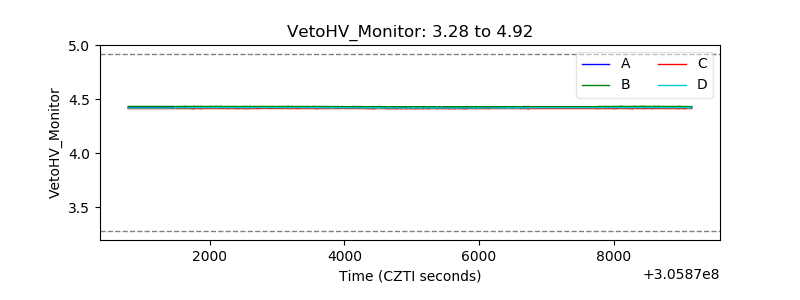 |
| Veto LLD | 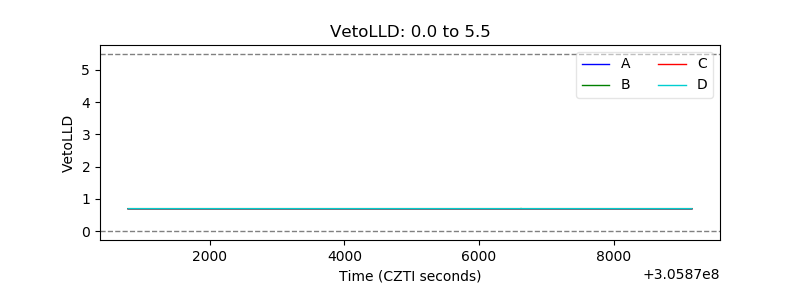 |
| Alpha Counter | 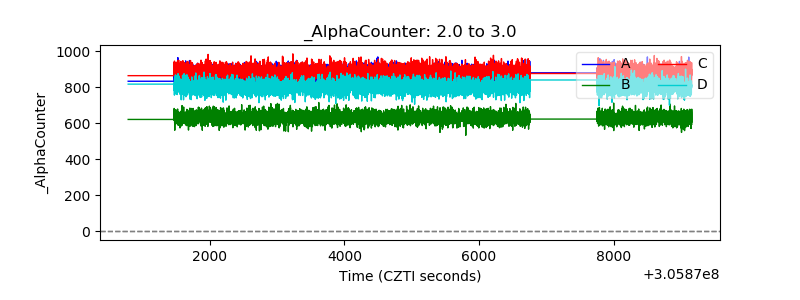 |
| _CPM_Rate | 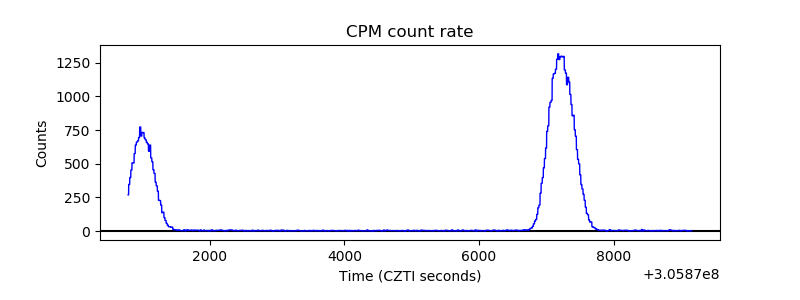 |
| CZT Counter | 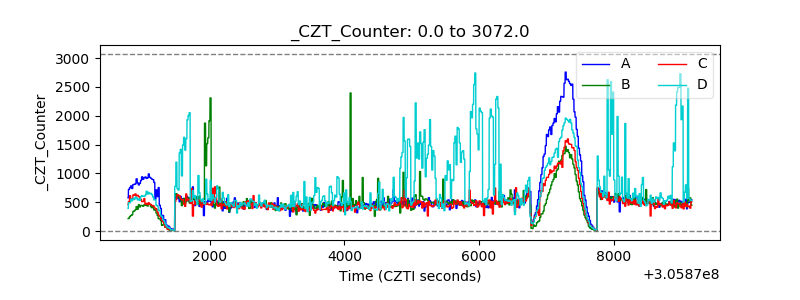 |
| +2.5 Volts monitor |  |
| +5 Volts monitor | 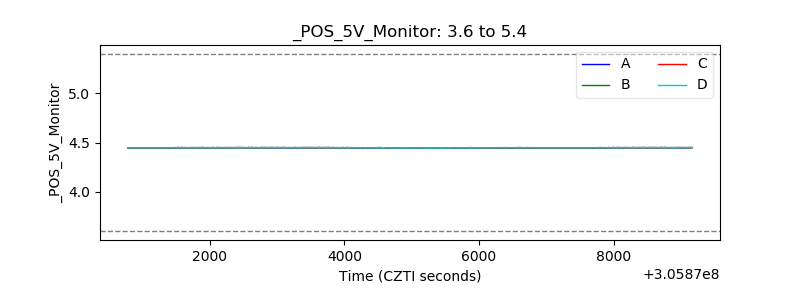 |
| _ROLL_ROT | 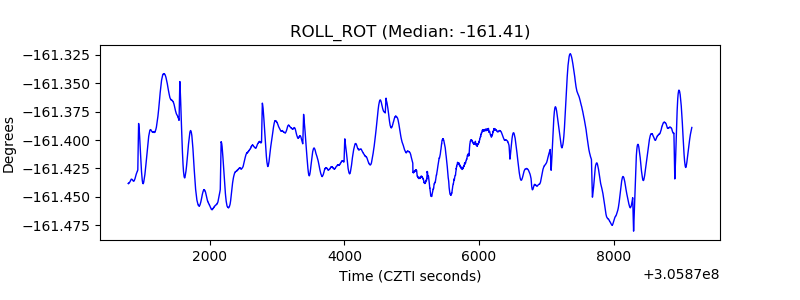 |
| _Roll_DEC | 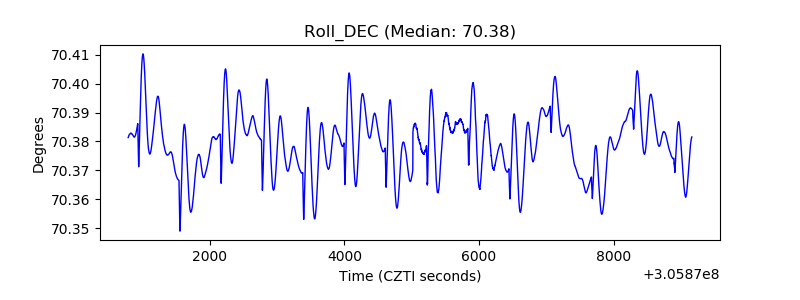 |
| _Roll_RA | 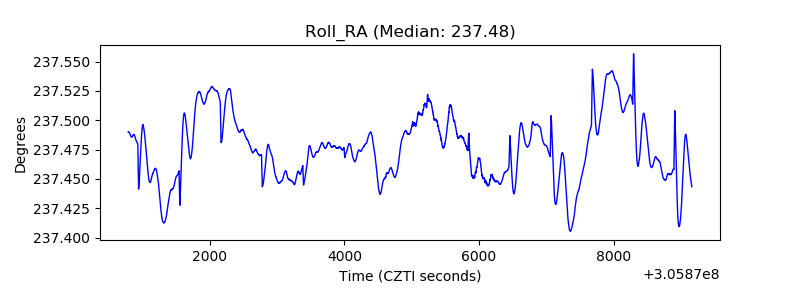 |
| Veto Counter | 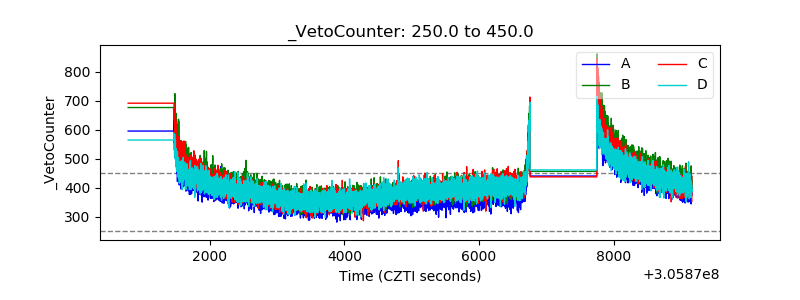 |