| Param | Original file | Final file |
|---|---|---|
| Filename | modeM0/AS1C04_001T01_9000003156_21377cztM0_level2.evt | modeM0/AS1C04_001T01_9000003156_21377cztM0_level2_quad_clean.evt |
| Size (bytes) | 485,377,920 | 115,346,880 |
| Size | 462.9 MB | 110.0 MB |
| Events in quadrant A | 2,940,941 | 809,600 |
| Events in quadrant B | 3,028,230 | 808,899 |
| Events in quadrant C | 3,076,518 | 750,419 |
| Events in quadrant D | 5,260,877 | 719,522 |
| Mode M0 | |||
|---|---|---|---|
| Quadrant | BADHDUFLAG | Total packets | Discarded packets |
| A | 0 | 12290 | 1 |
| B | 0 | 12576 | 1 |
| C | 0 | 12838 | 1 |
| D | 0 | 19552 | 1 |
| Mode M9 | |||
|---|---|---|---|
| Quadrant | BADHDUFLAG | Total packets | Discarded packets |
| A | 0 | 12 | 0 |
| B | 0 | 12 | 0 |
| C | 0 | 12 | 0 |
| D | 0 | 12 | 0 |
| Mode SS | |||
|---|---|---|---|
| Quadrant | BADHDUFLAG | Total packets | Discarded packets |
| A | 0 | 118 | 0 |
| B | 0 | 118 | 0 |
| C | 0 | 118 | 0 |
| D | 0 | 118 | 0 |
| Quadrant | Total seconds | Saturated seconds | Saturation percentage |
|---|---|---|---|
| A | 5792 | 57 | 0.984116% |
| B | 5793 | 94 | 1.622648% |
| C | 5793 | 106 | 1.829795% |
| D | 5793 | 645 | 11.134127% |
Noise dominated data is calculated using 1-second bins in cleaned event files. If a bin has >2000 counts, and if more than 50% of those come from <1% of pixels, then it is considered to be noise-dominated and hence unusable.
| Quadrant | # 1 sec bins | Bins with >0 counts | Bins with >2000 counts | High rate bins dominated by noise | Noise dominated (total time) | Noise dominated (detector-on time) | Marked lightcurve |
|---|---|---|---|---|---|---|---|
| A | 7002 | 5792 | 2 | 2 | 0.03% | 0.03% | 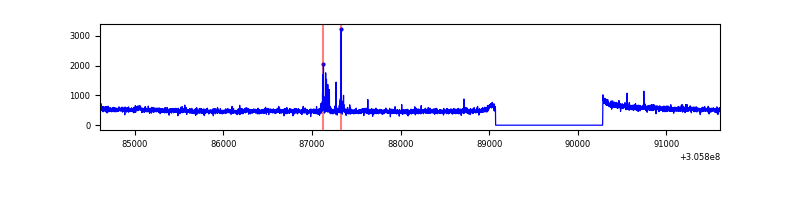 |
| B | 7003 | 5793 | 21 | 21 | 0.30% | 0.36% |  |
| C | 7003 | 5793 | 6 | 6 | 0.09% | 0.10% | 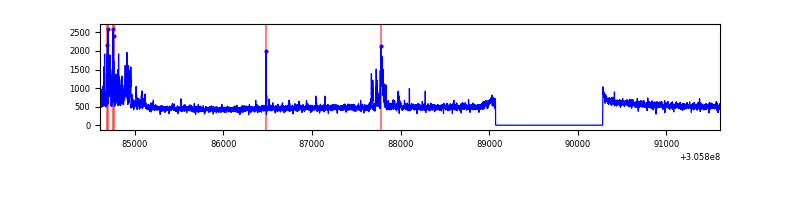 |
| D | 7003 | 5793 | 584 | 584 | 8.34% | 10.08% | 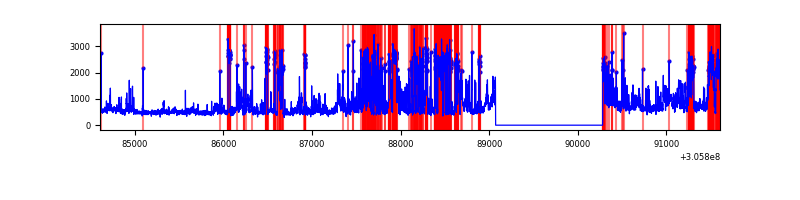 |
Top three noisy pixels from each quadrant. If the there are fewer than three noisy pixels in the level2.evt file, extra rows are filled as -1
| Pixel properties | Quadrant properties | ||||||
|---|---|---|---|---|---|---|---|
| Quadrant | DetID | PixID | Counts | Sigma | Mean | Median | Sigma |
| A | 5 | 168 | 42243 | 280.78 | 741 | 727 | 147.9 |
| A | 5 | 16 | 39535 | 262.46 | 741 | 727 | 147.9 |
| A | 13 | 254 | 7664 | 46.92 | 741 | 727 | 147.9 |
| B | 0 | 190 | 67161 | 490.88 | 726 | 709 | 135.4 |
| B | 0 | 230 | 46695 | 339.7 | 726 | 709 | 135.4 |
| B | 3 | 64 | 34196 | 247.37 | 726 | 709 | 135.4 |
| C | 3 | 233 | 275102 | 1736.8 | 688 | 692 | 158.0 |
| C | 14 | 238 | 112351 | 706.71 | 688 | 692 | 158.0 |
| C | 10 | 91 | 7511 | 43.16 | 688 | 692 | 158.0 |
| D | 1 | 52 | 2352646 | 14279.89 | 688 | 667 | 164.7 |
| D | 7 | 238 | 105127 | 634.22 | 688 | 667 | 164.7 |
| D | 12 | 235 | 52959 | 317.49 | 688 | 667 | 164.7 |
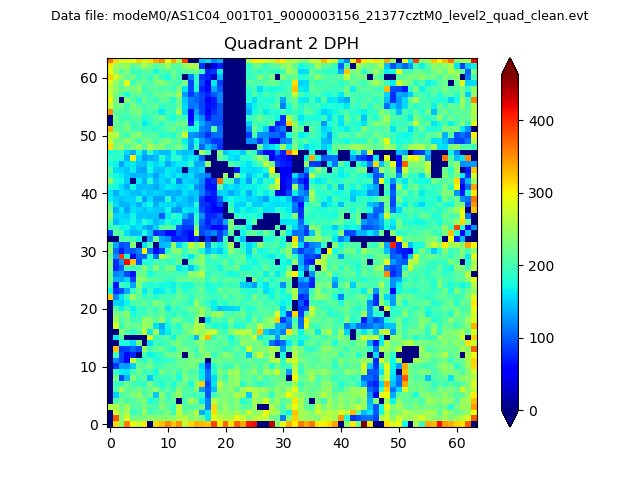
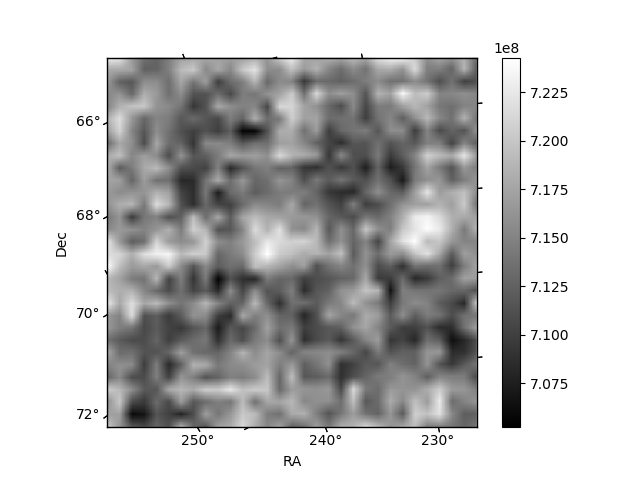
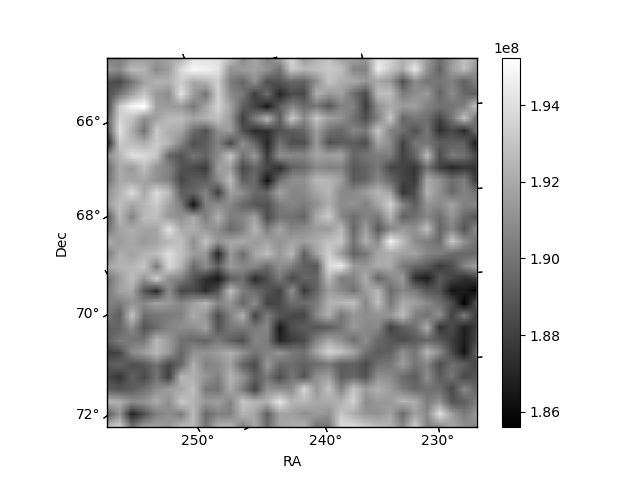
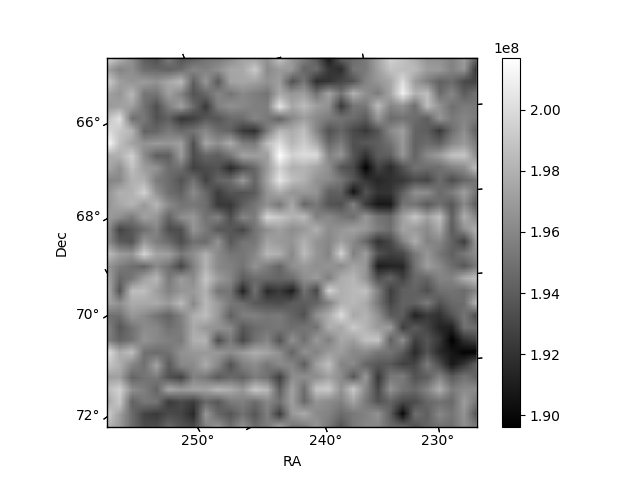
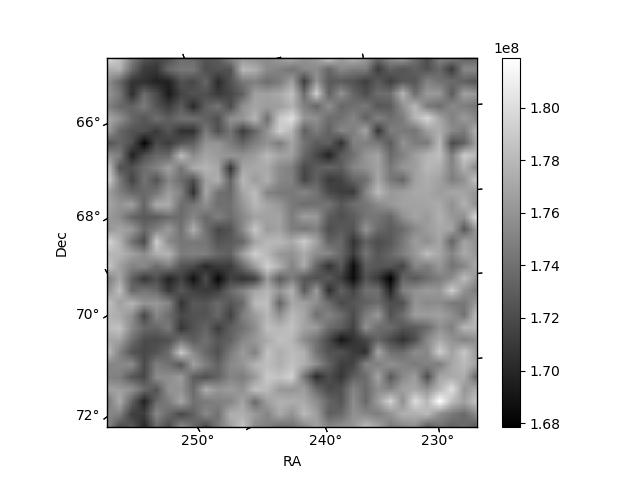
Histogram calculated using DETX and DETY for each event in the final _common_clean file
| Quadrant A | 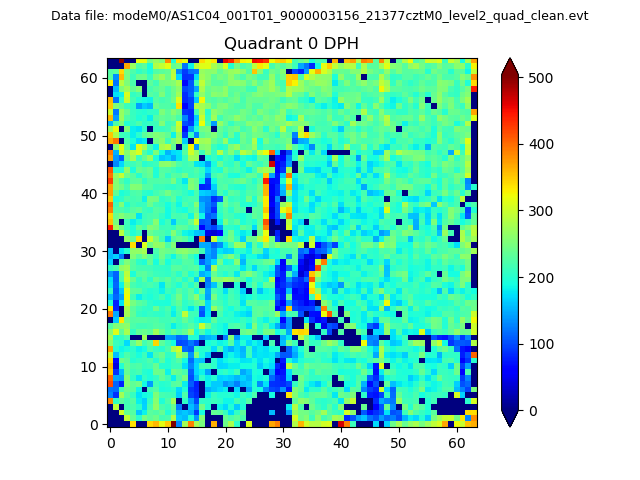 |
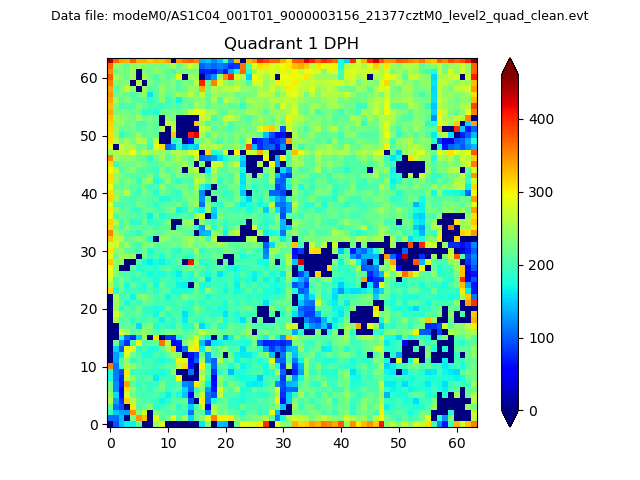 |
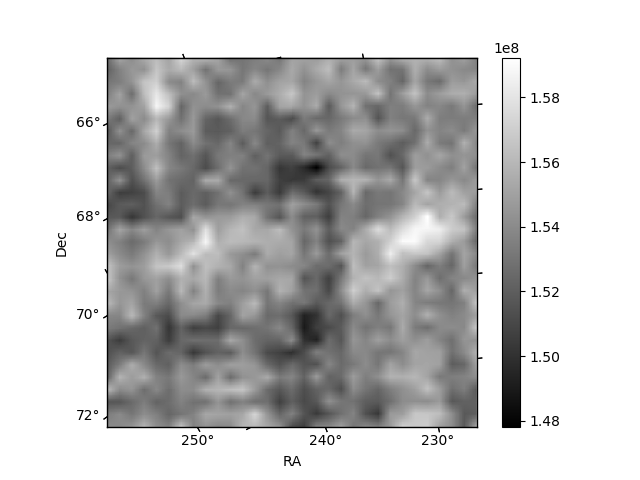
Quadrant B |
|---|---|---|---|
| Quadrant D | 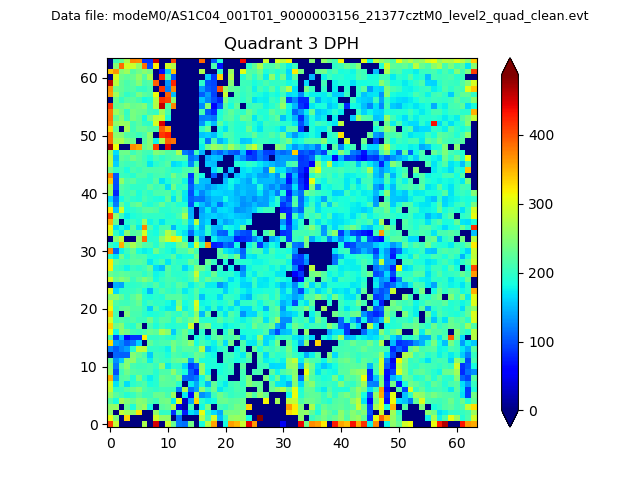 |
 |
Quadrant C |
| Plot type | Count rate plots | Images |
|---|---|---|
| Comparison with Poisson distribution Blue bars denote a histogram of data divided into 1 sec bins. Red curve is a Poisson curve with rate = median count rate of data. |
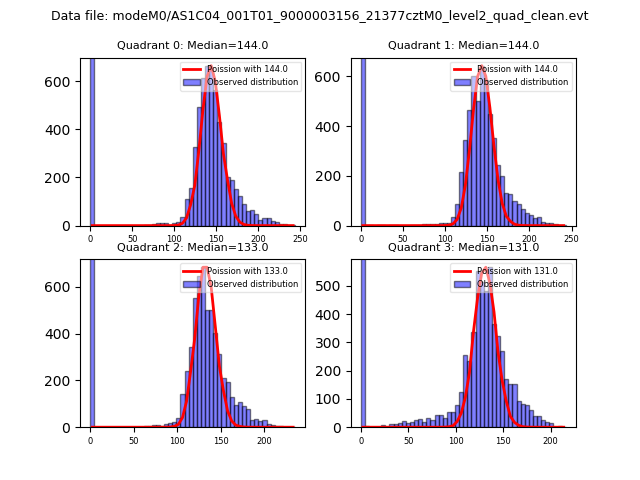 |
 |
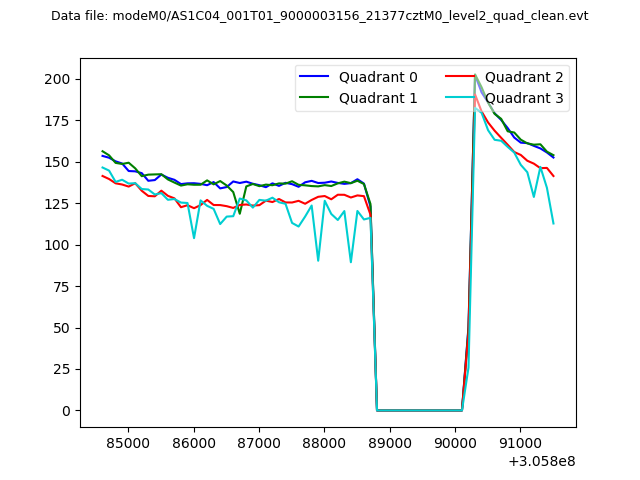
| Quadrant-wise count rates Data is divided into 100 sec bins |
 |
|
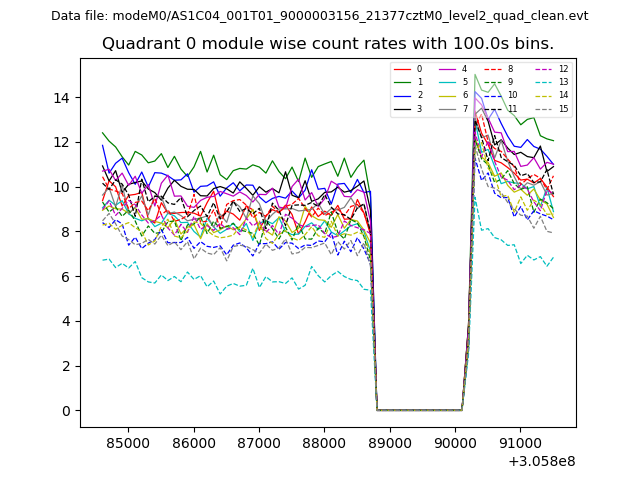
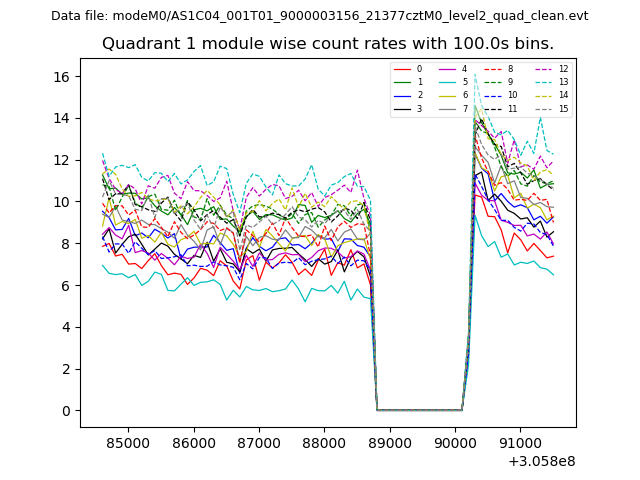
| Module-wise count rates for Quadrant A Data is divided into 100 sec bins |
 |
 |
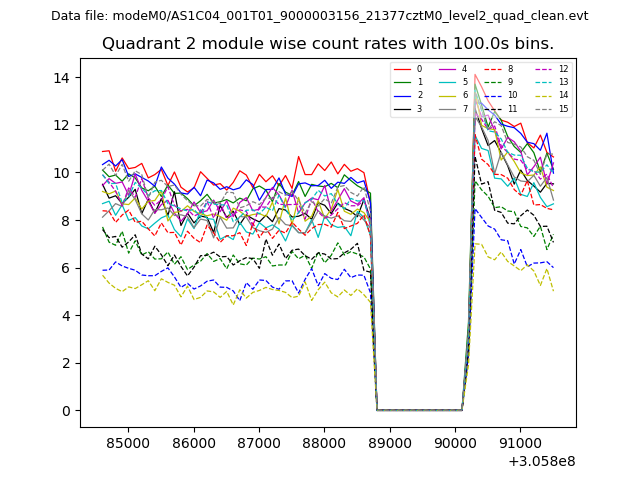
| Module-wise count rates for Quadrant B Data is divided into 100 sec bins |
 |
 |
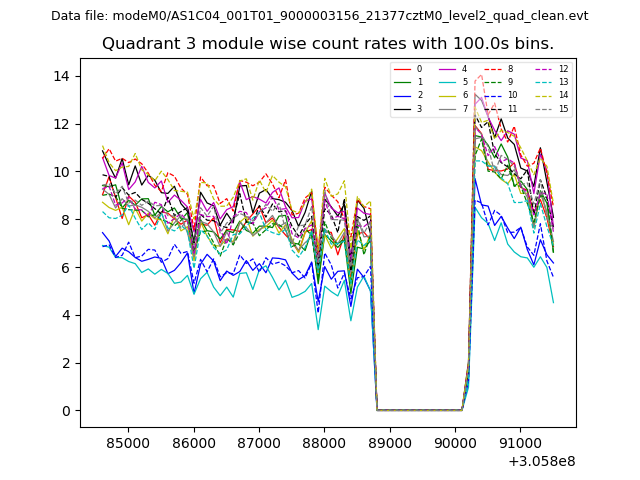
| Module-wise count rates for Quadrant C Data is divided into 100 sec bins |
 |
 |
| Module-wise count rates for Quadrant D Data is divided into 100 sec bins |
 |
 |
| Parameter | Plot |
|---|---|
| CZT HV Monitor | 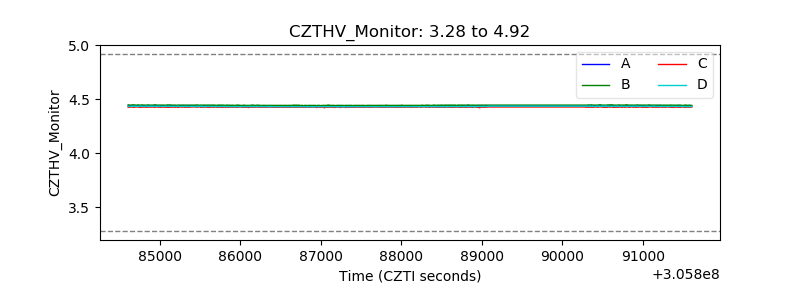 |
| D_VDD | 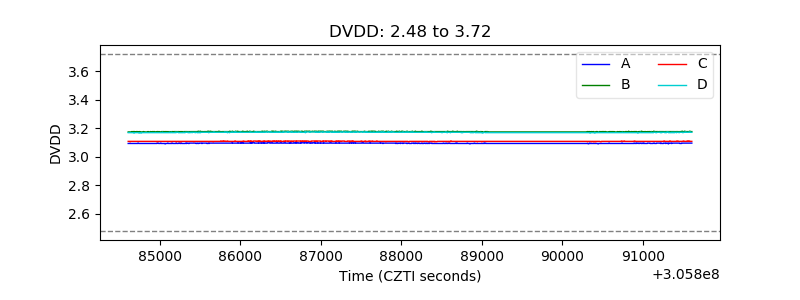 |
| Temperature 1 | 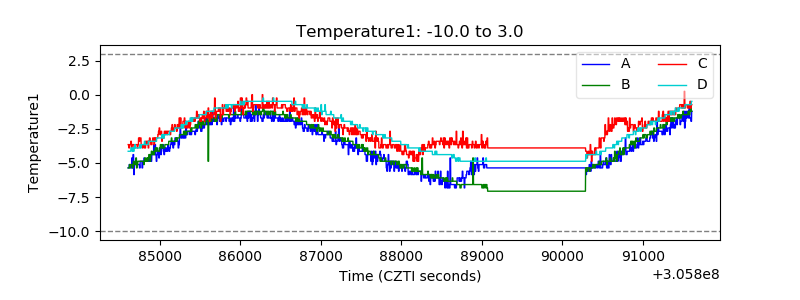 |
| Veto HV Monitor | 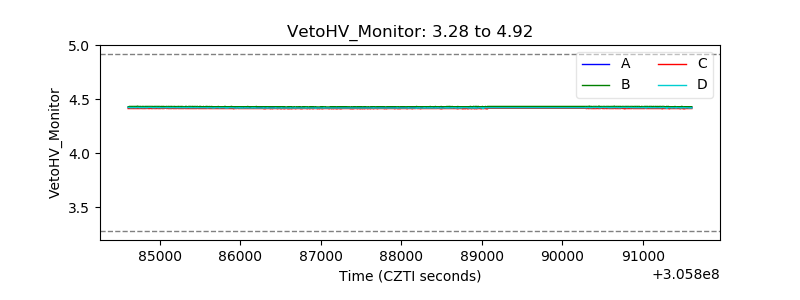 |
| Veto LLD | 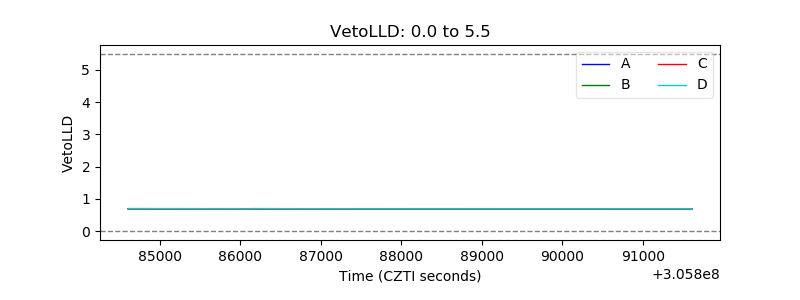 |
| Alpha Counter | 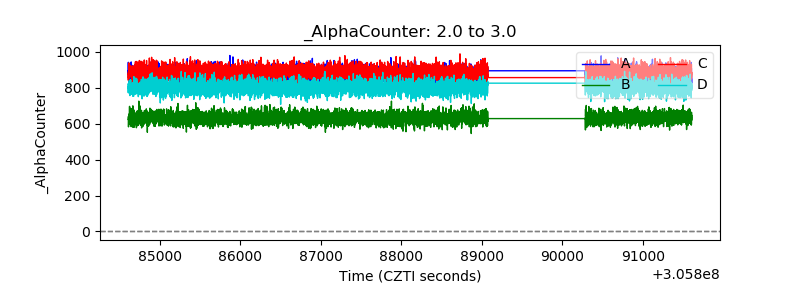 |
| _CPM_Rate | 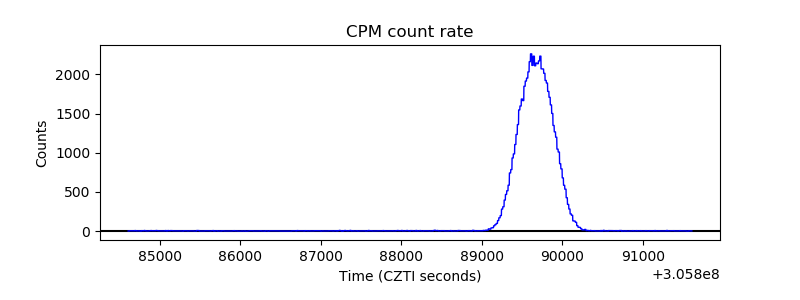 |
| CZT Counter | 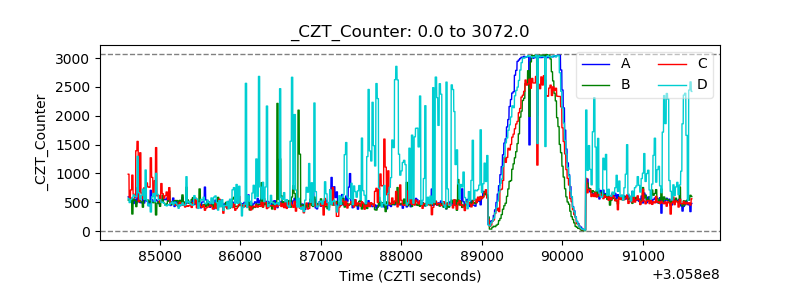 |
| +2.5 Volts monitor |  |
| +5 Volts monitor | 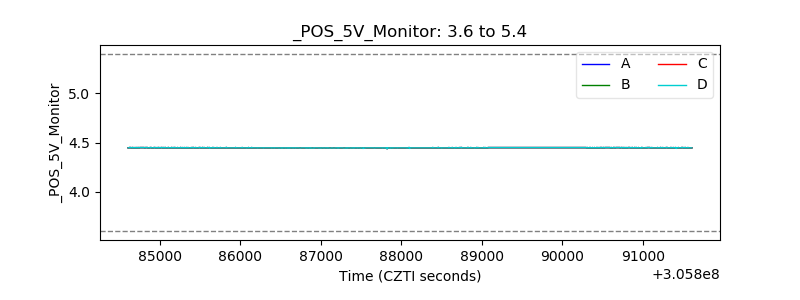 |
| _ROLL_ROT | 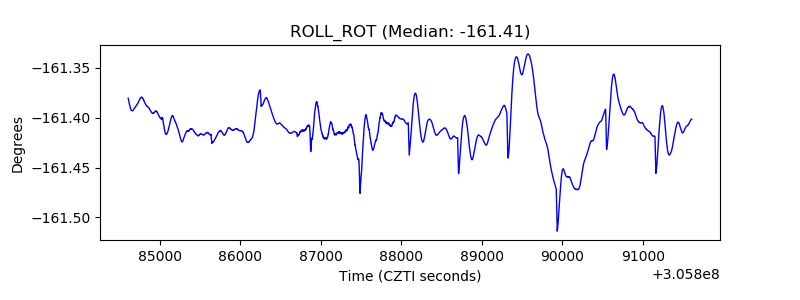 |
| _Roll_DEC | 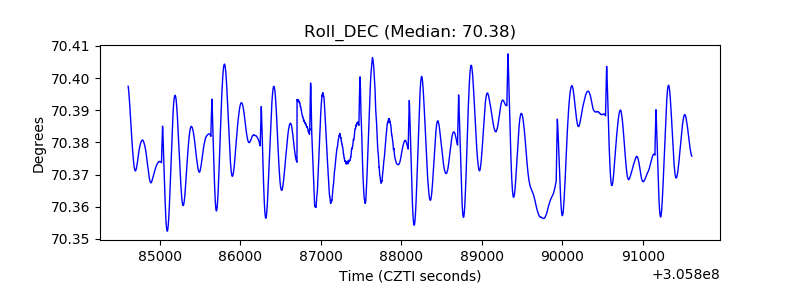 |
| _Roll_RA | 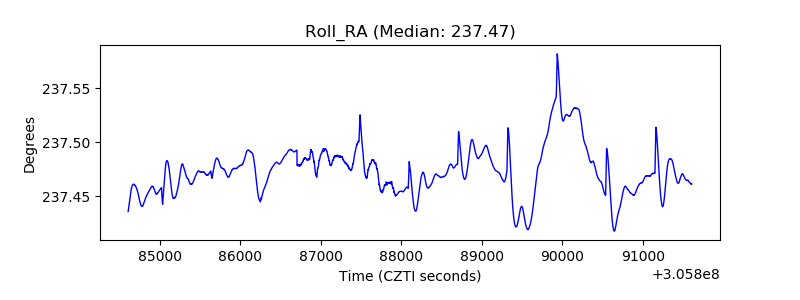 |
| Veto Counter | 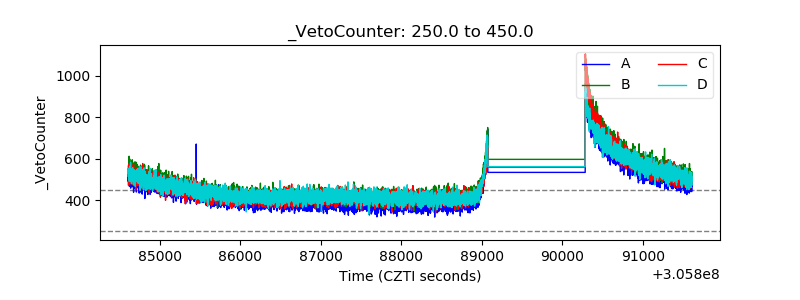 |