| Param | Original file | Final file |
|---|---|---|
| Filename | modeM0/AS1C04_001T01_9000003156_21378cztM0_level2.evt | modeM0/AS1C04_001T01_9000003156_21378cztM0_level2_quad_clean.evt |
| Size (bytes) | 611,896,320 | 113,783,040 |
| Size | 583.5 MB | 108.5 MB |
| Events in quadrant A | 4,110,331 | 795,556 |
| Events in quadrant B | 3,189,352 | 809,959 |
| Events in quadrant C | 2,955,374 | 755,154 |
| Events in quadrant D | 7,877,697 | 673,555 |
| Mode M0 | |||
|---|---|---|---|
| Quadrant | BADHDUFLAG | Total packets | Discarded packets |
| A | 0 | 15938 | 1 |
| B | 0 | 13092 | 1 |
| C | 0 | 12287 | 1 |
| D | 0 | 27457 | 1 |
| Mode M9 | |||
|---|---|---|---|
| Quadrant | BADHDUFLAG | Total packets | Discarded packets |
| A | 0 | 13 | 0 |
| B | 0 | 13 | 0 |
| C | 0 | 13 | 0 |
| D | 0 | 13 | 0 |
| Mode SS | |||
|---|---|---|---|
| Quadrant | BADHDUFLAG | Total packets | Discarded packets |
| A | 0 | 118 | 0 |
| B | 0 | 118 | 0 |
| C | 0 | 118 | 0 |
| D | 0 | 118 | 0 |
| Quadrant | Total seconds | Saturated seconds | Saturation percentage |
|---|---|---|---|
| A | 5893 | 356 | 6.041066% |
| B | 5894 | 94 | 1.594842% |
| C | 5894 | 82 | 1.391245% |
| D | 5894 | 1673 | 28.384798% |
Noise dominated data is calculated using 1-second bins in cleaned event files. If a bin has >2000 counts, and if more than 50% of those come from <1% of pixels, then it is considered to be noise-dominated and hence unusable.
| Quadrant | # 1 sec bins | Bins with >0 counts | Bins with >2000 counts | High rate bins dominated by noise | Noise dominated (total time) | Noise dominated (detector-on time) | Marked lightcurve |
|---|---|---|---|---|---|---|---|
| A | 7178 | 5893 | 244 | 244 | 3.40% | 4.14% | 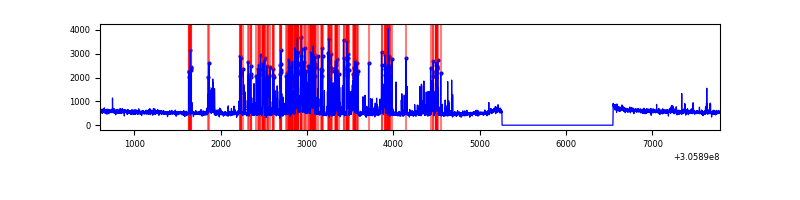 |
| B | 7179 | 5894 | 15 | 15 | 0.21% | 0.25% | 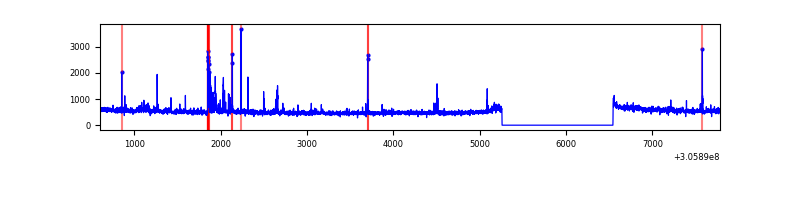 |
| C | 7179 | 5894 | 0 | 0 | 0.00% | 0.00% | 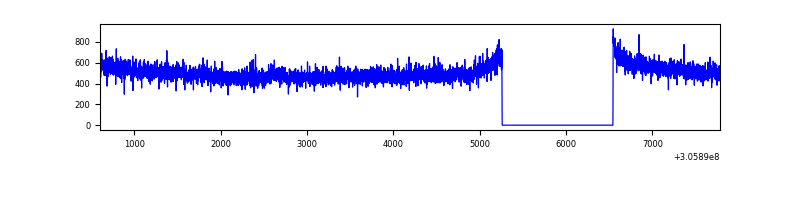 |
| D | 7179 | 5894 | 1592 | 1592 | 22.18% | 27.01% | 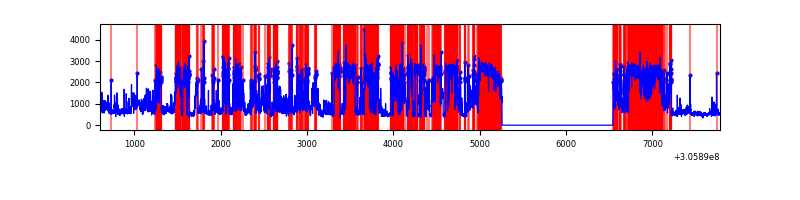 |
Top three noisy pixels from each quadrant. If the there are fewer than three noisy pixels in the level2.evt file, extra rows are filled as -1
| Pixel properties | Quadrant properties | ||||||
|---|---|---|---|---|---|---|---|
| Quadrant | DetID | PixID | Counts | Sigma | Mean | Median | Sigma |
| A | 5 | 16 | 1030282 | 6914.79 | 762 | 749 | 148.9 |
| A | 10 | 253 | 67132 | 445.86 | 762 | 749 | 148.9 |
| A | 15 | 174 | 59383 | 393.81 | 762 | 749 | 148.9 |
| B | 0 | 189 | 66359 | 470.92 | 757 | 741 | 139.3 |
| B | 0 | 230 | 58725 | 416.13 | 757 | 741 | 139.3 |
| B | 0 | 190 | 45651 | 322.3 | 757 | 741 | 139.3 |
| C | 14 | 238 | 117078 | 707.59 | 720 | 725 | 164.4 |
| C | 10 | 91 | 31276 | 185.79 | 720 | 725 | 164.4 |
| C | 13 | 61 | 5158 | 26.96 | 720 | 725 | 164.4 |
| D | 1 | 52 | 4476203 | 27987.57 | 666 | 649 | 159.9 |
| D | 12 | 235 | 232212 | 1448.06 | 666 | 649 | 159.9 |
| D | 11 | 135 | 214770 | 1338.99 | 666 | 649 | 159.9 |
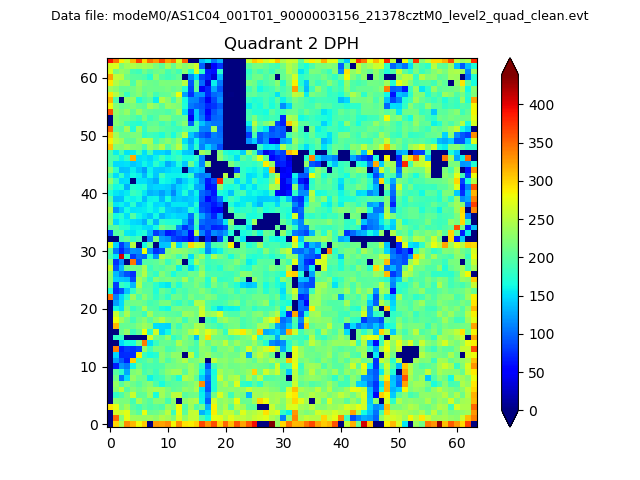
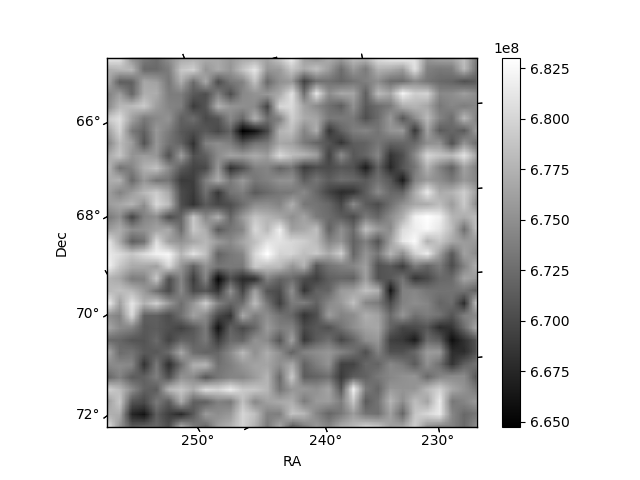
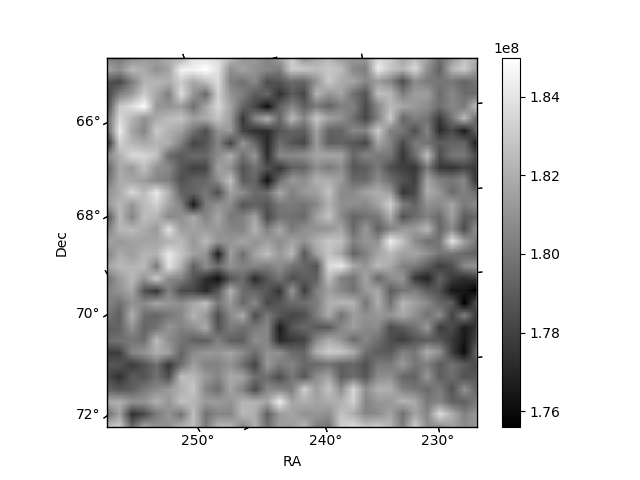
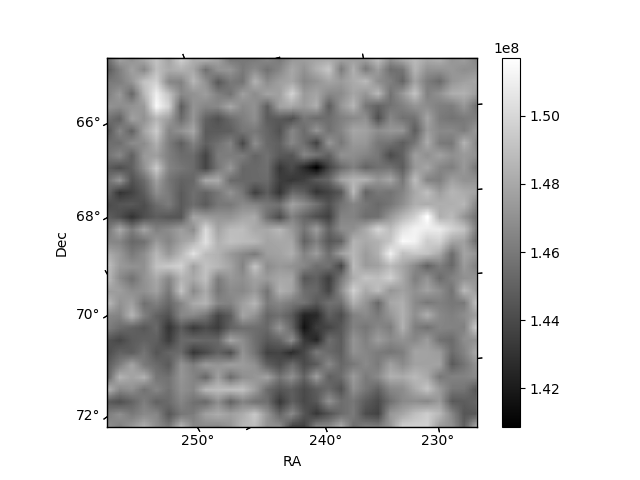
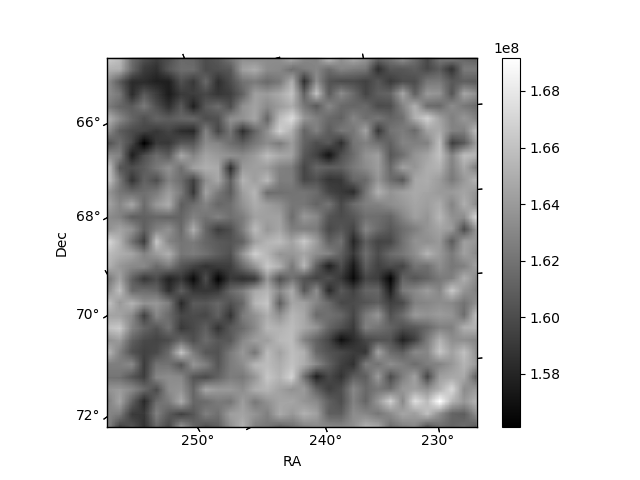
Histogram calculated using DETX and DETY for each event in the final _common_clean file
| Quadrant A | 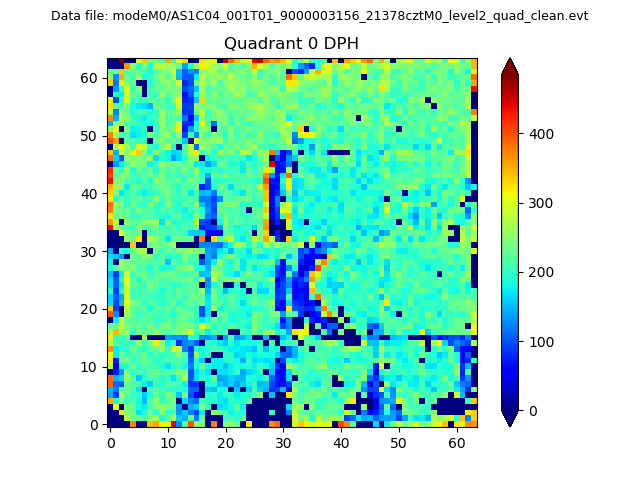 |
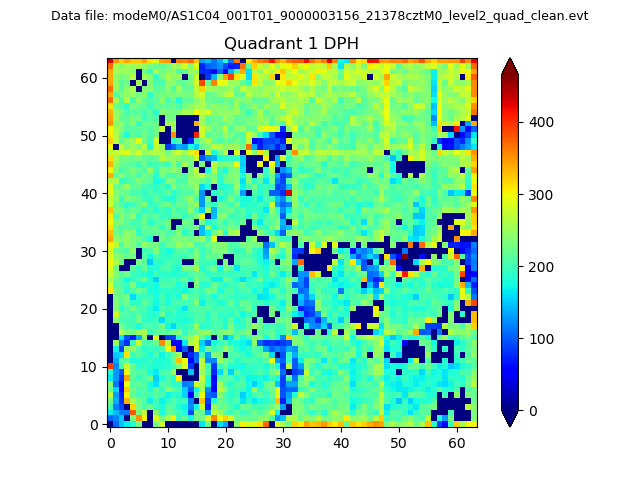 |
Quadrant B |
|---|---|---|---|
| Quadrant D | 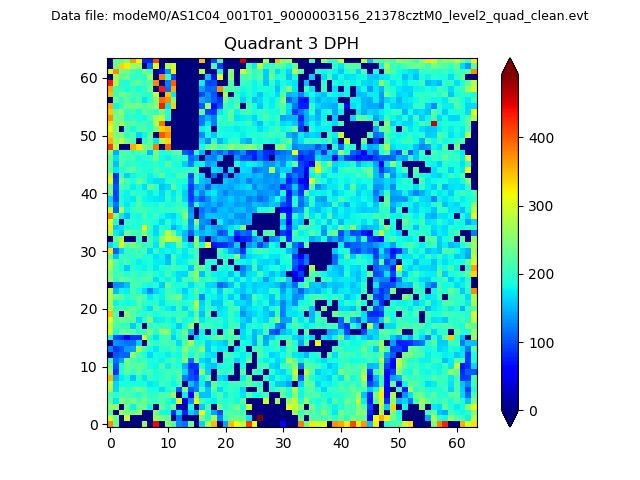 |
 |
Quadrant C |
| Plot type | Count rate plots | Images |
|---|---|---|
| Comparison with Poisson distribution Blue bars denote a histogram of data divided into 1 sec bins. Red curve is a Poisson curve with rate = median count rate of data. |
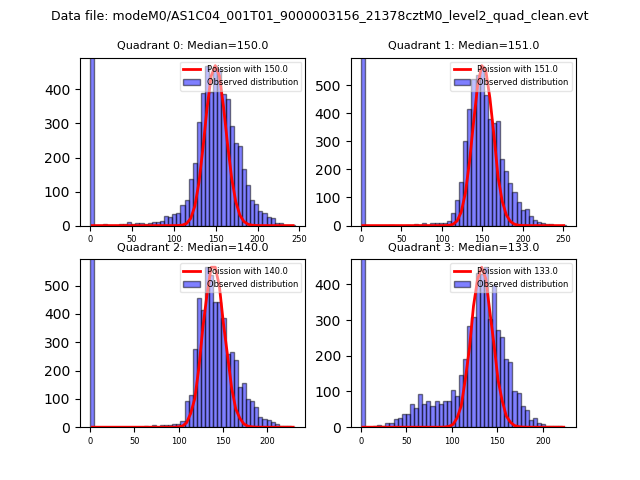 |
 |
| Quadrant-wise count rates Data is divided into 100 sec bins |
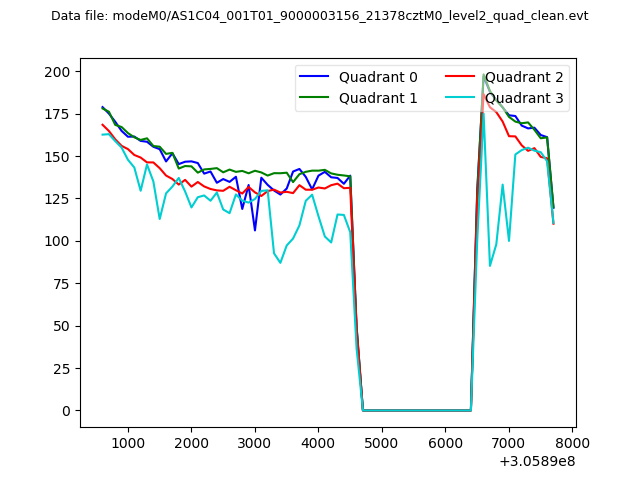 |
|
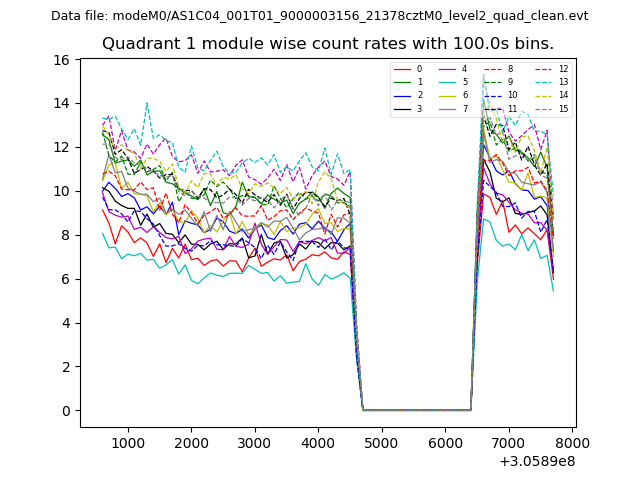
| Module-wise count rates for Quadrant A Data is divided into 100 sec bins |
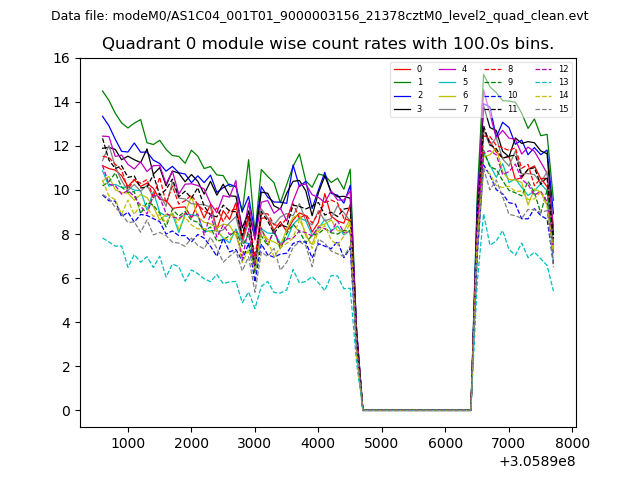 |
 |
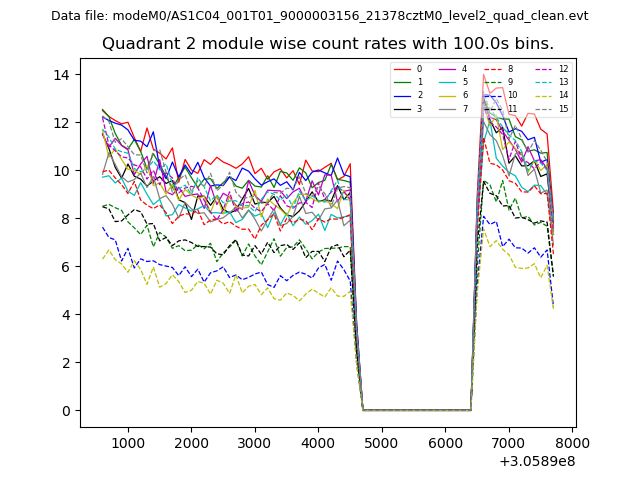
| Module-wise count rates for Quadrant B Data is divided into 100 sec bins |
 |
 |
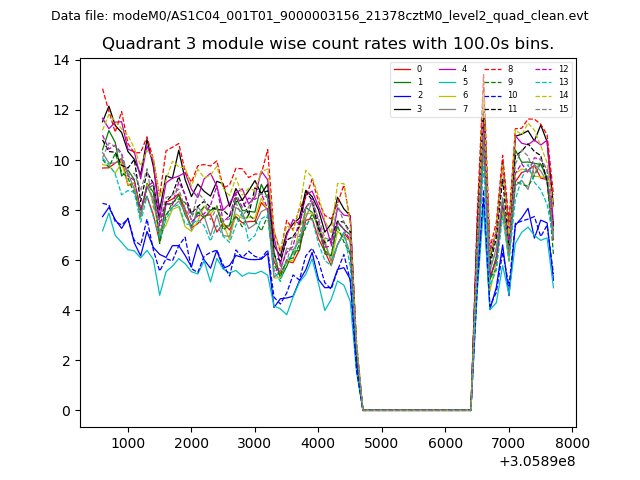
| Module-wise count rates for Quadrant C Data is divided into 100 sec bins |
 |
 |
| Module-wise count rates for Quadrant D Data is divided into 100 sec bins |
 |
 |
| Parameter | Plot |
|---|---|
| CZT HV Monitor | 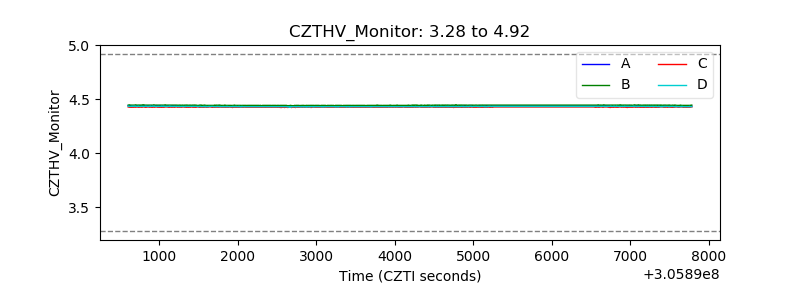 |
| D_VDD | 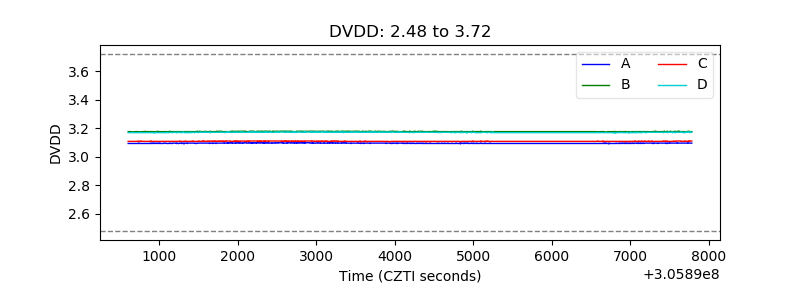 |
| Temperature 1 | 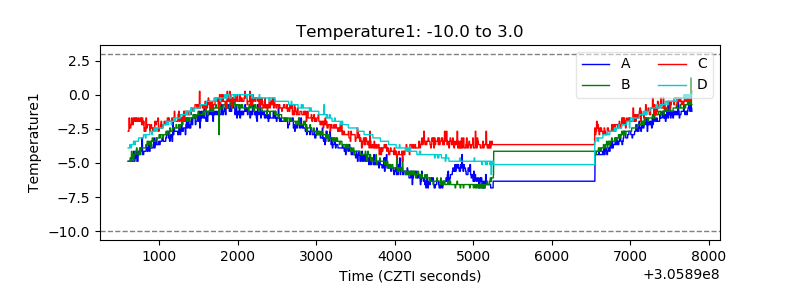 |
| Veto HV Monitor | 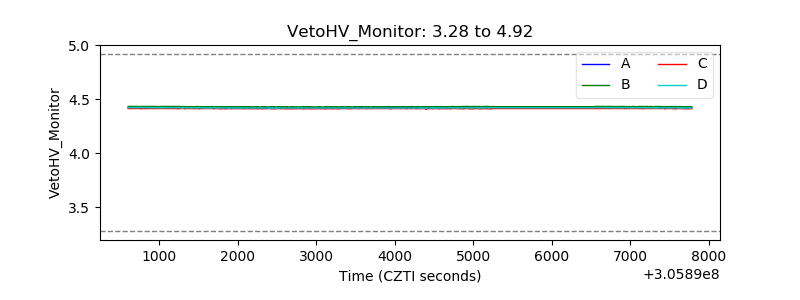 |
| Veto LLD | 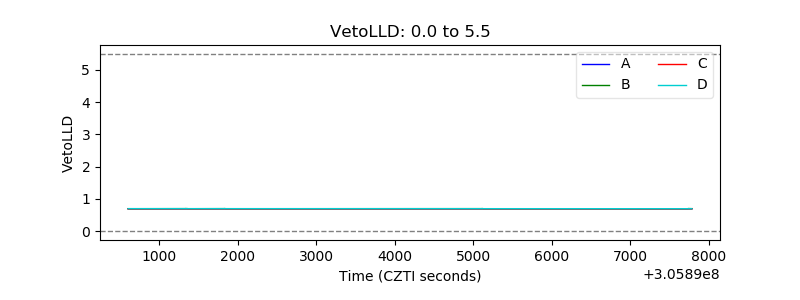 |
| Alpha Counter |  |
| _CPM_Rate | 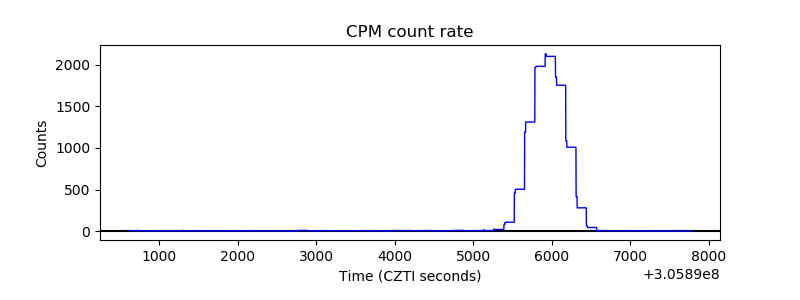 |
| CZT Counter | 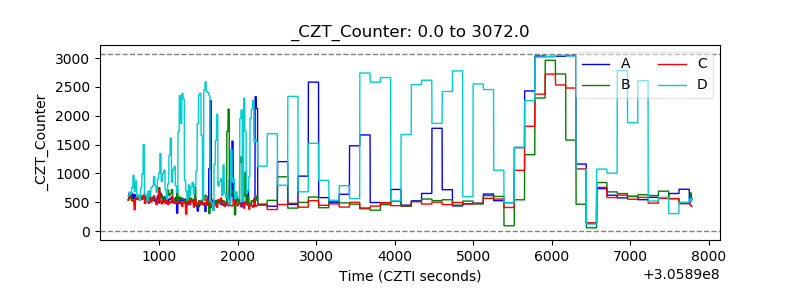 |
| +2.5 Volts monitor | 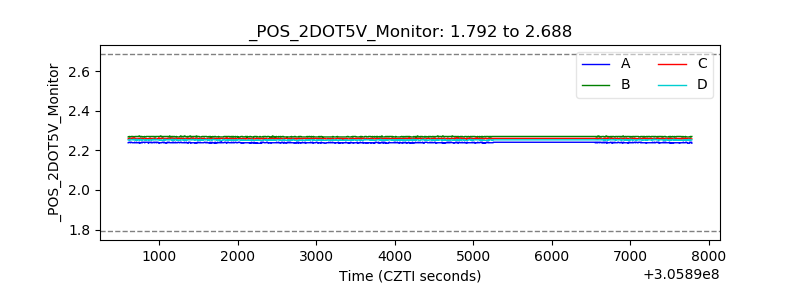 |
| +5 Volts monitor |  |
| _ROLL_ROT | 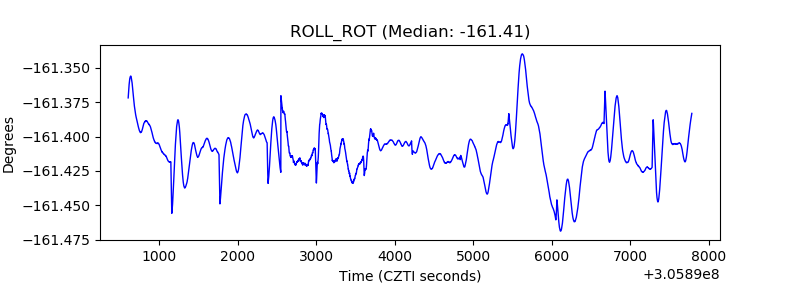 |
| _Roll_DEC | 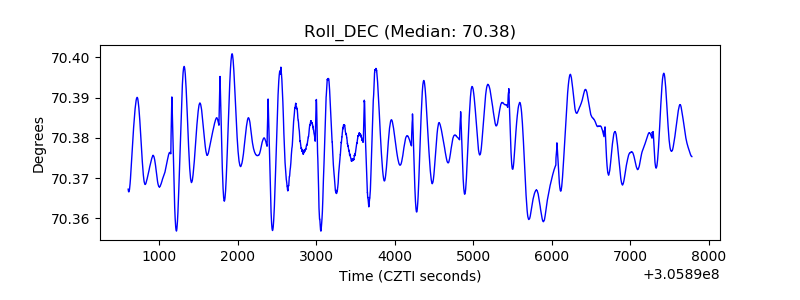 |
| _Roll_RA | 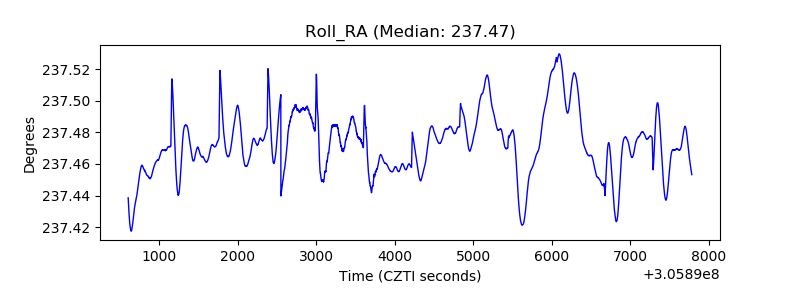 |
| Veto Counter | 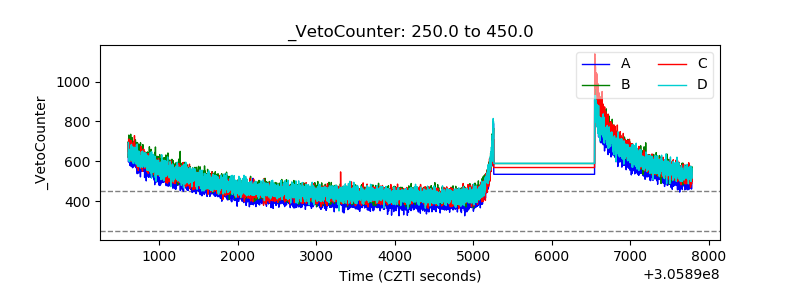 |