| Param | Original file | Final file |
|---|---|---|
| Filename | modeM0/AS1C04_001T01_9000003156_21379cztM0_level2.evt | modeM0/AS1C04_001T01_9000003156_21379cztM0_level2_quad_clean.evt |
| Size (bytes) | 540,498,240 | 125,017,920 |
| Size | 515.5 MB | 119.2 MB |
| Events in quadrant A | 3,563,220 | 874,110 |
| Events in quadrant B | 3,507,798 | 868,948 |
| Events in quadrant C | 3,412,325 | 813,207 |
| Events in quadrant D | 5,441,797 | 773,524 |
| Mode M0 | |||
|---|---|---|---|
| Quadrant | BADHDUFLAG | Total packets | Discarded packets |
| A | 0 | 14542 | 2 |
| B | 0 | 14468 | 2 |
| C | 0 | 14015 | 2 |
| D | 0 | 20524 | 2 |
| Mode M9 | |||
|---|---|---|---|
| Quadrant | BADHDUFLAG | Total packets | Discarded packets |
| A | 0 | 13 | 0 |
| B | 0 | 14 | 0 |
| C | 0 | 14 | 0 |
| D | 0 | 14 | 0 |
| Mode SS | |||
|---|---|---|---|
| Quadrant | BADHDUFLAG | Total packets | Discarded packets |
| A | 0 | 132 | 0 |
| B | 0 | 132 | 0 |
| C | 0 | 132 | 0 |
| D | 0 | 132 | 0 |
| Quadrant | Total seconds | Saturated seconds | Saturation percentage |
|---|---|---|---|
| A | 6552 | 84 | 1.282051% |
| B | 6552 | 70 | 1.068376% |
| C | 6552 | 101 | 1.541514% |
| D | 6552 | 656 | 10.012210% |
Noise dominated data is calculated using 1-second bins in cleaned event files. If a bin has >2000 counts, and if more than 50% of those come from <1% of pixels, then it is considered to be noise-dominated and hence unusable.
| Quadrant | # 1 sec bins | Bins with >0 counts | Bins with >2000 counts | High rate bins dominated by noise | Noise dominated (total time) | Noise dominated (detector-on time) | Marked lightcurve |
|---|---|---|---|---|---|---|---|
| A | 7842 | 6552 | 7 | 7 | 0.09% | 0.11% | 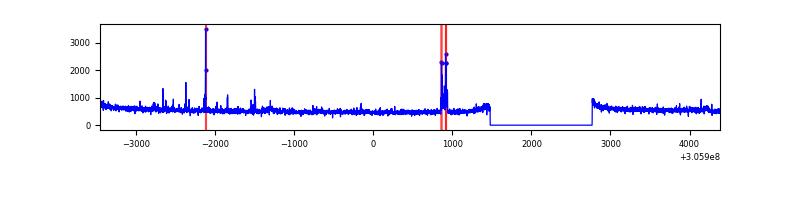 |
| B | 7842 | 6552 | 5 | 5 | 0.06% | 0.08% | 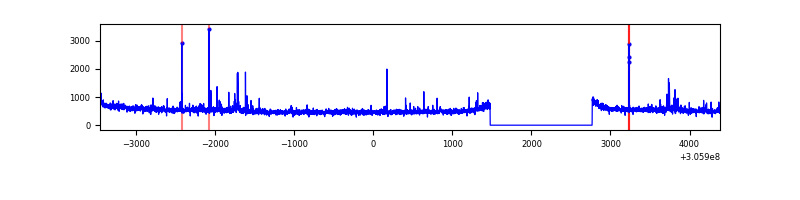 |
| C | 7842 | 6552 | 1 | 1 | 0.01% | 0.02% | 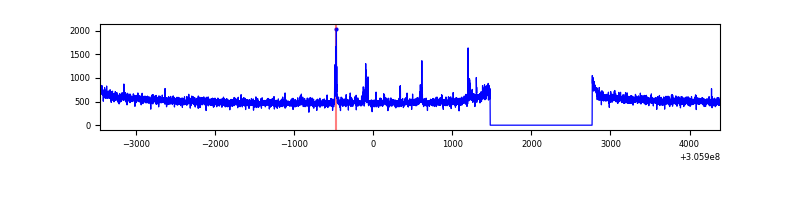 |
| D | 7842 | 6552 | 542 | 542 | 6.91% | 8.27% |  |
Top three noisy pixels from each quadrant. If the there are fewer than three noisy pixels in the level2.evt file, extra rows are filled as -1
| Pixel properties | Quadrant properties | ||||||
|---|---|---|---|---|---|---|---|
| Quadrant | DetID | PixID | Counts | Sigma | Mean | Median | Sigma |
| A | 5 | 168 | 99644 | 579.67 | 870 | 855 | 170.4 |
| A | 5 | 16 | 92992 | 540.64 | 870 | 855 | 170.4 |
| A | 13 | 254 | 10739 | 58.0 | 870 | 855 | 170.4 |
| B | 0 | 190 | 58845 | 370.59 | 851 | 831 | 156.5 |
| B | 0 | 230 | 54559 | 343.21 | 851 | 831 | 156.5 |
| B | 0 | 228 | 22770 | 140.14 | 851 | 831 | 156.5 |
| C | 14 | 238 | 130976 | 689.81 | 817 | 823 | 188.7 |
| C | 3 | 233 | 84131 | 441.53 | 817 | 823 | 188.7 |
| C | 10 | 91 | 9945 | 48.35 | 817 | 823 | 188.7 |
| D | 1 | 52 | 1251882 | 6375.79 | 816 | 793 | 196.2 |
| D | 12 | 235 | 398217 | 2025.35 | 816 | 793 | 196.2 |
| D | 13 | 153 | 180236 | 914.47 | 816 | 793 | 196.2 |
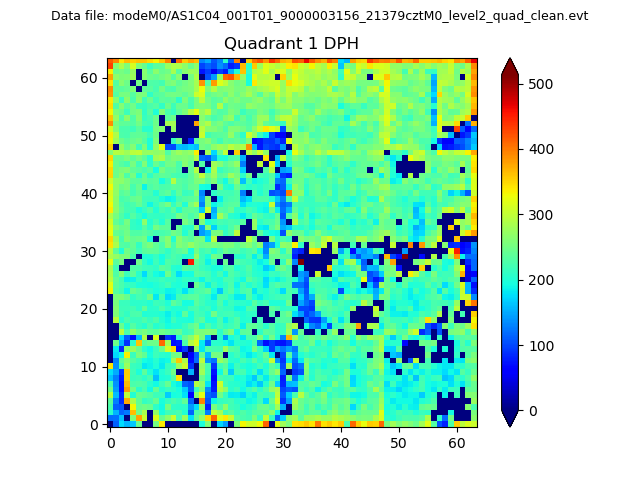
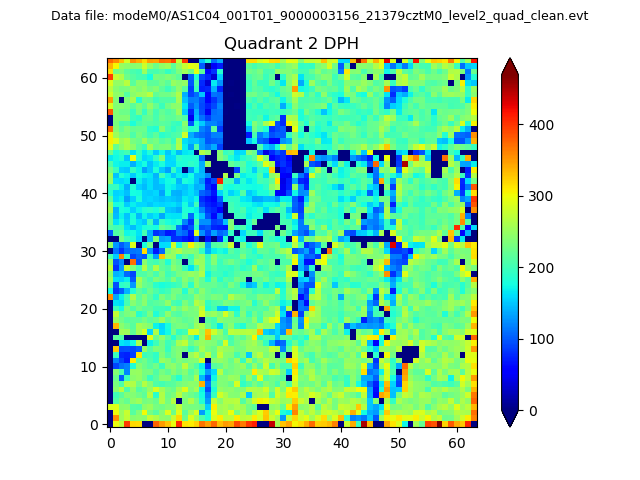
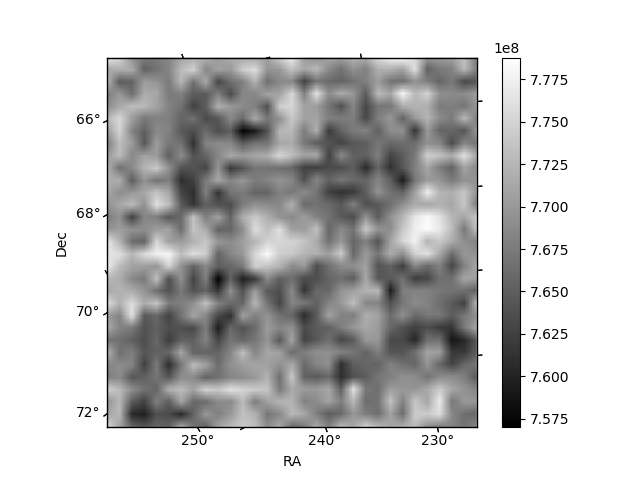
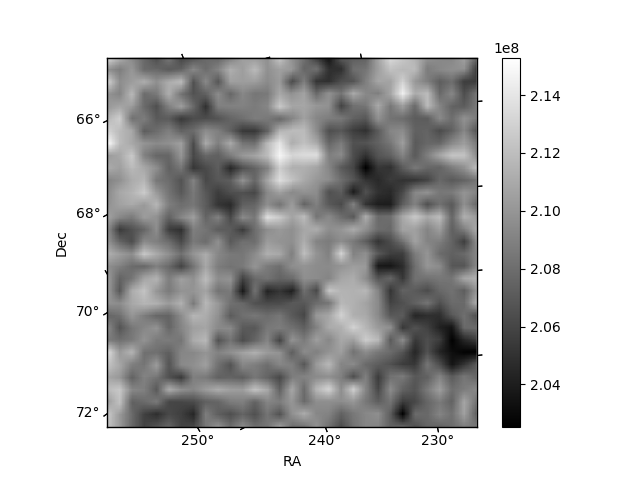
Histogram calculated using DETX and DETY for each event in the final _common_clean file
| Quadrant A | 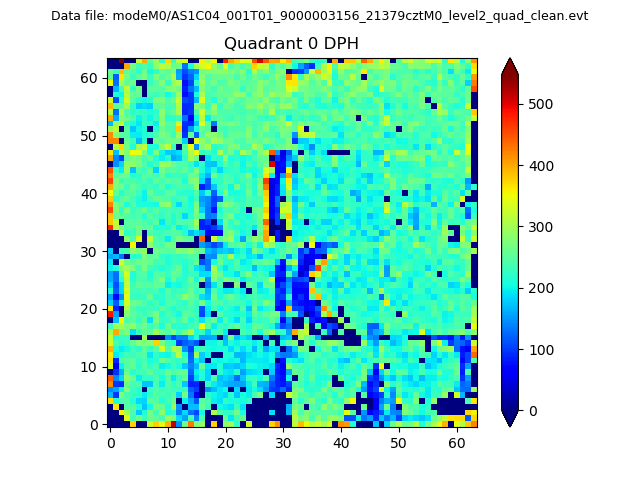 |
 |
Quadrant B |
|---|---|---|---|
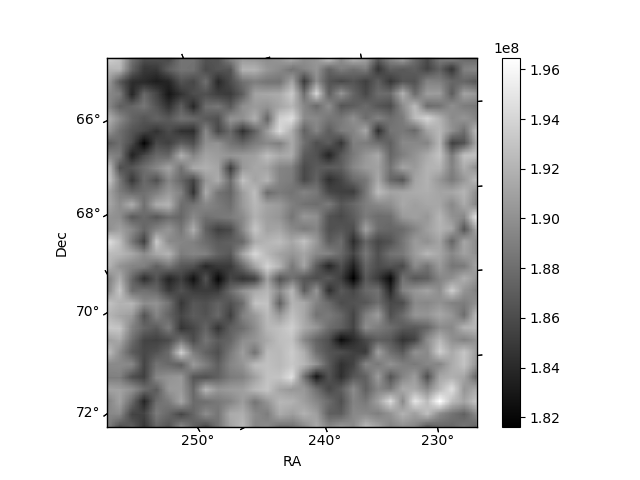
| Quadrant D | 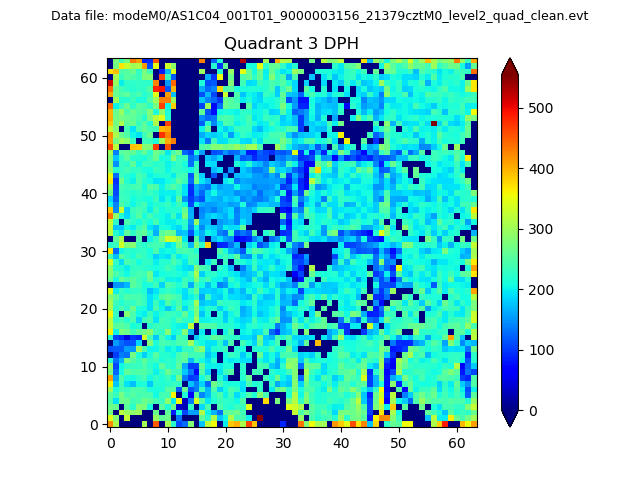 |
 |
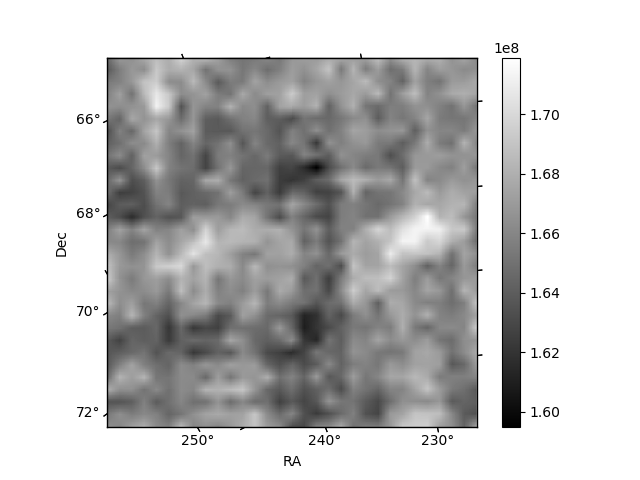
Quadrant C |
| Plot type | Count rate plots | Images |
|---|---|---|
| Comparison with Poisson distribution Blue bars denote a histogram of data divided into 1 sec bins. Red curve is a Poisson curve with rate = median count rate of data. |
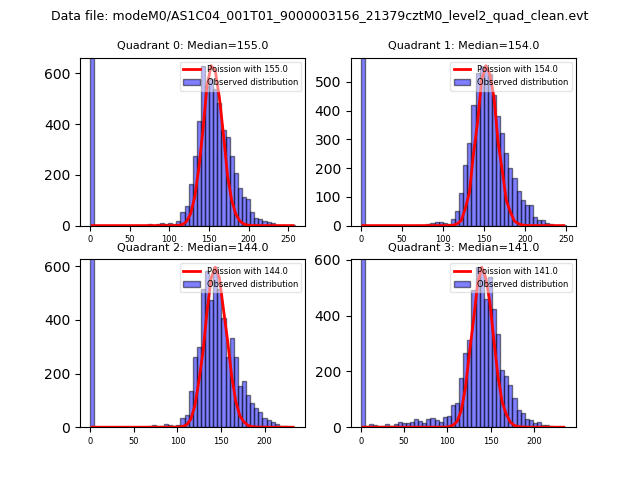 |
 |
| Quadrant-wise count rates Data is divided into 100 sec bins |
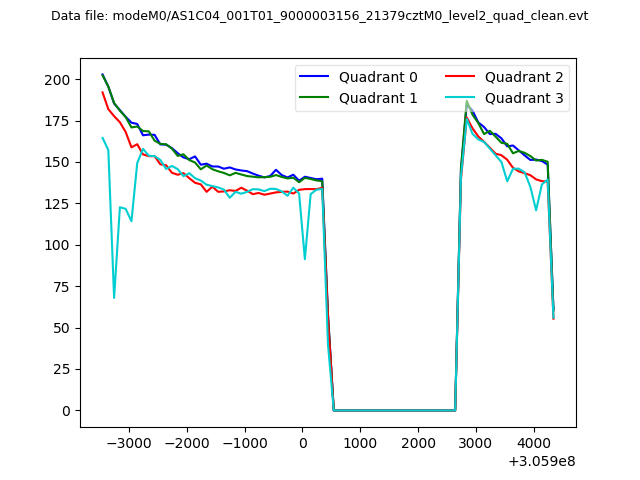 |
|
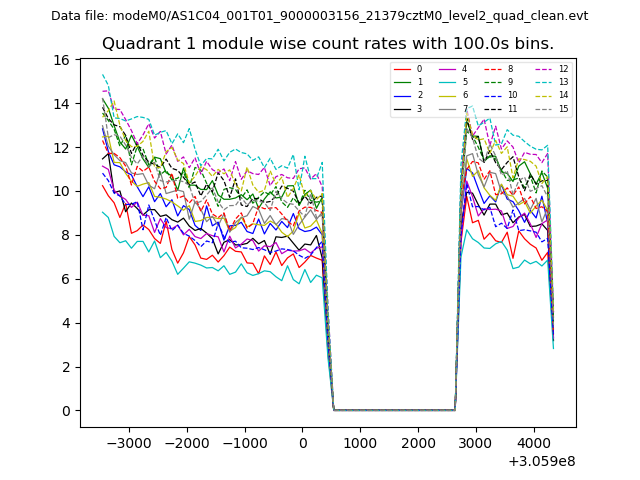
| Module-wise count rates for Quadrant A Data is divided into 100 sec bins |
 |
 |
| Module-wise count rates for Quadrant B Data is divided into 100 sec bins |
 |
 |
| Module-wise count rates for Quadrant C Data is divided into 100 sec bins |
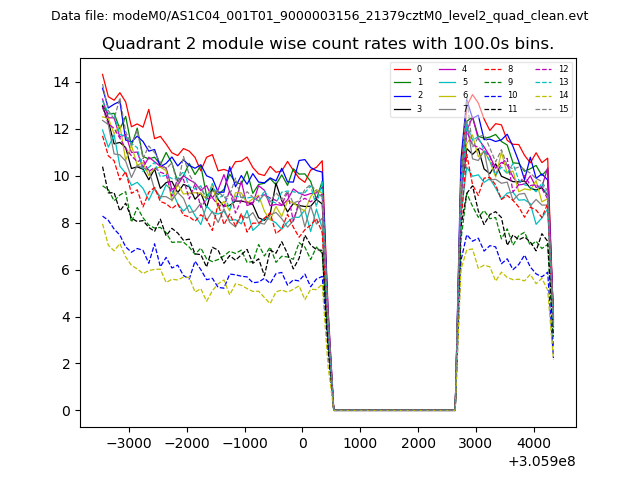 |
 |
| Module-wise count rates for Quadrant D Data is divided into 100 sec bins |
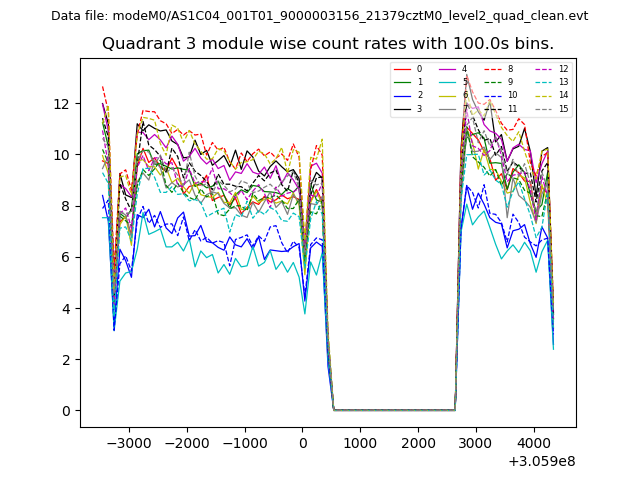 |
 |
| Parameter | Plot |
|---|---|
| CZT HV Monitor | 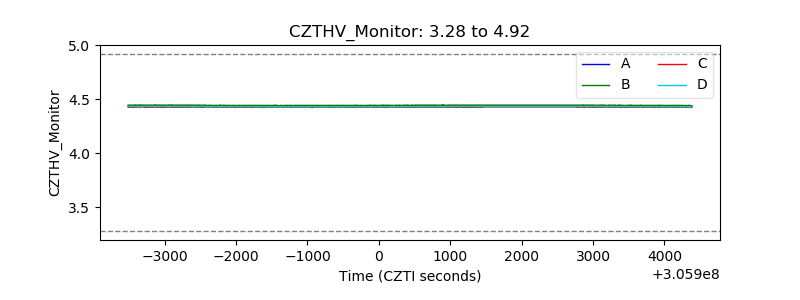 |
| D_VDD |  |
| Temperature 1 | 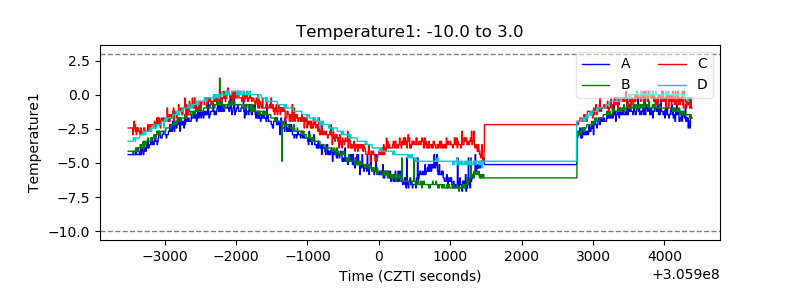 |
| Veto HV Monitor | 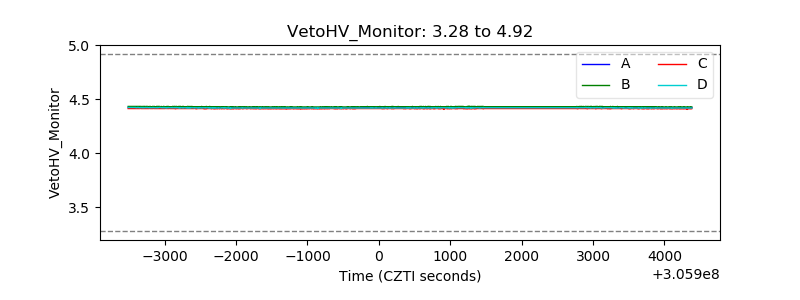 |
| Veto LLD | 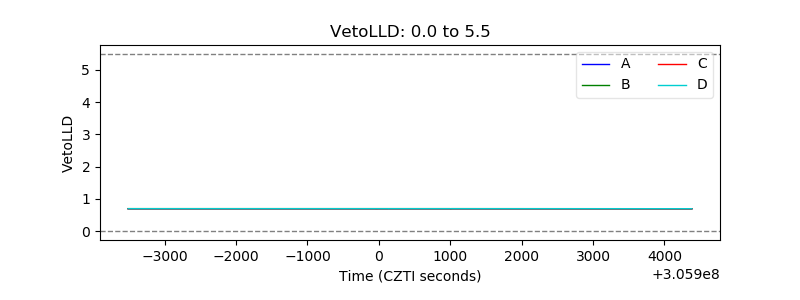 |
| Alpha Counter | 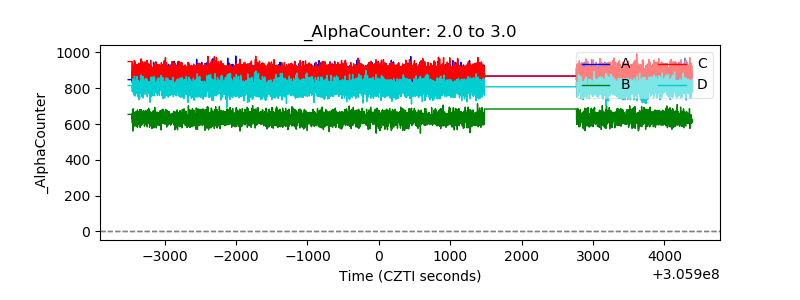 |
| _CPM_Rate | 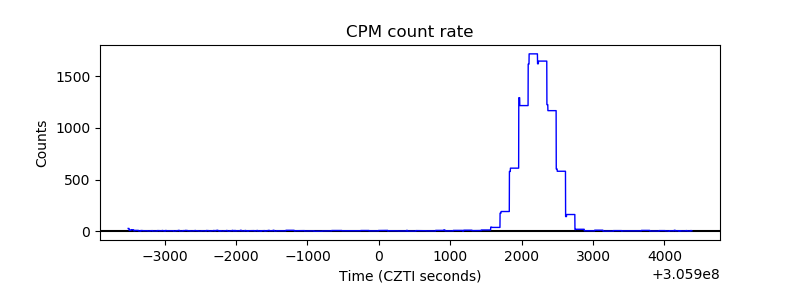 |
| CZT Counter | 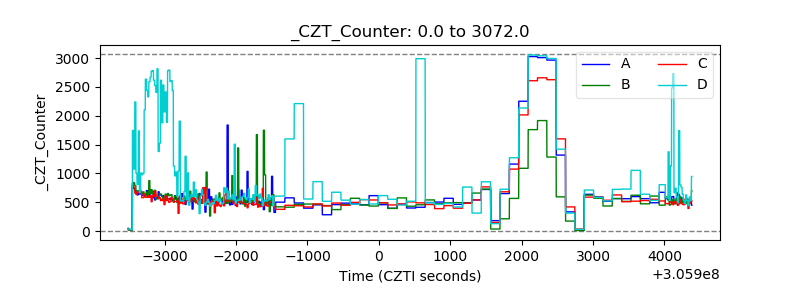 |
| +2.5 Volts monitor | 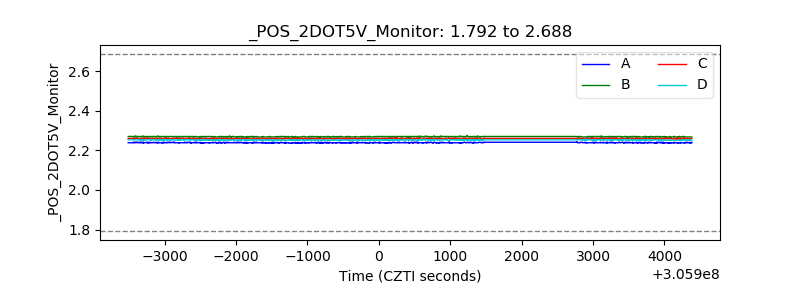 |
| +5 Volts monitor |  |
| _ROLL_ROT | 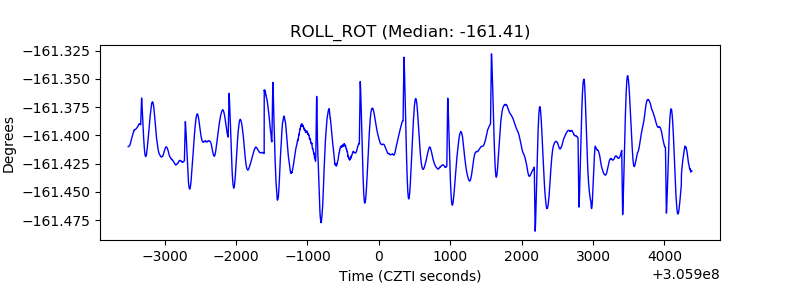 |
| _Roll_DEC | 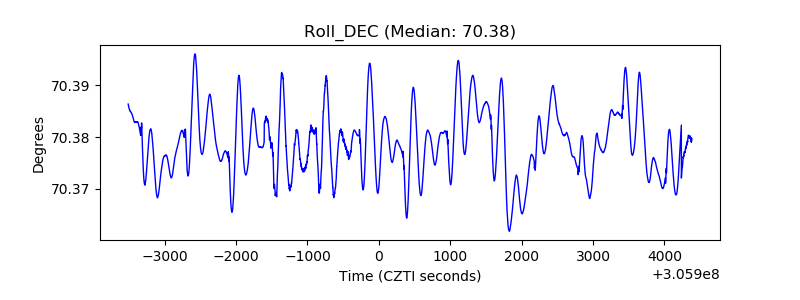 |
| _Roll_RA | 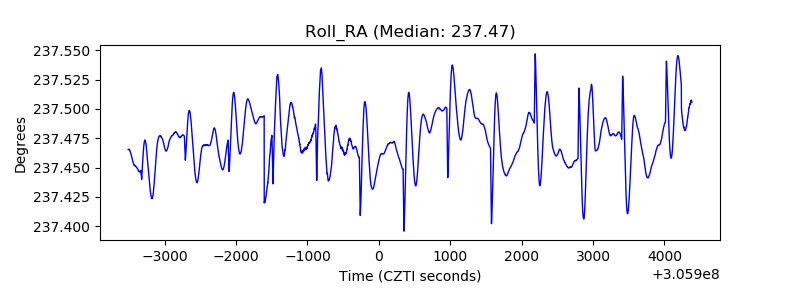 |
| Veto Counter | 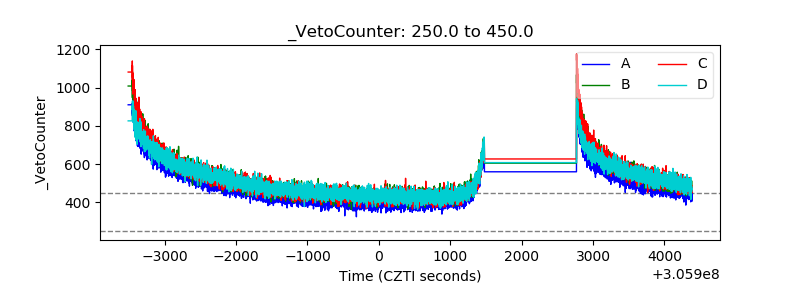 |