| Param | Original file | Final file |
|---|---|---|
| Filename | modeM0/AS1C04_001T01_9000003156_21383cztM0_level2.evt | modeM0/AS1C04_001T01_9000003156_21383cztM0_level2_quad_clean.evt |
| Size (bytes) | 575,879,040 | 115,816,320 |
| Size | 549.2 MB | 110.5 MB |
| Events in quadrant A | 3,531,947 | 774,303 |
| Events in quadrant B | 3,598,296 | 778,178 |
| Events in quadrant C | 4,082,786 | 738,924 |
| Events in quadrant D | 5,737,130 | 712,374 |
| Mode M0 | |||
|---|---|---|---|
| Quadrant | BADHDUFLAG | Total packets | Discarded packets |
| A | 0 | 15280 | 2 |
| B | 0 | 15612 | 2 |
| C | 0 | 16797 | 2 |
| D | 0 | 22040 | 2 |
| Mode M9 | |||
|---|---|---|---|
| Quadrant | BADHDUFLAG | Total packets | Discarded packets |
| A | 0 | 8 | 0 |
| B | 0 | 9 | 0 |
| C | 0 | 9 | 0 |
| D | 0 | 9 | 0 |
| Mode SS | |||
|---|---|---|---|
| Quadrant | BADHDUFLAG | Total packets | Discarded packets |
| A | 0 | 146 | 0 |
| B | 0 | 146 | 0 |
| C | 0 | 146 | 0 |
| D | 0 | 146 | 0 |
| Quadrant | Total seconds | Saturated seconds | Saturation percentage |
|---|---|---|---|
| A | 7236 | 33 | 0.456053% |
| B | 7236 | 57 | 0.787728% |
| C | 7236 | 159 | 2.197347% |
| D | 7236 | 603 | 8.333333% |
Noise dominated data is calculated using 1-second bins in cleaned event files. If a bin has >2000 counts, and if more than 50% of those come from <1% of pixels, then it is considered to be noise-dominated and hence unusable.
| Quadrant | # 1 sec bins | Bins with >0 counts | Bins with >2000 counts | High rate bins dominated by noise | Noise dominated (total time) | Noise dominated (detector-on time) | Marked lightcurve |
|---|---|---|---|---|---|---|---|
| A | 7611 | 7236 | 3 | 3 | 0.04% | 0.04% | 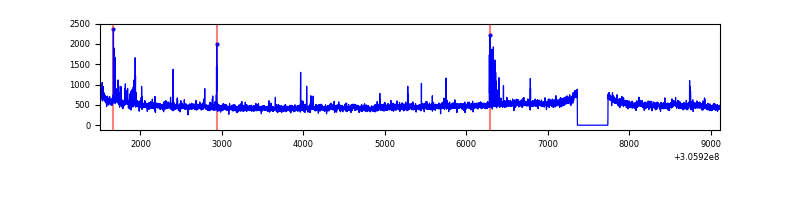 |
| B | 7611 | 7237 | 15 | 15 | 0.20% | 0.21% | 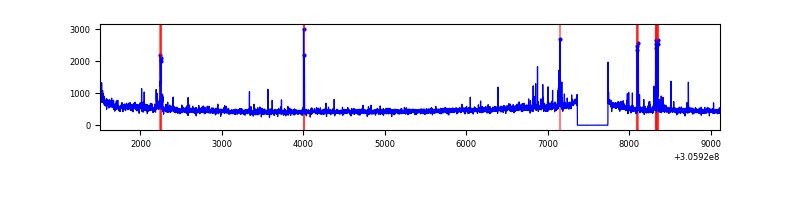 |
| C | 7611 | 7237 | 41 | 41 | 0.54% | 0.57% | 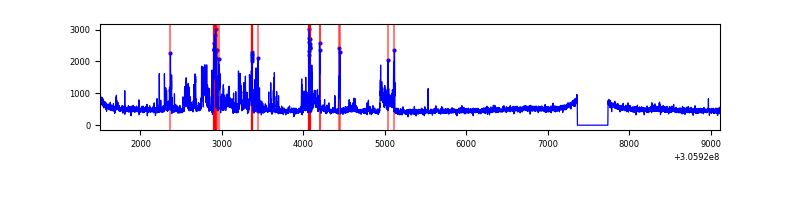 |
| D | 7611 | 7237 | 429 | 429 | 5.64% | 5.93% | 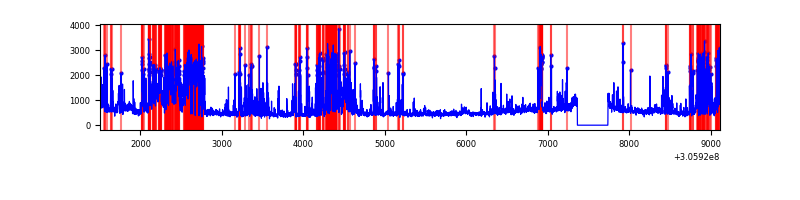 |
Top three noisy pixels from each quadrant. If the there are fewer than three noisy pixels in the level2.evt file, extra rows are filled as -1
| Pixel properties | Quadrant properties | ||||||
|---|---|---|---|---|---|---|---|
| Quadrant | DetID | PixID | Counts | Sigma | Mean | Median | Sigma |
| A | 5 | 168 | 112670 | 651.12 | 855 | 836 | 171.8 |
| A | 5 | 16 | 84170 | 485.18 | 855 | 836 | 171.8 |
| A | 15 | 174 | 15069 | 82.87 | 855 | 836 | 171.8 |
| B | 0 | 228 | 51829 | 314.44 | 854 | 833 | 162.2 |
| B | 0 | 229 | 45232 | 273.77 | 854 | 833 | 162.2 |
| B | 0 | 189 | 38292 | 230.97 | 854 | 833 | 162.2 |
| C | 3 | 233 | 736969 | 3890.53 | 821 | 825 | 189.2 |
| C | 14 | 238 | 128327 | 673.85 | 821 | 825 | 189.2 |
| C | 0 | 236 | 7795 | 36.84 | 821 | 825 | 189.2 |
| D | 13 | 174 | 1211478 | 6121.28 | 819 | 796 | 197.8 |
| D | 1 | 52 | 825801 | 4171.28 | 819 | 796 | 197.8 |
| D | 12 | 235 | 285072 | 1437.32 | 819 | 796 | 197.8 |
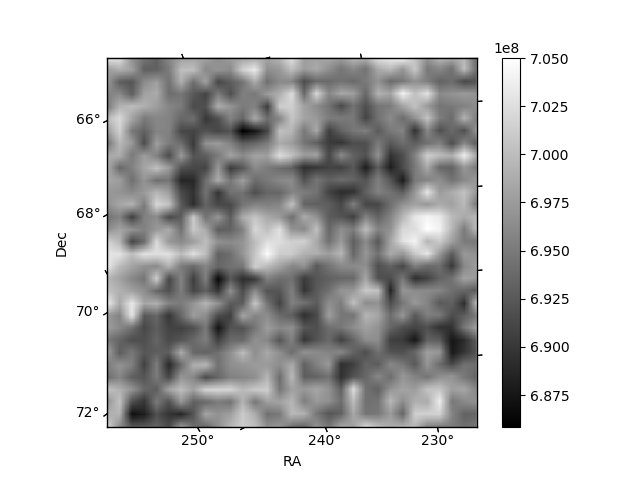
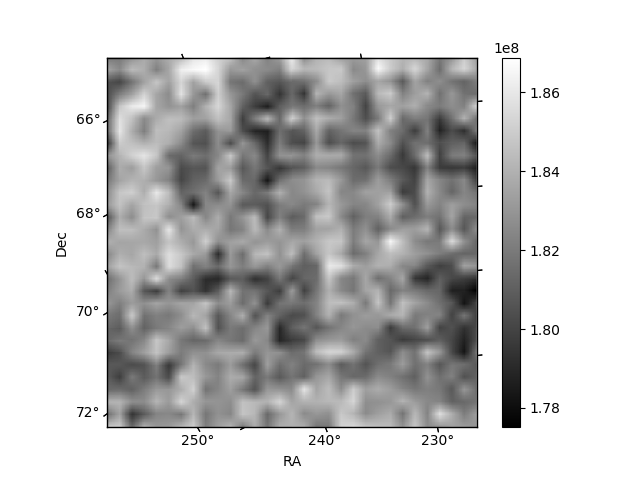
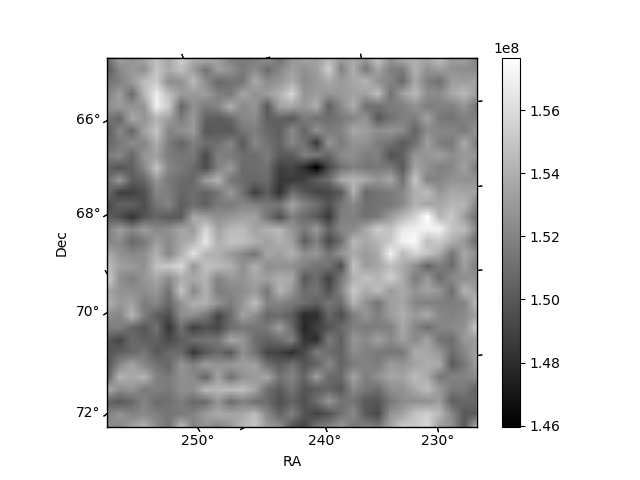
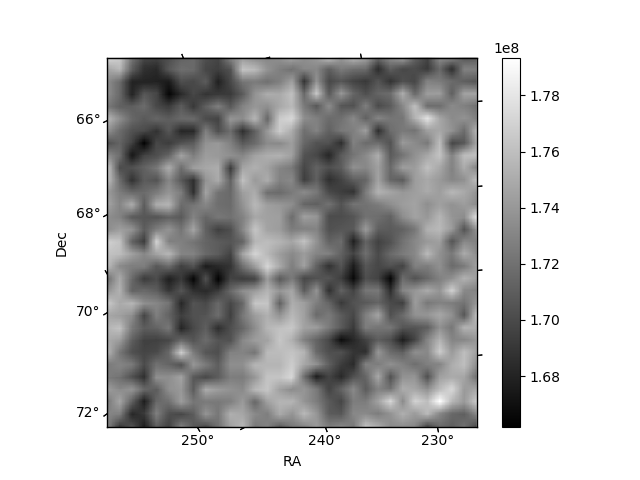
Histogram calculated using DETX and DETY for each event in the final _common_clean file
| Quadrant A | 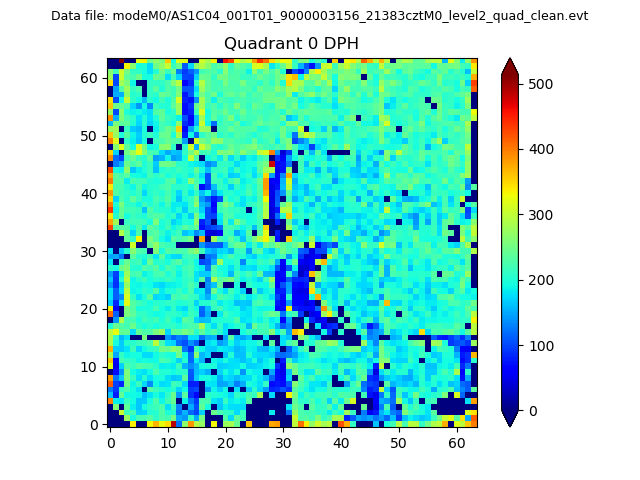 |
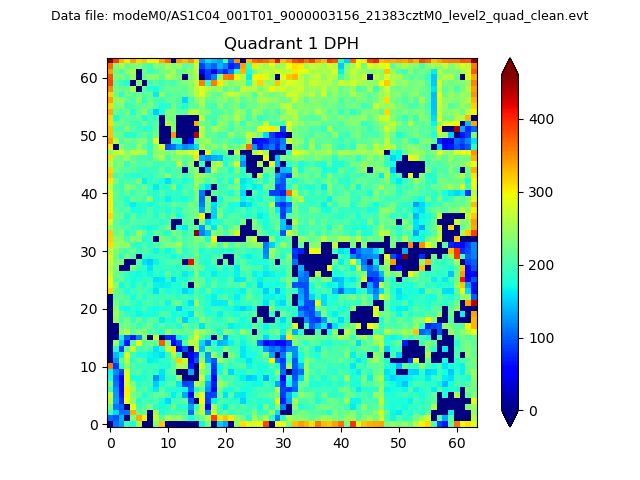 |
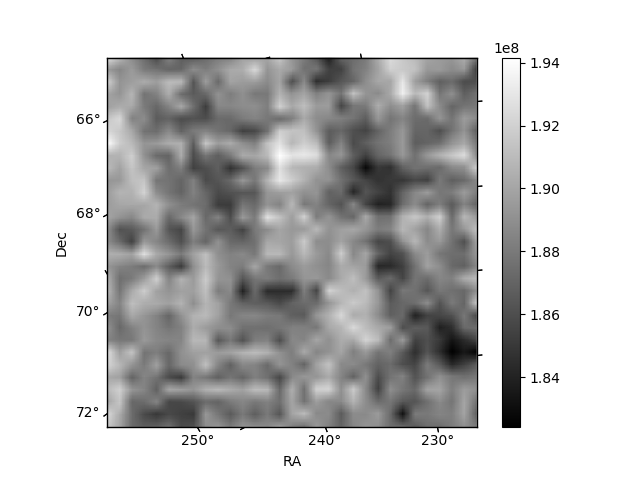
Quadrant B |
|---|---|---|---|
| Quadrant D | 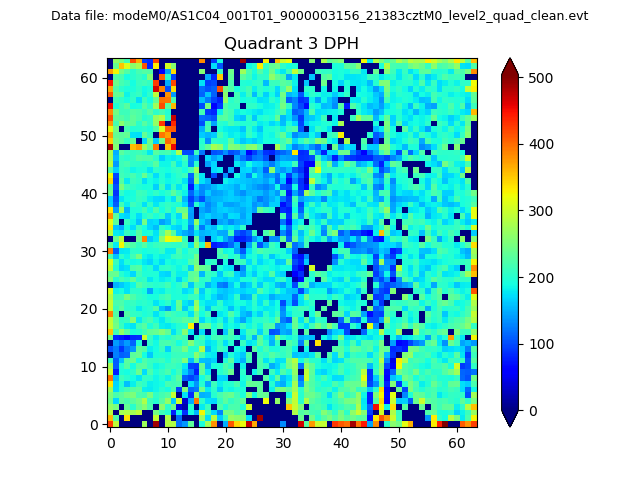 |
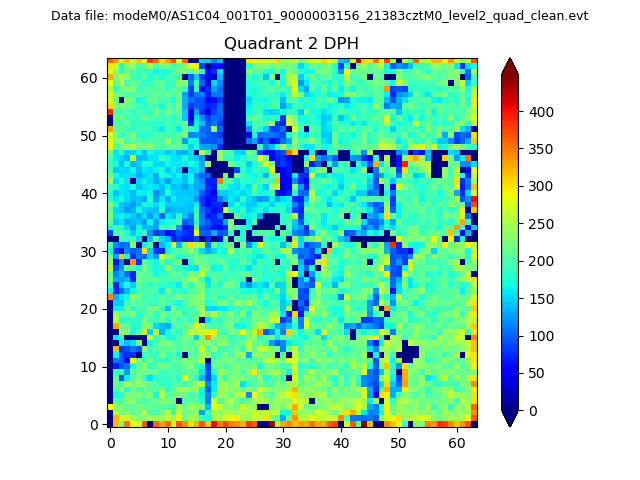 |
Quadrant C |
| Plot type | Count rate plots | Images |
|---|---|---|
| Comparison with Poisson distribution Blue bars denote a histogram of data divided into 1 sec bins. Red curve is a Poisson curve with rate = median count rate of data. |
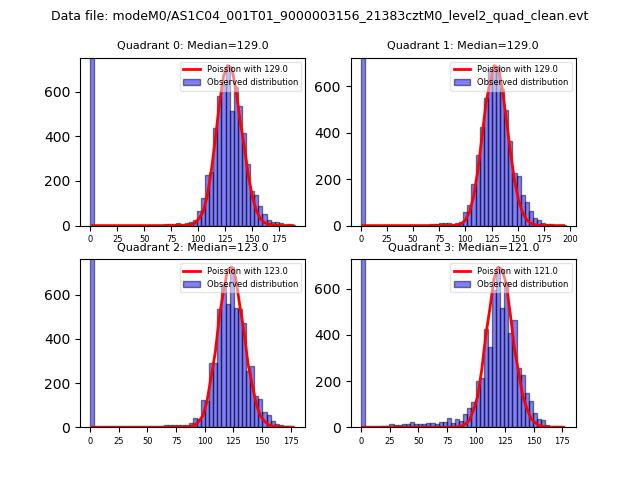 |
 |
| Quadrant-wise count rates Data is divided into 100 sec bins |
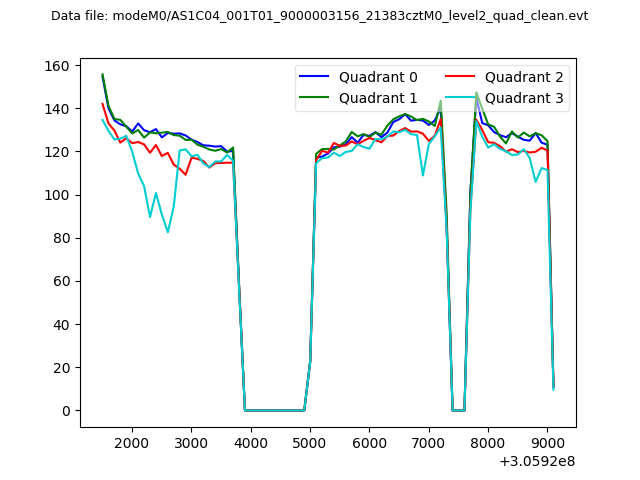 |
|
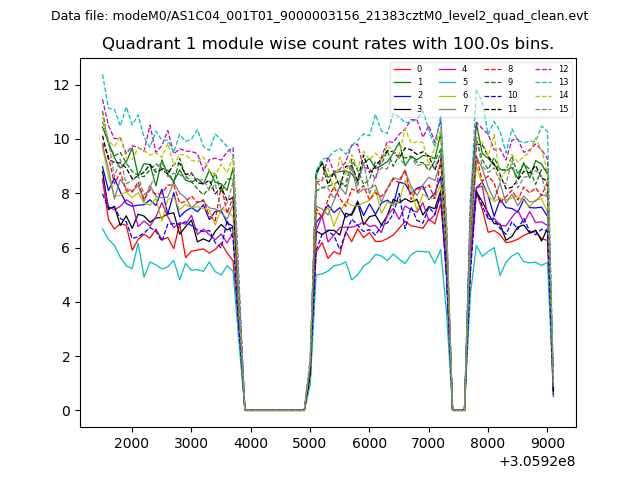
| Module-wise count rates for Quadrant A Data is divided into 100 sec bins |
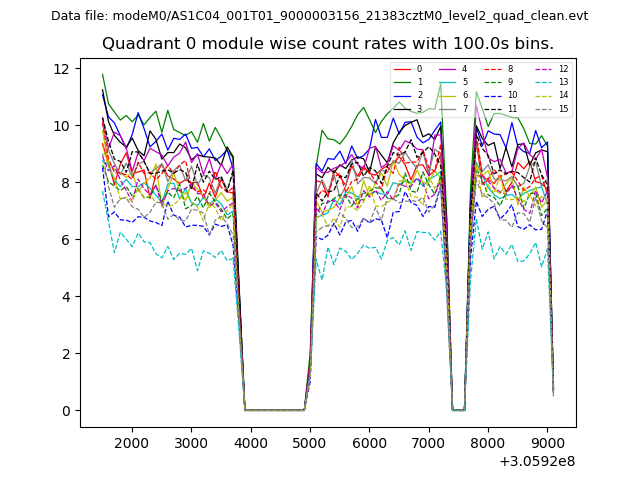 |
 |
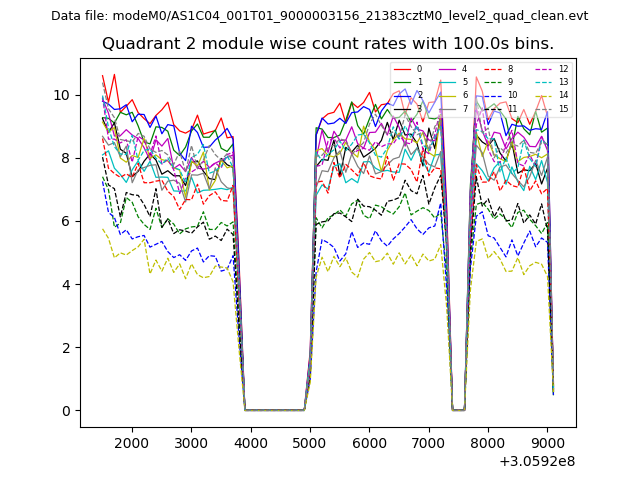
| Module-wise count rates for Quadrant B Data is divided into 100 sec bins |
 |
 |
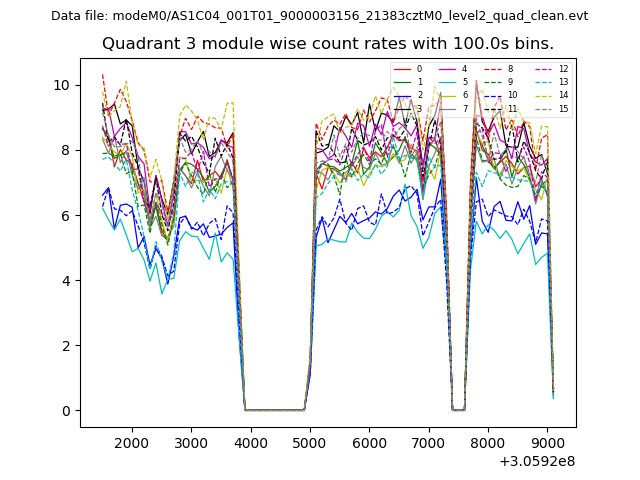
| Module-wise count rates for Quadrant C Data is divided into 100 sec bins |
 |
 |
| Module-wise count rates for Quadrant D Data is divided into 100 sec bins |
 |
 |
| Parameter | Plot |
|---|---|
| CZT HV Monitor | 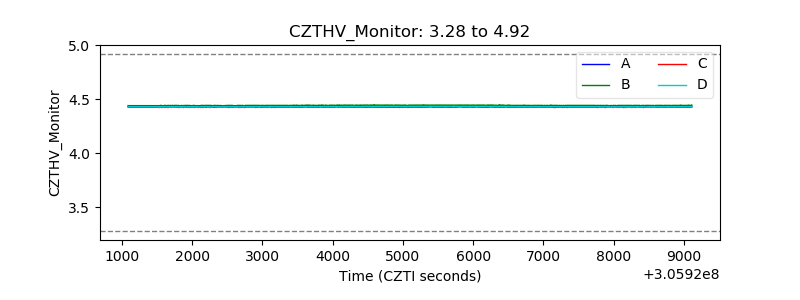 |
| D_VDD | 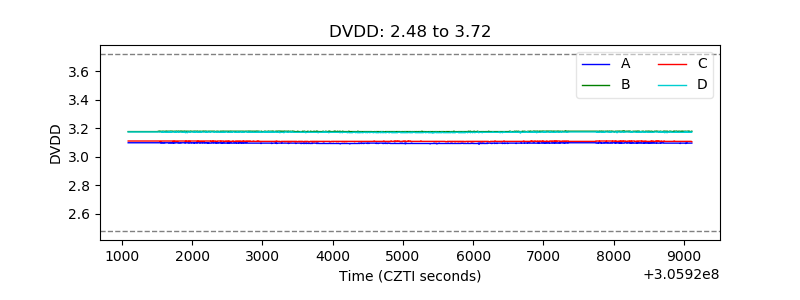 |
| Temperature 1 | 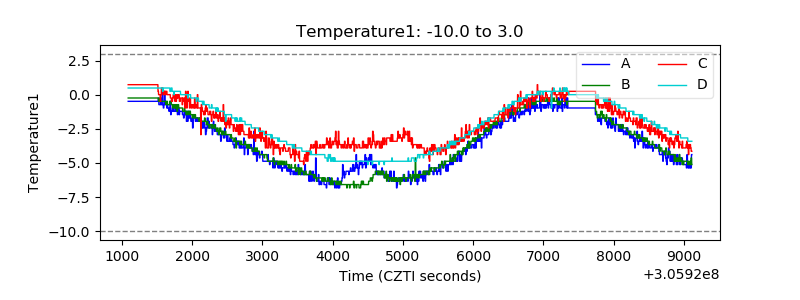 |
| Veto HV Monitor | 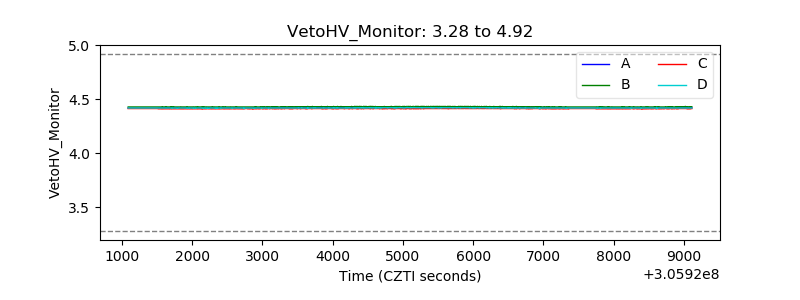 |
| Veto LLD | 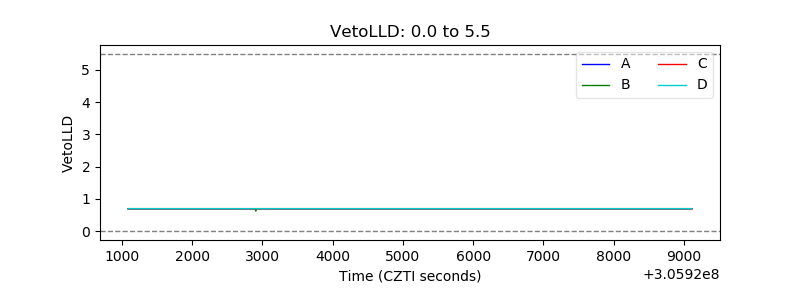 |
| Alpha Counter | 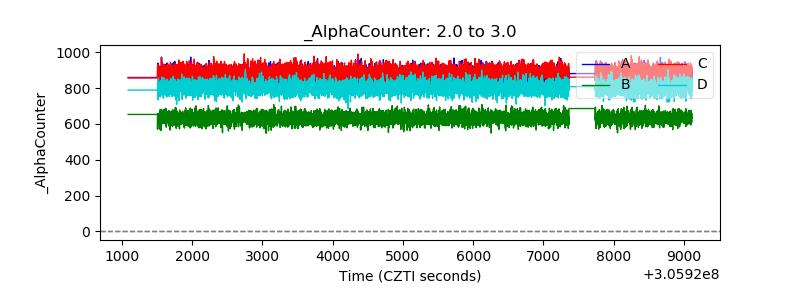 |
| _CPM_Rate | 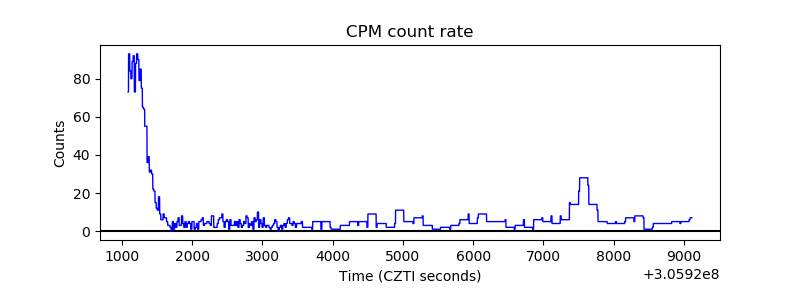 |
| CZT Counter | 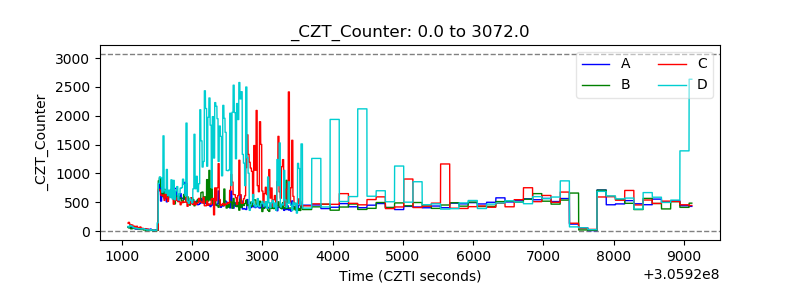 |
| +2.5 Volts monitor |  |
| +5 Volts monitor | 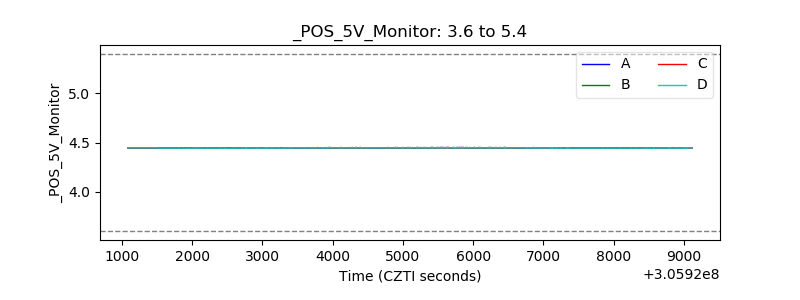 |
| _ROLL_ROT | 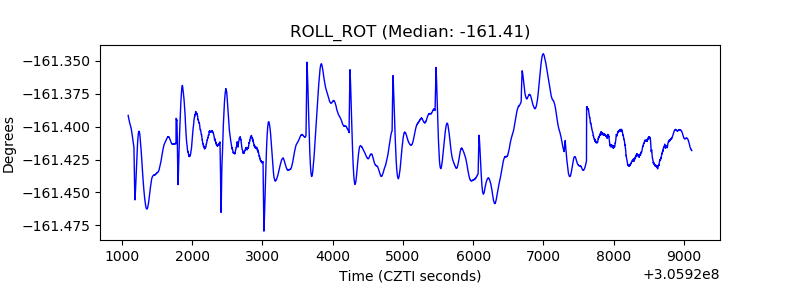 |
| _Roll_DEC | 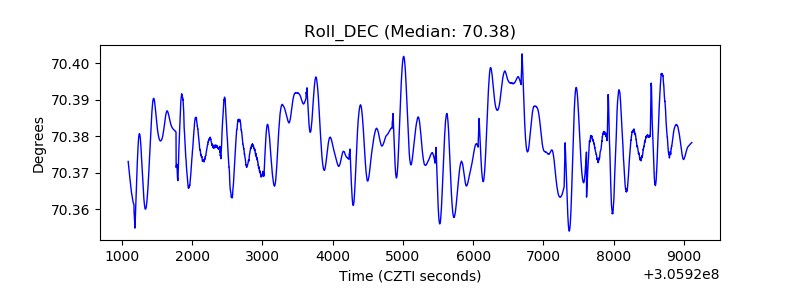 |
| _Roll_RA | 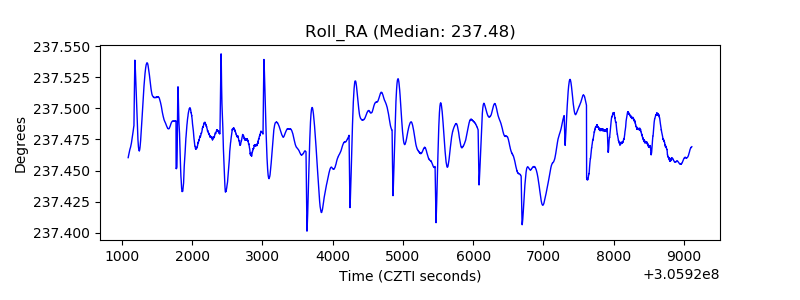 |
| Veto Counter | 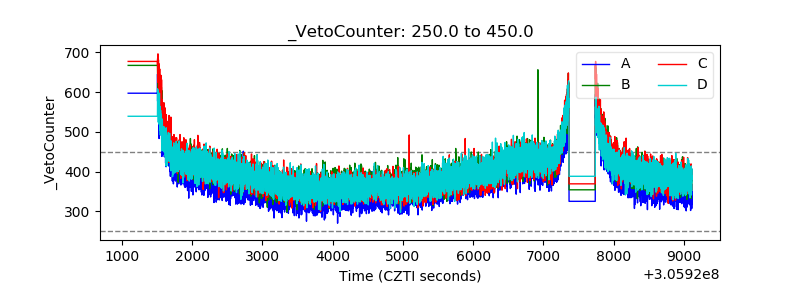 |