| Param | Original file | Final file |
|---|---|---|
| Filename | modeM0/AS1C04_001T01_9000003156_21384cztM0_level2.evt | modeM0/AS1C04_001T01_9000003156_21384cztM0_level2_quad_clean.evt |
| Size (bytes) | 511,223,040 | 117,256,320 |
| Size | 487.5 MB | 111.8 MB |
| Events in quadrant A | 3,517,128 | 777,883 |
| Events in quadrant B | 3,619,750 | 783,579 |
| Events in quadrant C | 3,389,165 | 747,472 |
| Events in quadrant D | 4,458,056 | 731,600 |
| Mode M0 | |||
|---|---|---|---|
| Quadrant | BADHDUFLAG | Total packets | Discarded packets |
| A | 0 | 15267 | 2 |
| B | 0 | 15790 | 2 |
| C | 0 | 14992 | 2 |
| D | 0 | 18265 | 2 |
| Mode M9 | |||
|---|---|---|---|
| Quadrant | BADHDUFLAG | Total packets | Discarded packets |
| A | 0 | 4 | 0 |
| B | 0 | 4 | 0 |
| C | 0 | 4 | 0 |
| D | 0 | 4 | 0 |
| Mode SS | |||
|---|---|---|---|
| Quadrant | BADHDUFLAG | Total packets | Discarded packets |
| A | 0 | 148 | 0 |
| B | 0 | 148 | 0 |
| C | 0 | 148 | 0 |
| D | 0 | 148 | 0 |
| Quadrant | Total seconds | Saturated seconds | Saturation percentage |
|---|---|---|---|
| A | 7341 | 19 | 0.258820% |
| B | 7342 | 51 | 0.694634% |
| C | 7341 | 73 | 0.994415% |
| D | 7341 | 220 | 2.996867% |
Noise dominated data is calculated using 1-second bins in cleaned event files. If a bin has >2000 counts, and if more than 50% of those come from <1% of pixels, then it is considered to be noise-dominated and hence unusable.
| Quadrant | # 1 sec bins | Bins with >0 counts | Bins with >2000 counts | High rate bins dominated by noise | Noise dominated (total time) | Noise dominated (detector-on time) | Marked lightcurve |
|---|---|---|---|---|---|---|---|
| A | 7716 | 7342 | 9 | 9 | 0.12% | 0.12% | 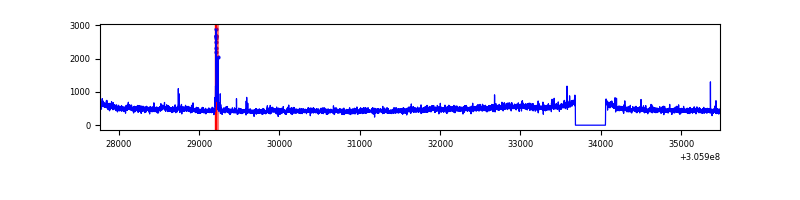 |
| B | 7717 | 7343 | 22 | 22 | 0.29% | 0.30% | 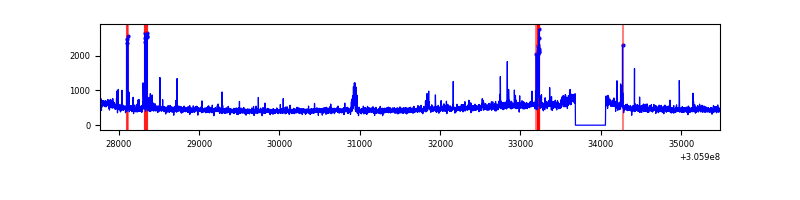 |
| C | 7716 | 7341 | 0 | 0 | 0.00% | 0.00% | 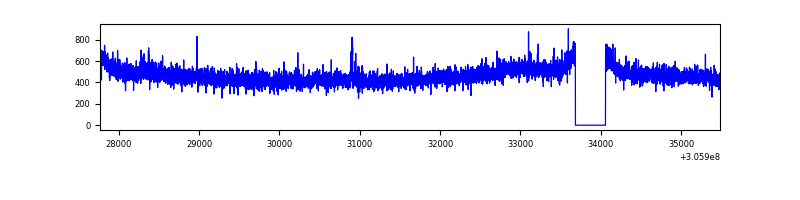 |
| D | 7716 | 7342 | 204 | 204 | 2.64% | 2.78% | 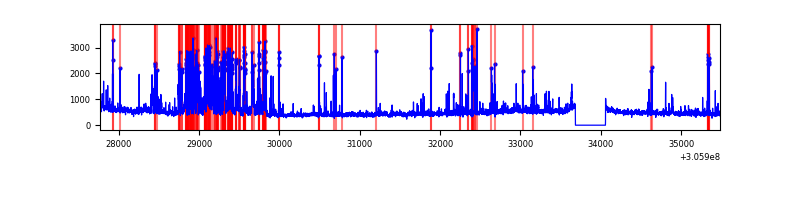 |
Top three noisy pixels from each quadrant. If the there are fewer than three noisy pixels in the level2.evt file, extra rows are filled as -1
| Pixel properties | Quadrant properties | ||||||
|---|---|---|---|---|---|---|---|
| Quadrant | DetID | PixID | Counts | Sigma | Mean | Median | Sigma |
| A | 5 | 168 | 129365 | 741.0 | 860 | 840 | 173.4 |
| A | 15 | 174 | 55216 | 313.5 | 860 | 840 | 173.4 |
| A | 13 | 254 | 12485 | 67.14 | 860 | 840 | 173.4 |
| B | 5 | 172 | 72832 | 440.62 | 861 | 838 | 163.4 |
| B | 0 | 230 | 45271 | 271.94 | 861 | 838 | 163.4 |
| B | 0 | 219 | 31355 | 186.77 | 861 | 838 | 163.4 |
| C | 14 | 238 | 129851 | 662.72 | 831 | 835 | 194.7 |
| C | 10 | 23 | 12409 | 59.45 | 831 | 835 | 194.7 |
| C | 13 | 61 | 5732 | 25.15 | 831 | 835 | 194.7 |
| D | 1 | 52 | 814237 | 4005.43 | 837 | 812 | 203.1 |
| D | 12 | 235 | 201176 | 986.62 | 837 | 812 | 203.1 |
| D | 1 | 20 | 72086 | 350.96 | 837 | 812 | 203.1 |
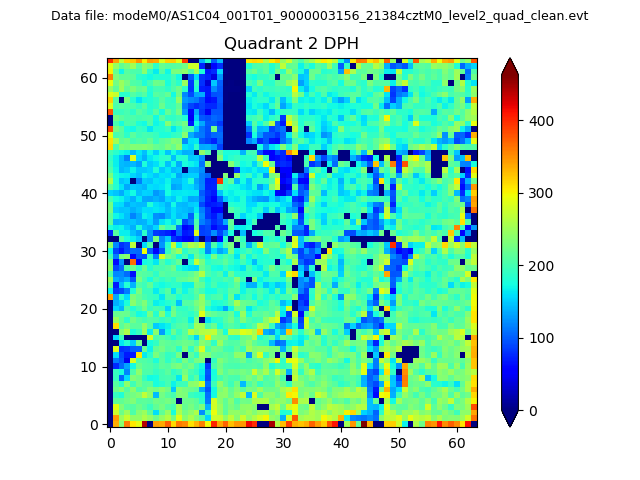
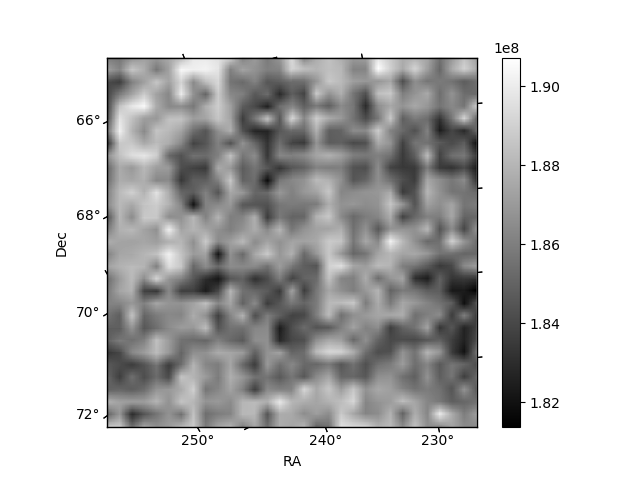
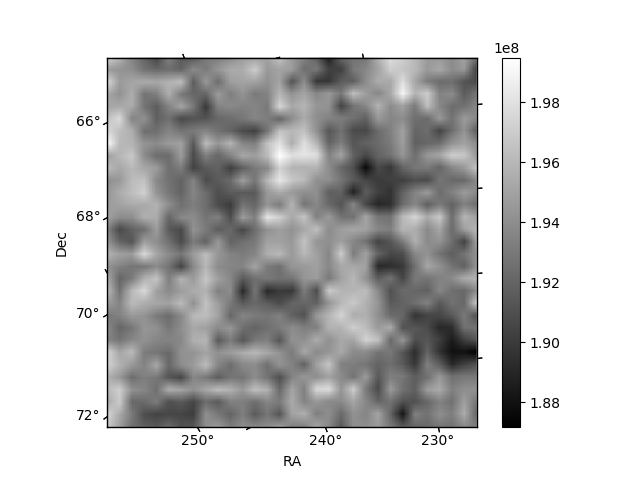
Histogram calculated using DETX and DETY for each event in the final _common_clean file
| Quadrant A | 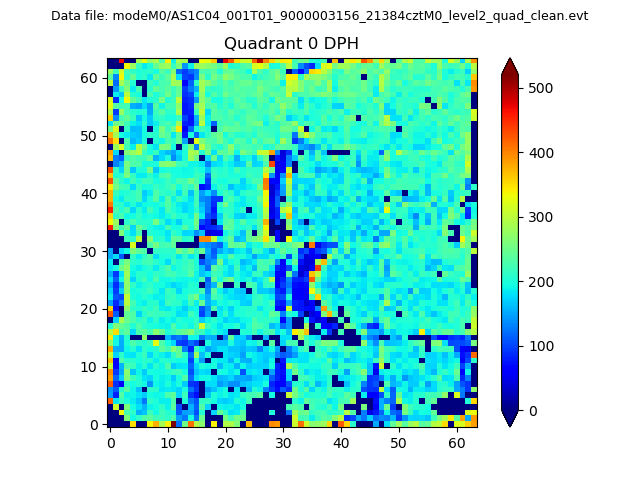 |
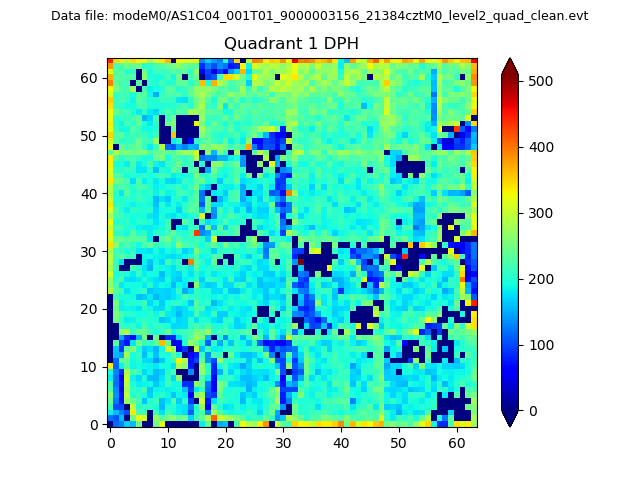 |
Quadrant B |
|---|---|---|---|
| Quadrant D | 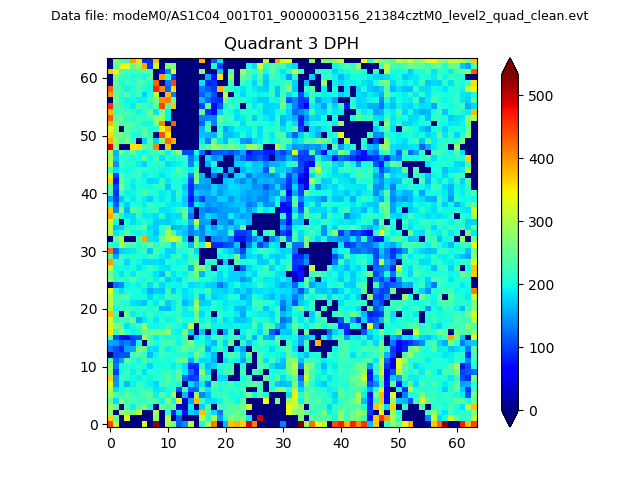 |
 |
Quadrant C |
| Plot type | Count rate plots | Images |
|---|---|---|
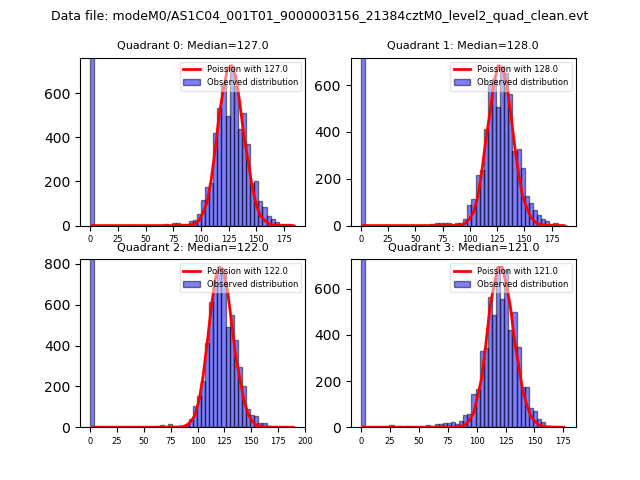
| Comparison with Poisson distribution Blue bars denote a histogram of data divided into 1 sec bins. Red curve is a Poisson curve with rate = median count rate of data. |
 |
 |
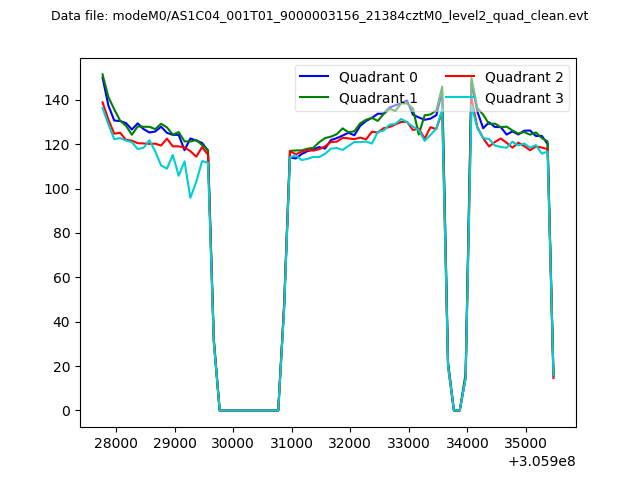
| Quadrant-wise count rates Data is divided into 100 sec bins |
 |
|
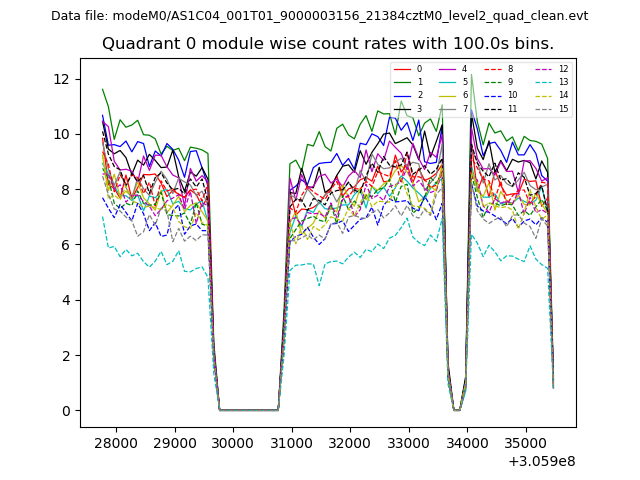
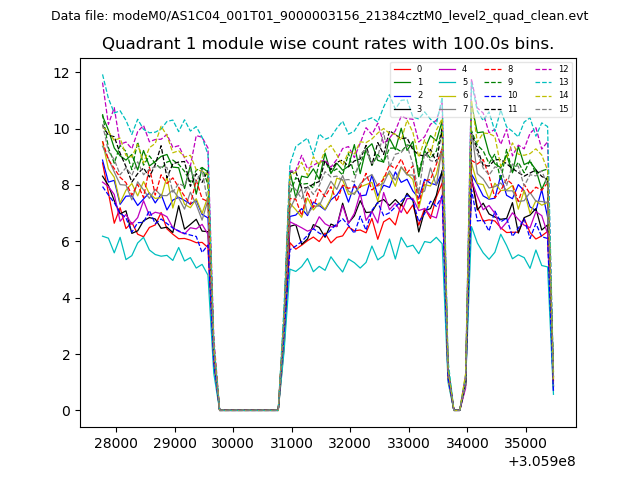
| Module-wise count rates for Quadrant A Data is divided into 100 sec bins |
 |
 |
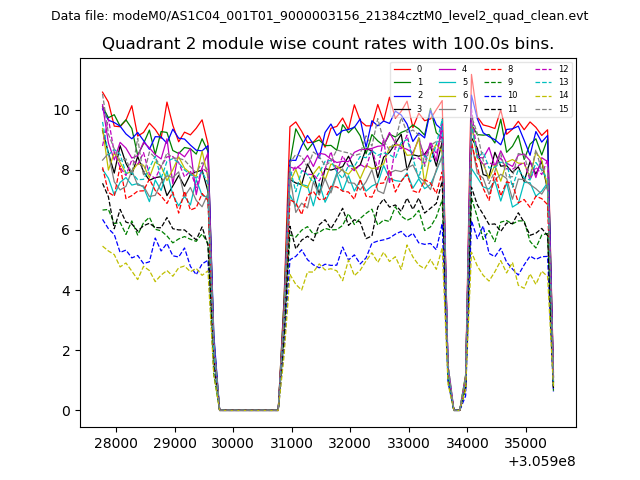
| Module-wise count rates for Quadrant B Data is divided into 100 sec bins |
 |
 |
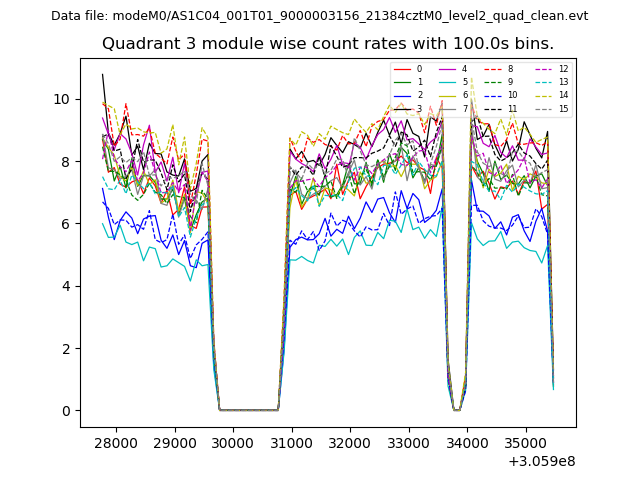
| Module-wise count rates for Quadrant C Data is divided into 100 sec bins |
 |
 |
| Module-wise count rates for Quadrant D Data is divided into 100 sec bins |
 |
 |
| Parameter | Plot |
|---|---|
| CZT HV Monitor | 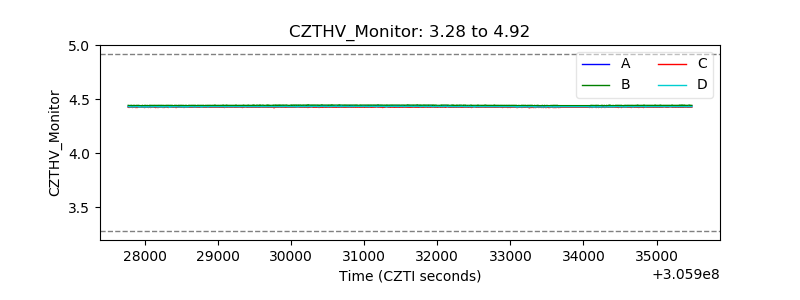 |
| D_VDD | 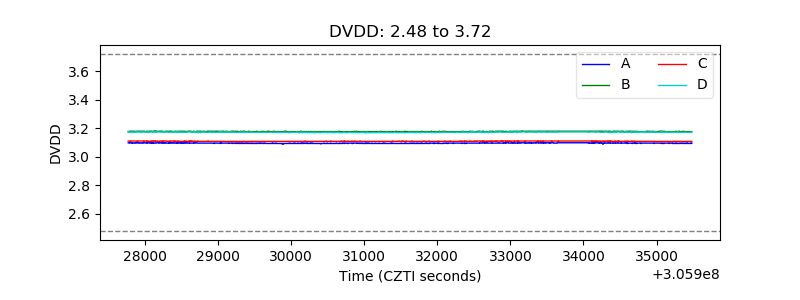 |
| Temperature 1 | 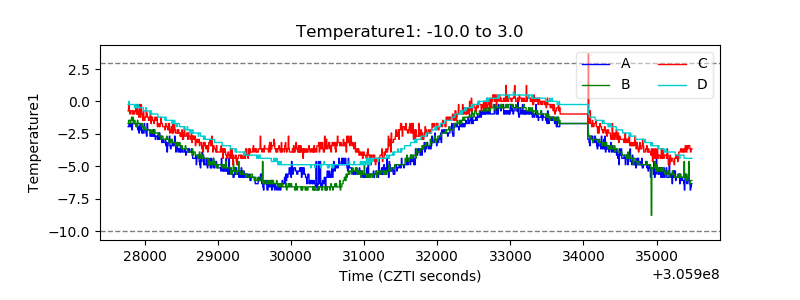 |
| Veto HV Monitor | 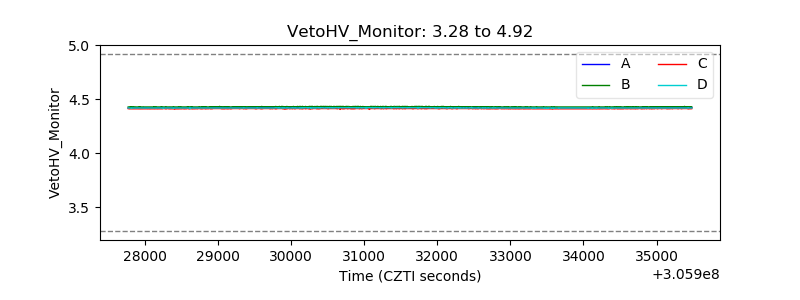 |
| Veto LLD | 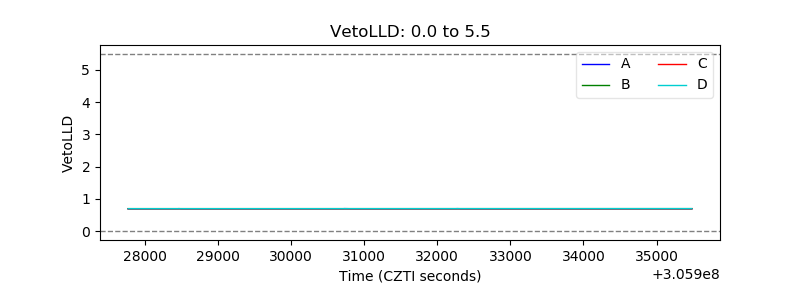 |
| Alpha Counter | 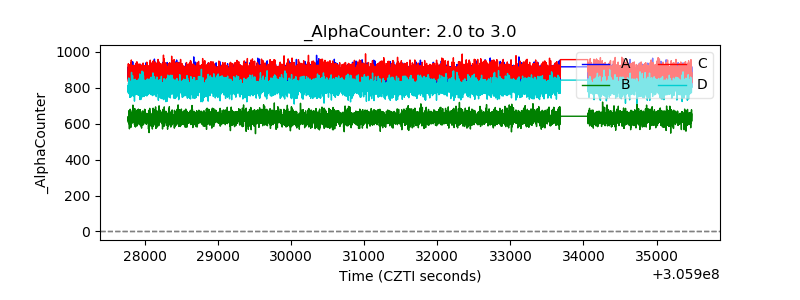 |
| _CPM_Rate | 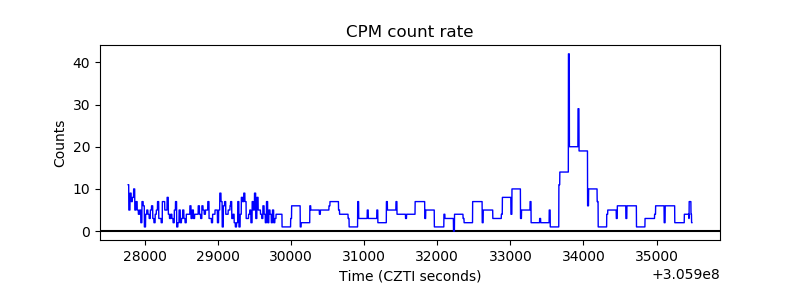 |
| CZT Counter | 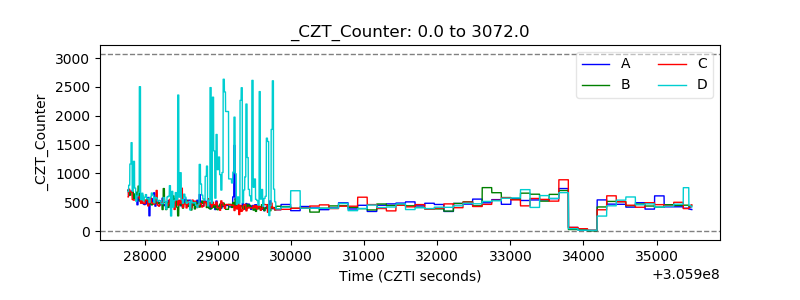 |
| +2.5 Volts monitor |  |
| +5 Volts monitor | 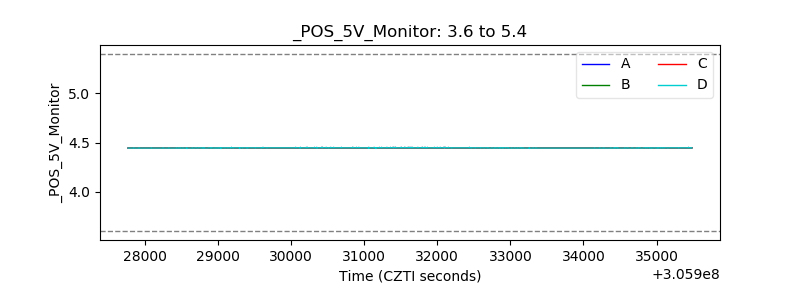 |
| _ROLL_ROT | 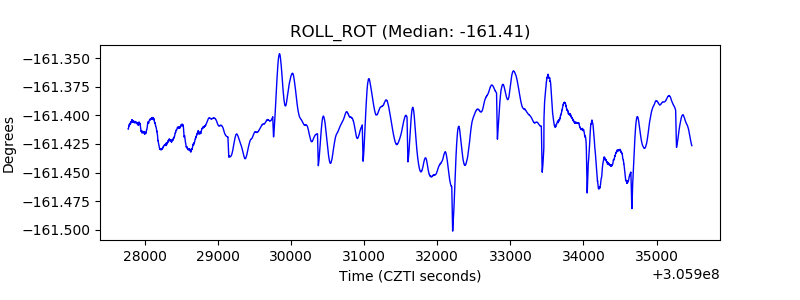 |
| _Roll_DEC | 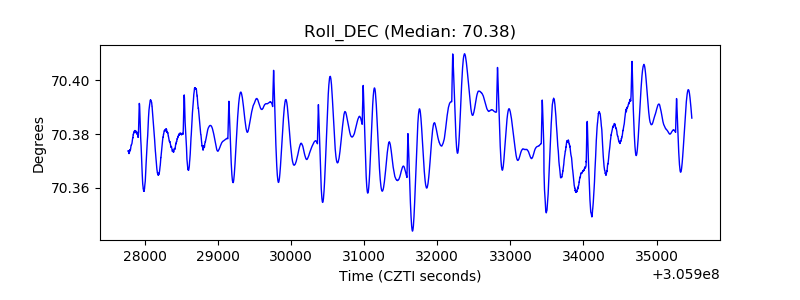 |
| _Roll_RA | 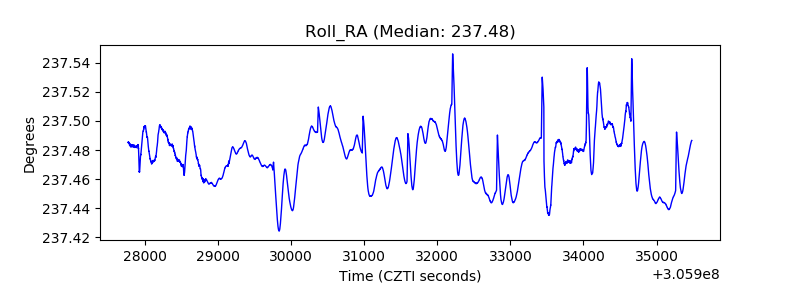 |
| Veto Counter | 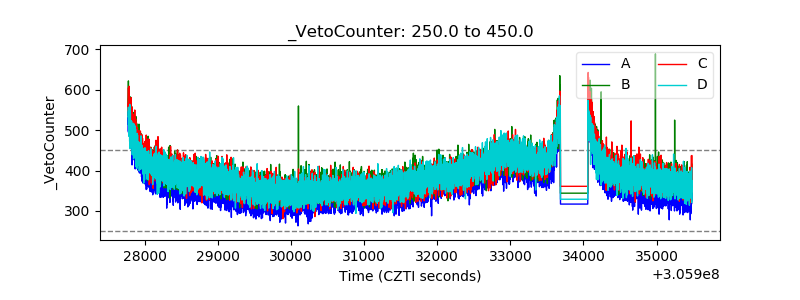 |