| Param | Original file | Final file |
|---|---|---|
| Filename | modeM0/AS1C04_001T01_9000003156_21390cztM0_level2.evt | modeM0/AS1C04_001T01_9000003156_21390cztM0_level2_quad_clean.evt |
| Size (bytes) | 449,481,600 | 99,642,240 |
| Size | 428.7 MB | 95.0 MB |
| Events in quadrant A | 2,981,644 | 667,284 |
| Events in quadrant B | 2,927,219 | 672,885 |
| Events in quadrant C | 4,210,076 | 626,853 |
| Events in quadrant D | 3,085,849 | 631,351 |
| Mode M0 | |||
|---|---|---|---|
| Quadrant | BADHDUFLAG | Total packets | Discarded packets |
| A | 0 | 12517 | 1 |
| B | 0 | 12525 | 2 |
| C | 0 | 16636 | 1 |
| D | 0 | 13085 | 1 |
| Mode M9 | |||
|---|---|---|---|
| Quadrant | BADHDUFLAG | Total packets | Discarded packets |
| A | 0 | 11 | 0 |
| B | 0 | 11 | 0 |
| C | 0 | 11 | 0 |
| D | 0 | 11 | 0 |
| Mode SS | |||
|---|---|---|---|
| Quadrant | BADHDUFLAG | Total packets | Discarded packets |
| A | 0 | 122 | 0 |
| B | 0 | 122 | 0 |
| C | 0 | 122 | 0 |
| D | 0 | 122 | 0 |
| Quadrant | Total seconds | Saturated seconds | Saturation percentage |
|---|---|---|---|
| A | 6004 | 20 | 0.333111% |
| B | 6004 | 32 | 0.532978% |
| C | 6004 | 151 | 2.514990% |
| D | 6004 | 78 | 1.299134% |
Noise dominated data is calculated using 1-second bins in cleaned event files. If a bin has >2000 counts, and if more than 50% of those come from <1% of pixels, then it is considered to be noise-dominated and hence unusable.
| Quadrant | # 1 sec bins | Bins with >0 counts | Bins with >2000 counts | High rate bins dominated by noise | Noise dominated (total time) | Noise dominated (detector-on time) | Marked lightcurve |
|---|---|---|---|---|---|---|---|
| A | 7099 | 6004 | 1 | 1 | 0.01% | 0.02% | 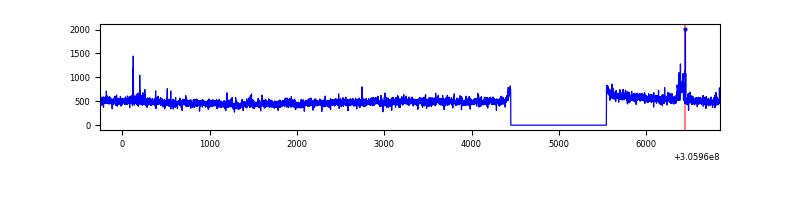 |
| B | 7099 | 6004 | 5 | 5 | 0.07% | 0.08% | 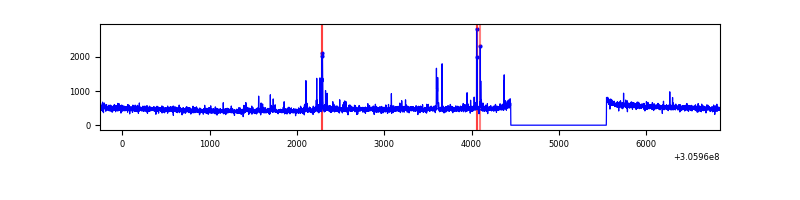 |
| C | 7099 | 6005 | 13 | 13 | 0.18% | 0.22% | 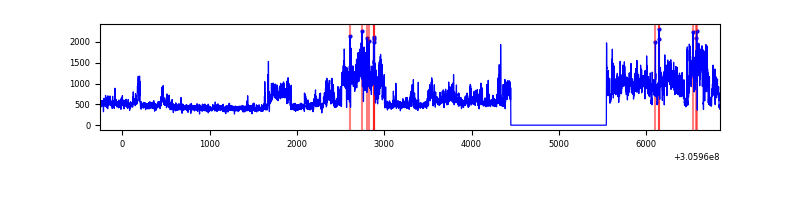 |
| D | 7099 | 6004 | 26 | 26 | 0.37% | 0.43% | 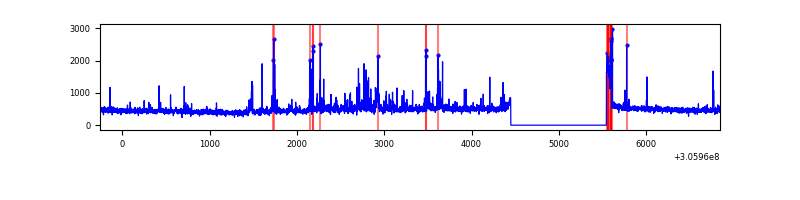 |
Top three noisy pixels from each quadrant. If the there are fewer than three noisy pixels in the level2.evt file, extra rows are filled as -1
| Pixel properties | Quadrant properties | ||||||
|---|---|---|---|---|---|---|---|
| Quadrant | DetID | PixID | Counts | Sigma | Mean | Median | Sigma |
| A | 5 | 168 | 124748 | 849.79 | 726 | 712 | 146.0 |
| A | 15 | 174 | 36926 | 248.11 | 726 | 712 | 146.0 |
| A | 12 | 96 | 10689 | 68.35 | 726 | 712 | 146.0 |
| B | 3 | 64 | 32928 | 237.93 | 721 | 703 | 135.4 |
| B | 0 | 190 | 19742 | 140.57 | 721 | 703 | 135.4 |
| B | 5 | 172 | 16345 | 115.49 | 721 | 703 | 135.4 |
| C | 3 | 233 | 1444047 | 9158.92 | 681 | 685 | 157.6 |
| C | 14 | 238 | 109764 | 692.16 | 681 | 685 | 157.6 |
| C | 13 | 61 | 4723 | 25.62 | 681 | 685 | 157.6 |
| D | 12 | 235 | 155669 | 920.7 | 692 | 672 | 168.3 |
| D | 13 | 174 | 131282 | 775.83 | 692 | 672 | 168.3 |
| D | 15 | 145 | 50254 | 294.52 | 692 | 672 | 168.3 |
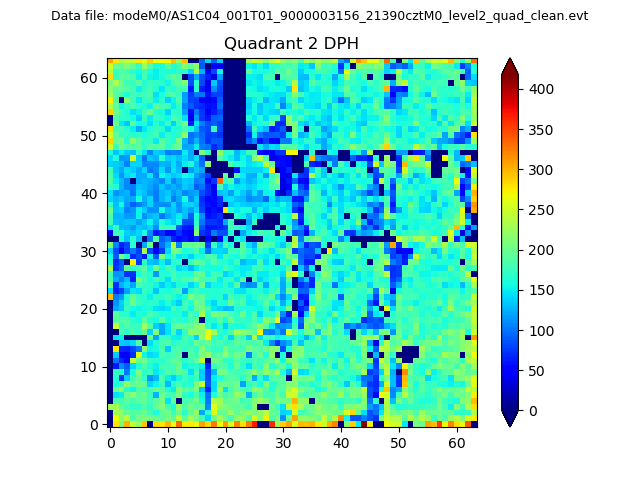
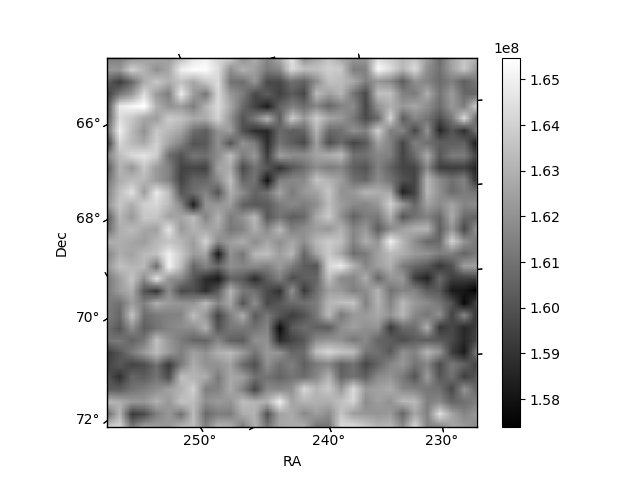
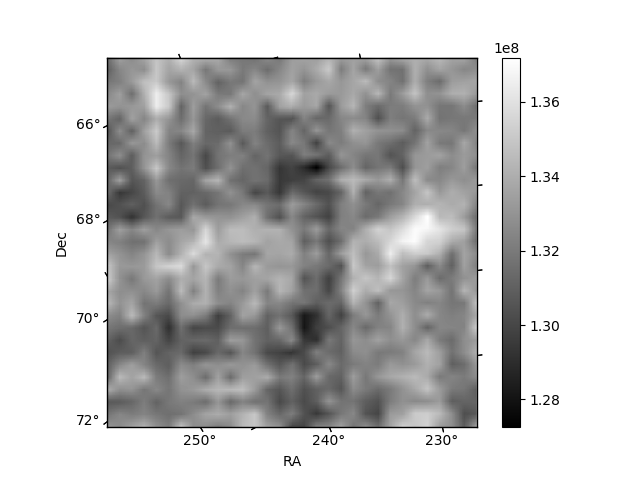
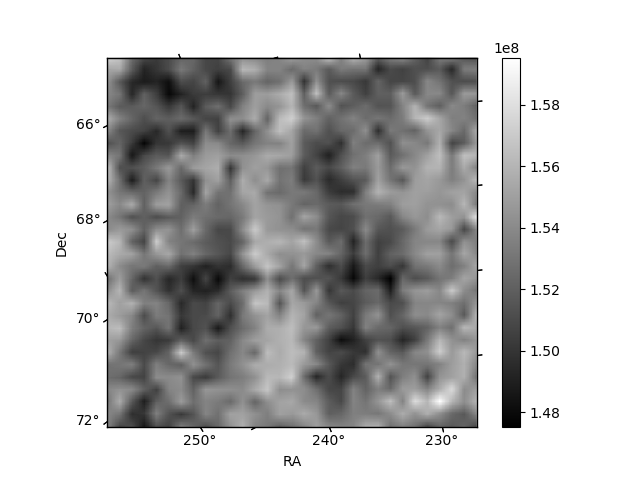
Histogram calculated using DETX and DETY for each event in the final _common_clean file
| Quadrant A | 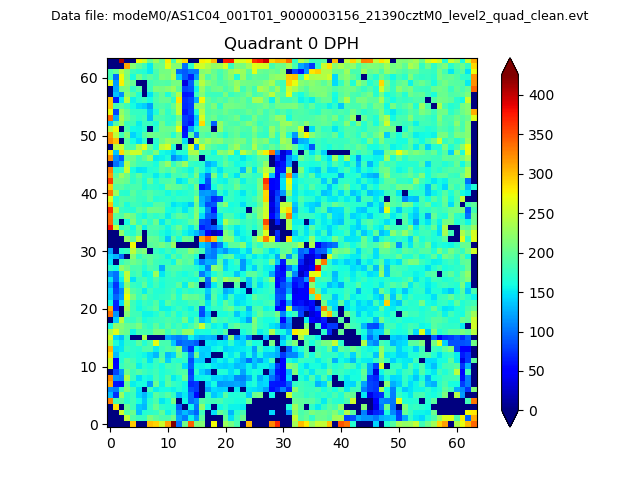 |
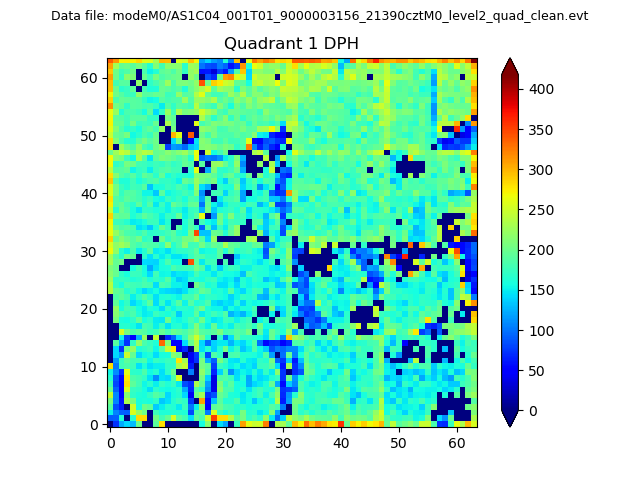 |
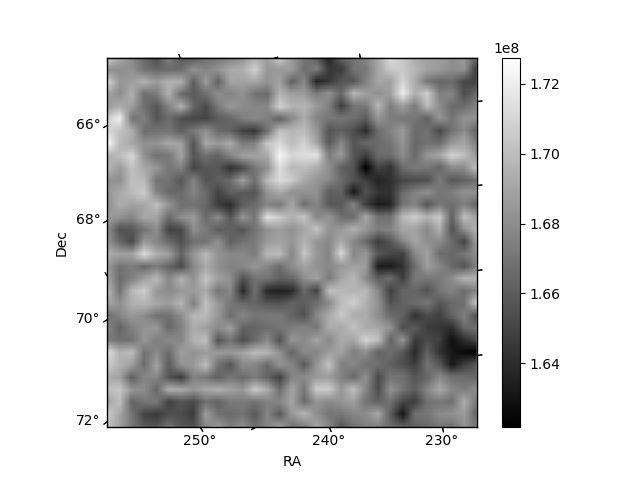
Quadrant B |
|---|---|---|---|
| Quadrant D | 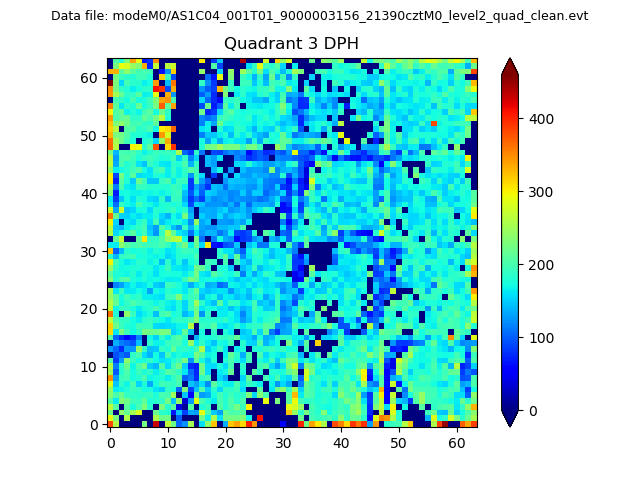 |
 |
Quadrant C |
| Plot type | Count rate plots | Images |
|---|---|---|
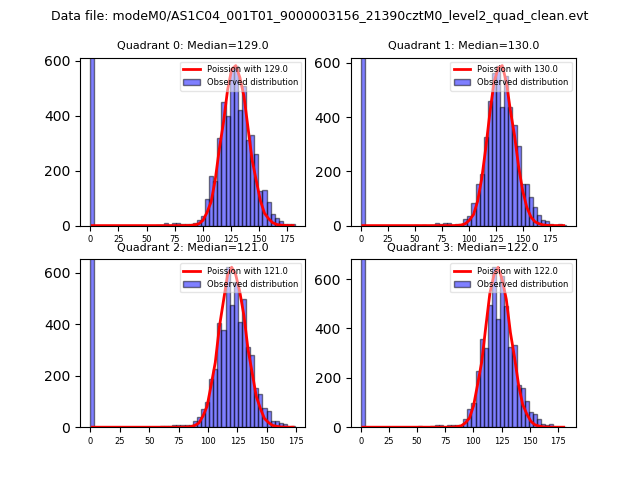
| Comparison with Poisson distribution Blue bars denote a histogram of data divided into 1 sec bins. Red curve is a Poisson curve with rate = median count rate of data. |
 |
 |
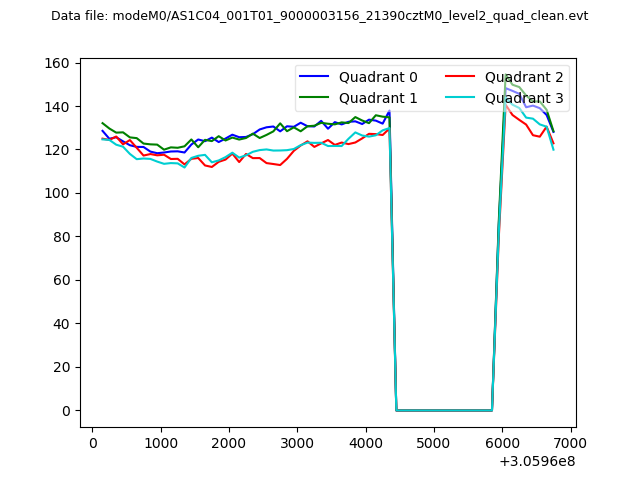
| Quadrant-wise count rates Data is divided into 100 sec bins |
 |
|
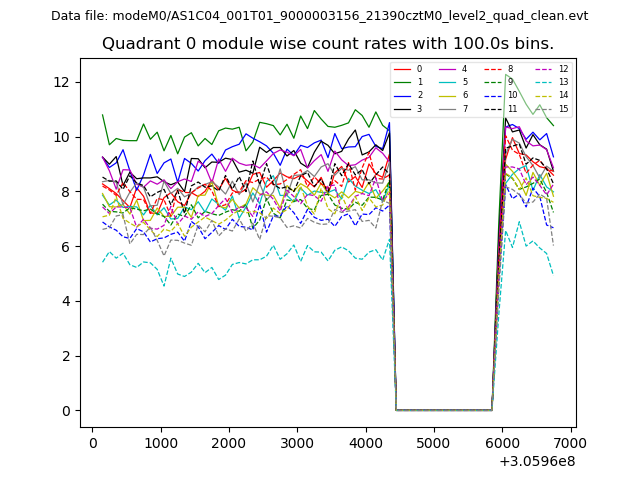
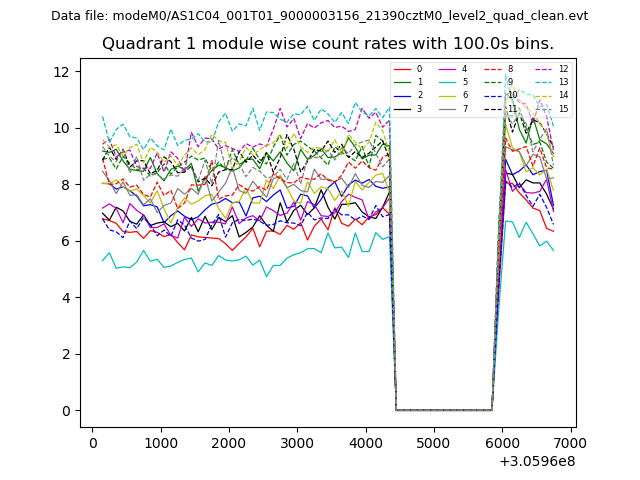
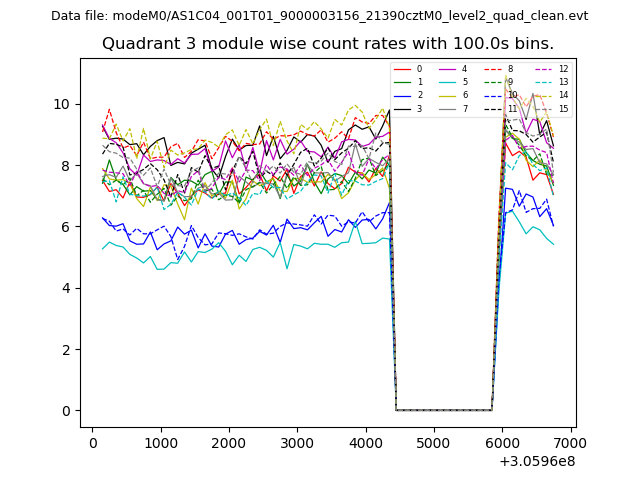
| Module-wise count rates for Quadrant A Data is divided into 100 sec bins |
 |
 |
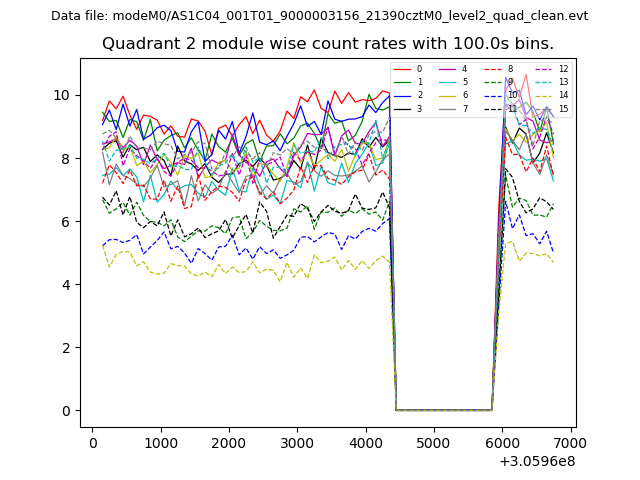
| Module-wise count rates for Quadrant B Data is divided into 100 sec bins |
 |
 |
| Module-wise count rates for Quadrant C Data is divided into 100 sec bins |
 |
 |
| Module-wise count rates for Quadrant D Data is divided into 100 sec bins |
 |
 |
| Parameter | Plot |
|---|---|
| CZT HV Monitor | 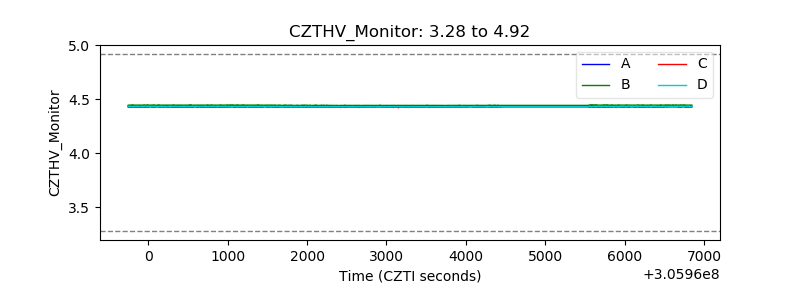 |
| D_VDD | 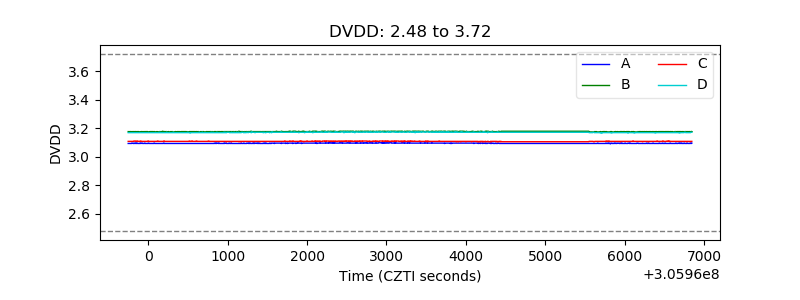 |
| Temperature 1 | 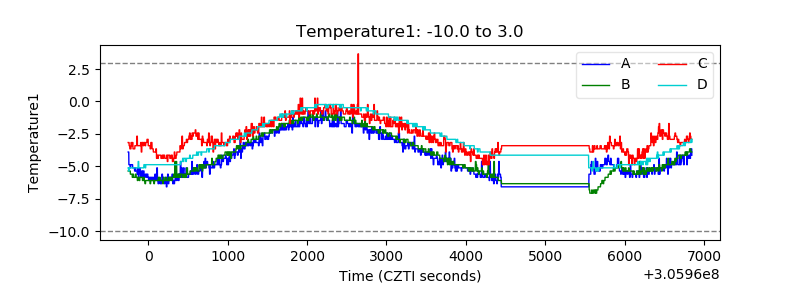 |
| Veto HV Monitor | 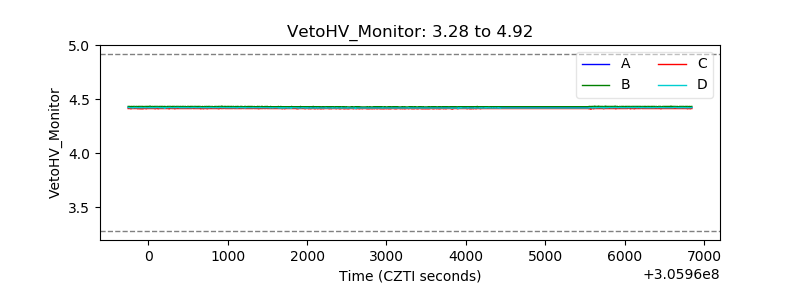 |
| Veto LLD | 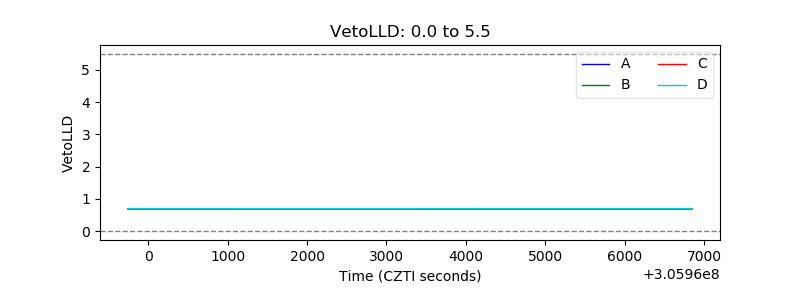 |
| Alpha Counter |  |
| _CPM_Rate | 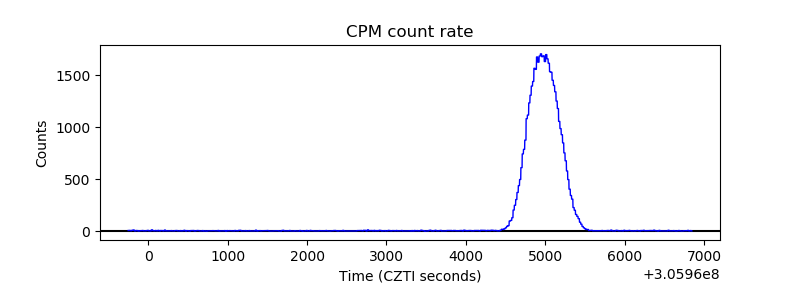 |
| CZT Counter | 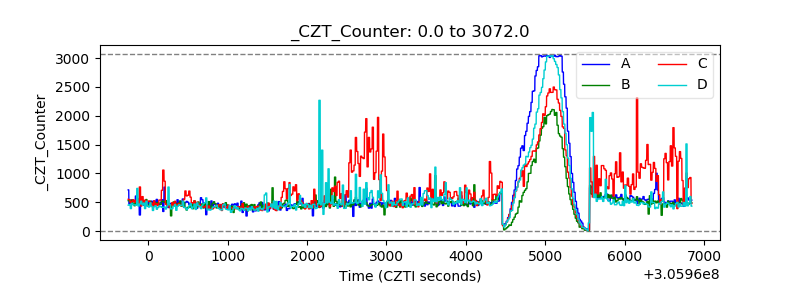 |
| +2.5 Volts monitor |  |
| +5 Volts monitor |  |
| _ROLL_ROT | 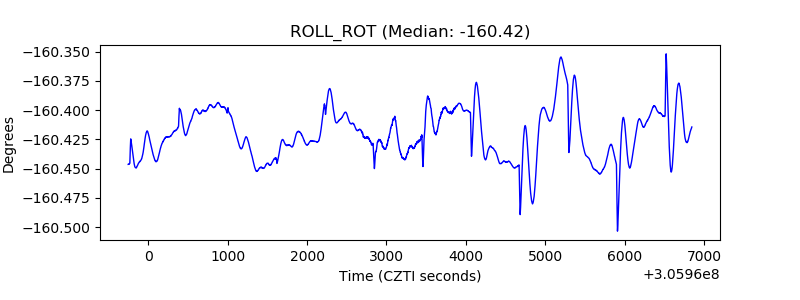 |
| _Roll_DEC | 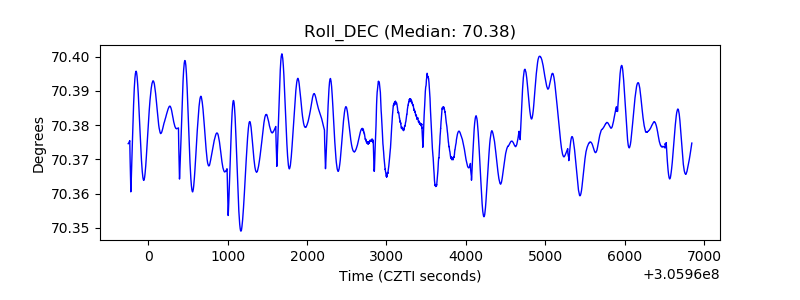 |
| _Roll_RA | 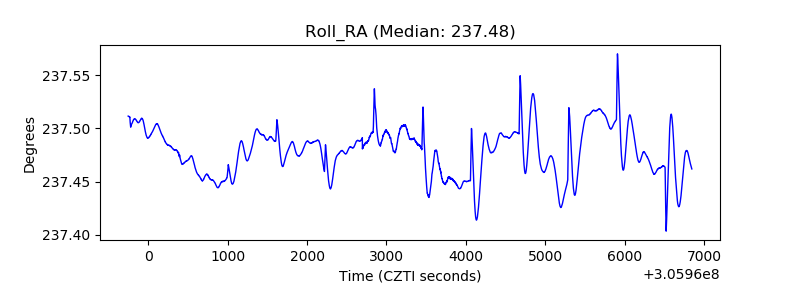 |
| Veto Counter | 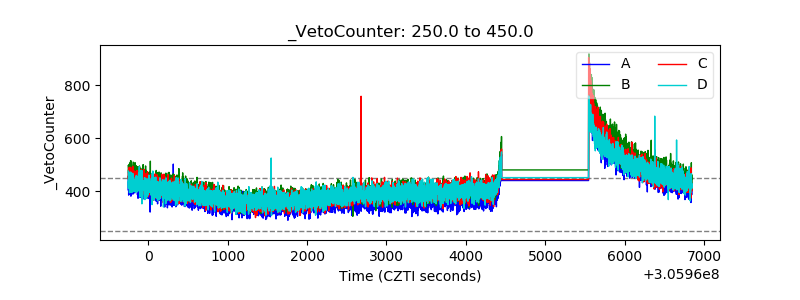 |