| Param | Original file | Final file |
|---|---|---|
| Filename | modeM0/AS1C04_001T01_9000003156_21391cztM0_level2.evt | modeM0/AS1C04_001T01_9000003156_21391cztM0_level2_quad_clean.evt |
| Size (bytes) | 2,323,814,400 | 448,361,280 |
| Size | 2.2 GB | 427.6 MB |
| Events in quadrant A | 15,523,088 | 2,945,686 |
| Events in quadrant B | 14,713,498 | 2,991,043 |
| Events in quadrant C | 22,429,868 | 2,751,110 |
| Events in quadrant D | 15,677,973 | 2,820,946 |
| Mode M0 | |||
|---|---|---|---|
| Quadrant | BADHDUFLAG | Total packets | Discarded packets |
| A | 0 | 65835 | 5 |
| B | 0 | 63846 | 5 |
| C | 0 | 87397 | 9 |
| D | 0 | 67786 | 5 |
| Mode M9 | |||
|---|---|---|---|
| Quadrant | BADHDUFLAG | Total packets | Discarded packets |
| A | 0 | 24 | 0 |
| B | 0 | 24 | 0 |
| C | 0 | 24 | 0 |
| D | 0 | 24 | 0 |
| Mode SS | |||
|---|---|---|---|
| Quadrant | BADHDUFLAG | Total packets | Discarded packets |
| A | 0 | 610 | 0 |
| B | 0 | 610 | 0 |
| C | 0 | 610 | 0 |
| D | 0 | 610 | 0 |
| Quadrant | Total seconds | Saturated seconds | Saturation percentage |
|---|---|---|---|
| A | 30138 | 396 | 1.313956% |
| B | 30139 | 257 | 0.852716% |
| C | 30138 | 2209 | 7.329617% |
| D | 30138 | 398 | 1.320592% |
Noise dominated data is calculated using 1-second bins in cleaned event files. If a bin has >2000 counts, and if more than 50% of those come from <1% of pixels, then it is considered to be noise-dominated and hence unusable.
| Quadrant | # 1 sec bins | Bins with >0 counts | Bins with >2000 counts | High rate bins dominated by noise | Noise dominated (total time) | Noise dominated (detector-on time) | Marked lightcurve |
|---|---|---|---|---|---|---|---|
| A | 40737 | 30142 | 313 | 313 | 0.77% | 1.04% | 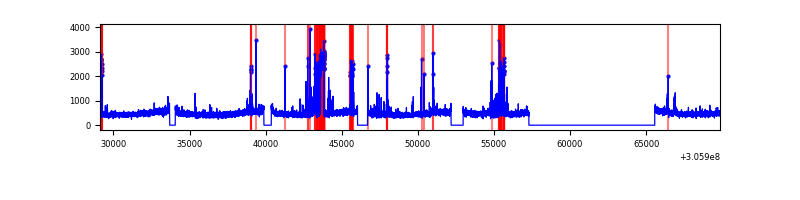 |
| B | 40738 | 30143 | 120 | 120 | 0.29% | 0.40% | 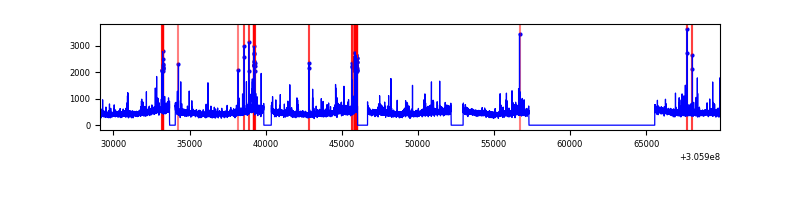 |
| C | 40738 | 30139 | 1128 | 1128 | 2.77% | 3.74% |  |
| D | 40738 | 30143 | 328 | 328 | 0.81% | 1.09% | 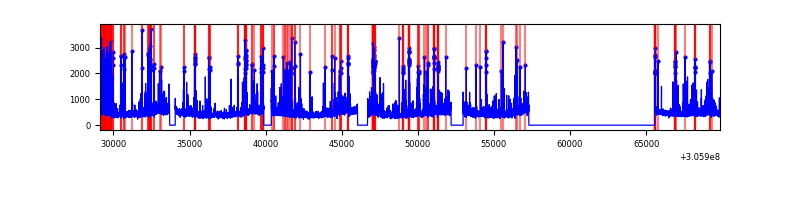 |
Top three noisy pixels from each quadrant. If the there are fewer than three noisy pixels in the level2.evt file, extra rows are filled as -1
| Pixel properties | Quadrant properties | ||||||
|---|---|---|---|---|---|---|---|
| Quadrant | DetID | PixID | Counts | Sigma | Mean | Median | Sigma |
| A | 5 | 16 | 1125885 | 1620.26 | 3503 | 3429 | 692.8 |
| A | 5 | 168 | 442506 | 633.81 | 3503 | 3429 | 692.8 |
| A | 12 | 96 | 254251 | 362.06 | 3503 | 3429 | 692.8 |
| B | 5 | 172 | 297174 | 448.82 | 3500 | 3410 | 654.5 |
| B | 0 | 230 | 163092 | 243.97 | 3500 | 3410 | 654.5 |
| B | 3 | 64 | 117052 | 173.63 | 3500 | 3410 | 654.5 |
| C | 3 | 233 | 8957127 | 11758.8 | 3290 | 3306 | 761.5 |
| C | 14 | 238 | 517707 | 675.55 | 3290 | 3306 | 761.5 |
| C | 10 | 91 | 81589 | 102.81 | 3290 | 3306 | 761.5 |
| D | 1 | 52 | 648829 | 785.69 | 3410 | 3312 | 821.6 |
| D | 12 | 235 | 638748 | 773.42 | 3410 | 3312 | 821.6 |
| D | 13 | 153 | 385545 | 465.23 | 3410 | 3312 | 821.6 |
Histogram calculated using DETX and DETY for each event in the final _common_clean file
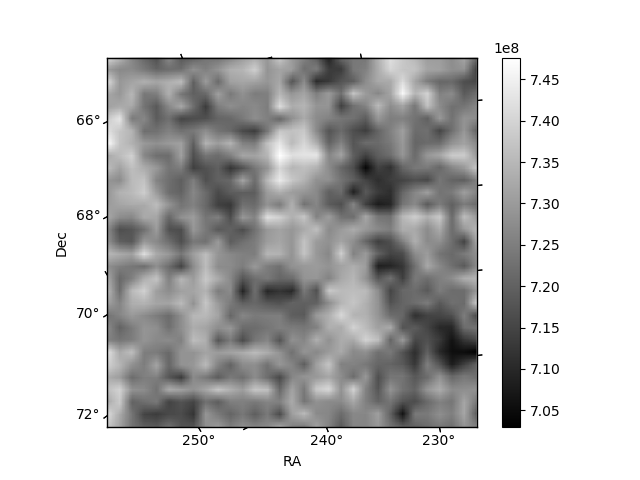
| Quadrant A |  |
 |
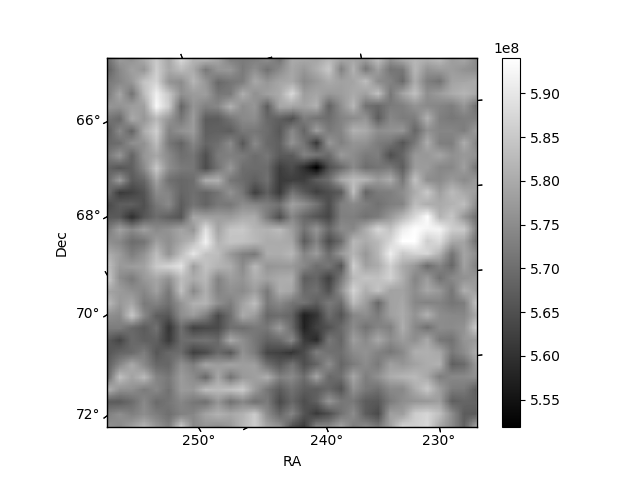
Quadrant B |
|---|---|---|---|
| Quadrant D | 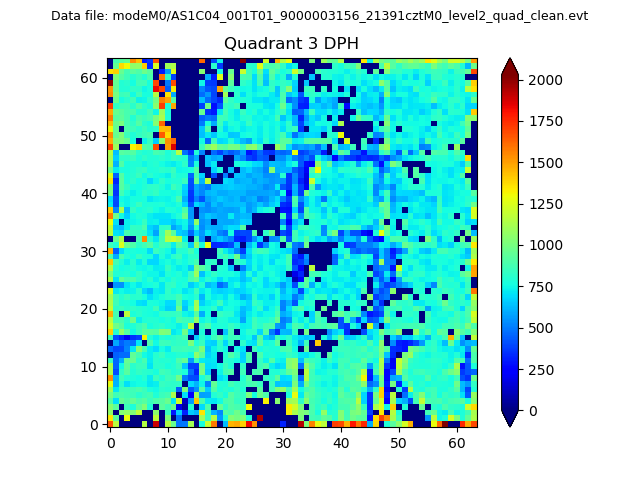 |
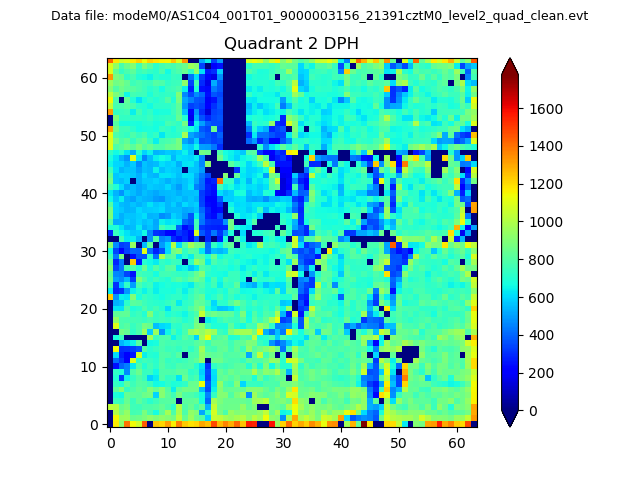 |
Quadrant C |
| Plot type | Count rate plots | Images |
|---|---|---|
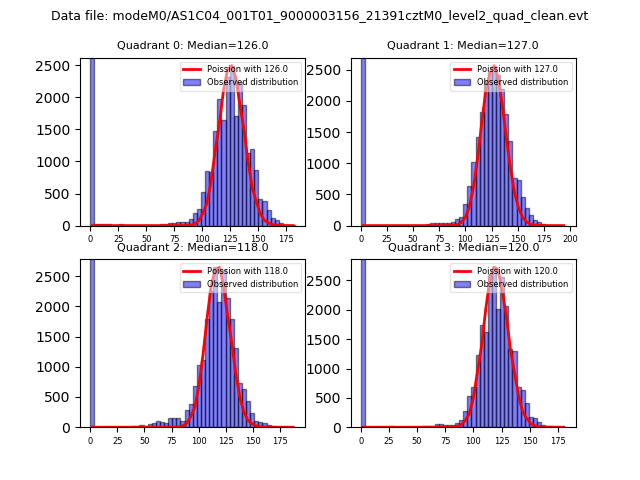
| Comparison with Poisson distribution Blue bars denote a histogram of data divided into 1 sec bins. Red curve is a Poisson curve with rate = median count rate of data. |
 |
 |
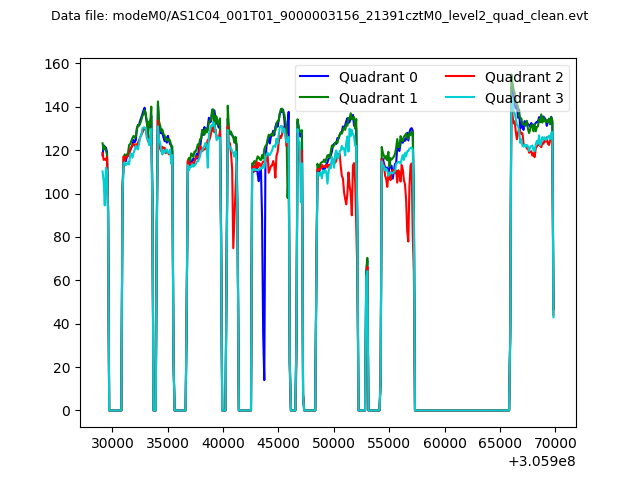
| Quadrant-wise count rates Data is divided into 100 sec bins |
 |
|
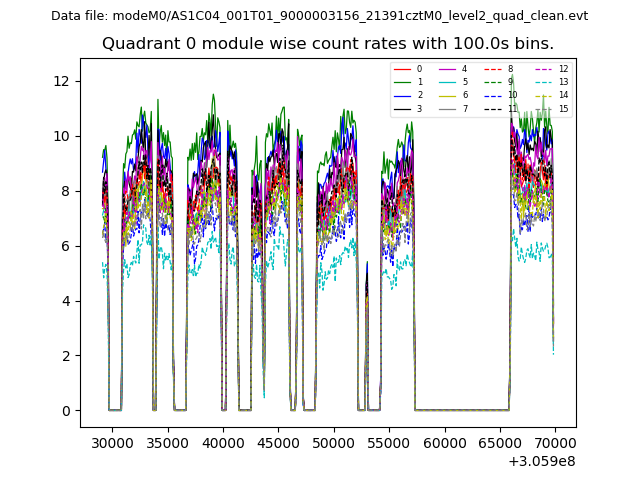
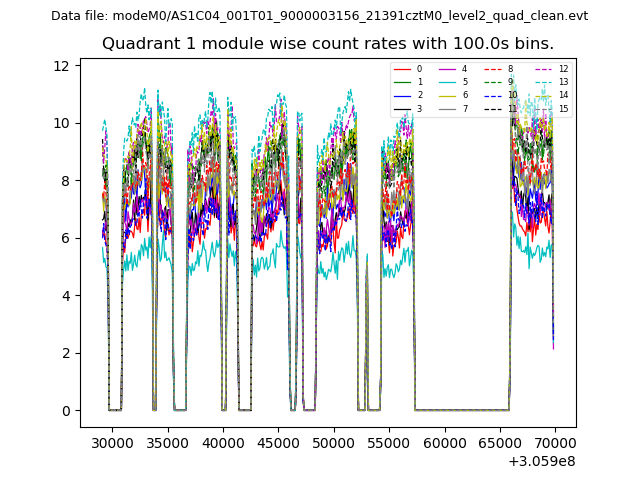
| Module-wise count rates for Quadrant A Data is divided into 100 sec bins |
 |
 |
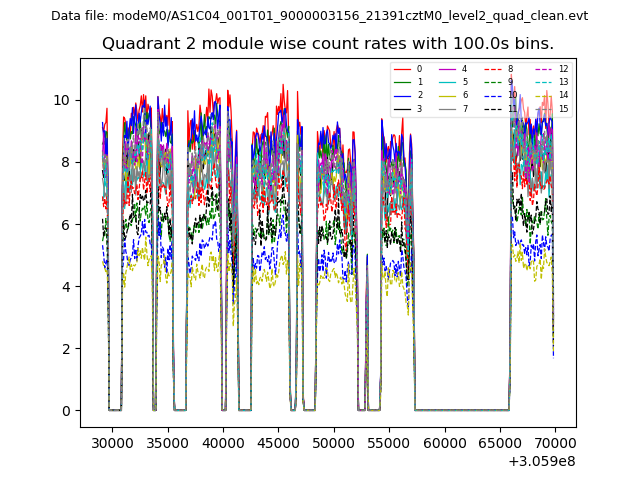
| Module-wise count rates for Quadrant B Data is divided into 100 sec bins |
 |
 |
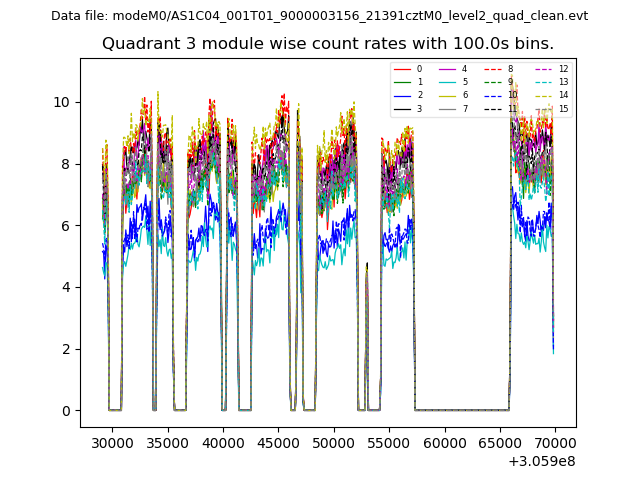
| Module-wise count rates for Quadrant C Data is divided into 100 sec bins |
 |
 |
| Module-wise count rates for Quadrant D Data is divided into 100 sec bins |
 |
 |
| Parameter | Plot |
|---|---|
| CZT HV Monitor | 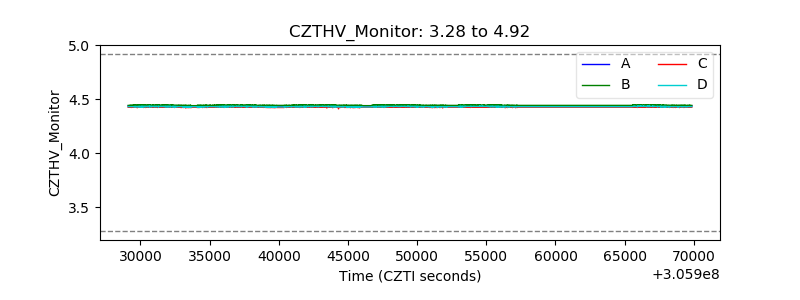 |
| D_VDD | 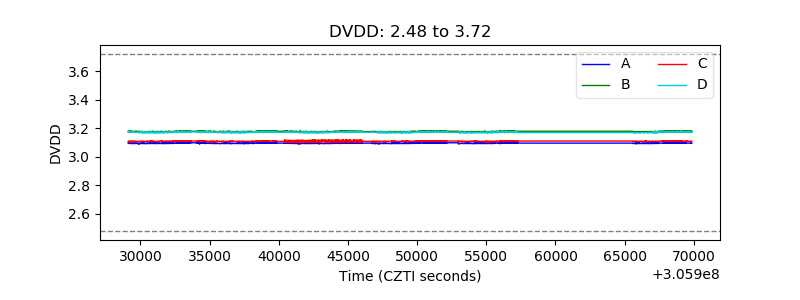 |
| Temperature 1 | 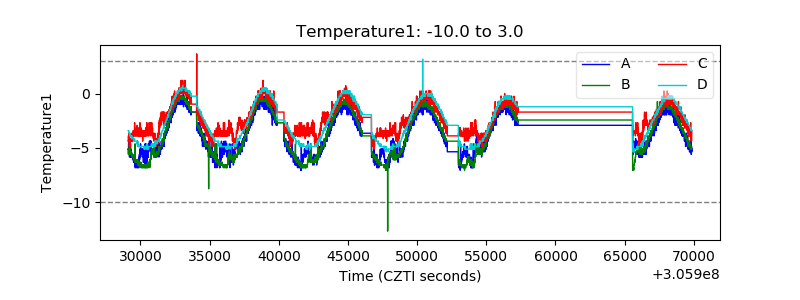 |
| Veto HV Monitor | 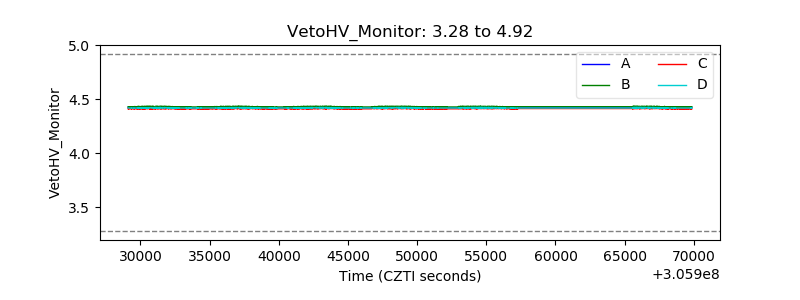 |
| Veto LLD | 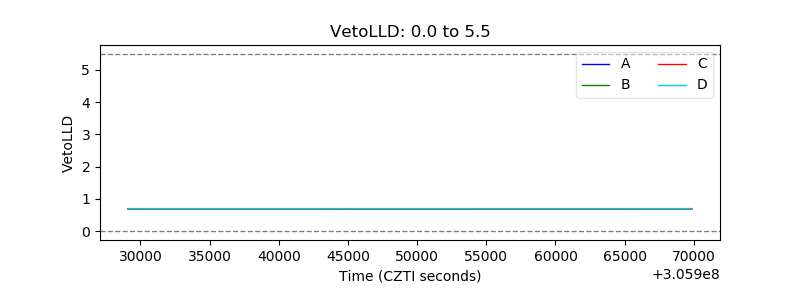 |
| Alpha Counter | 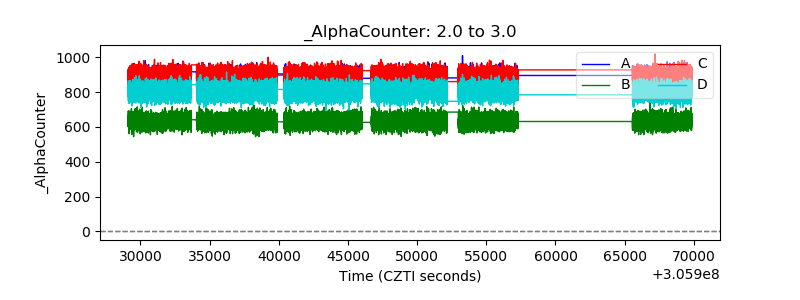 |
| _CPM_Rate | 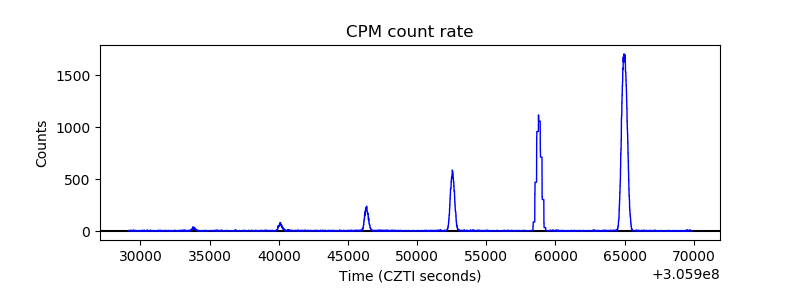 |
| CZT Counter | 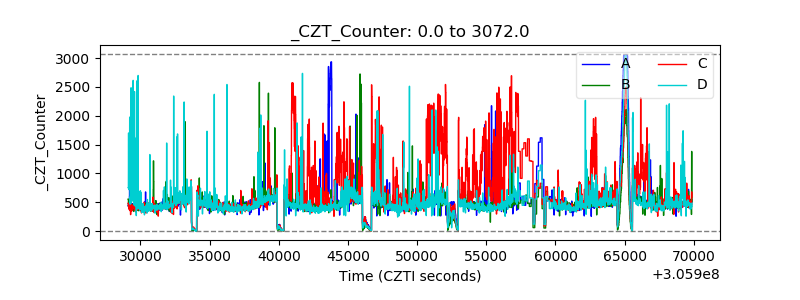 |
| +2.5 Volts monitor |  |
| +5 Volts monitor |  |
| _ROLL_ROT | 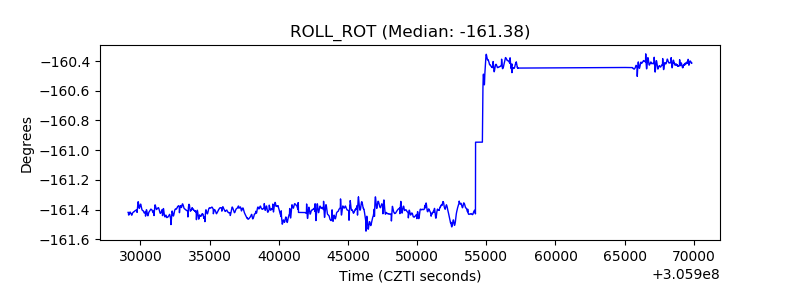 |
| _Roll_DEC | 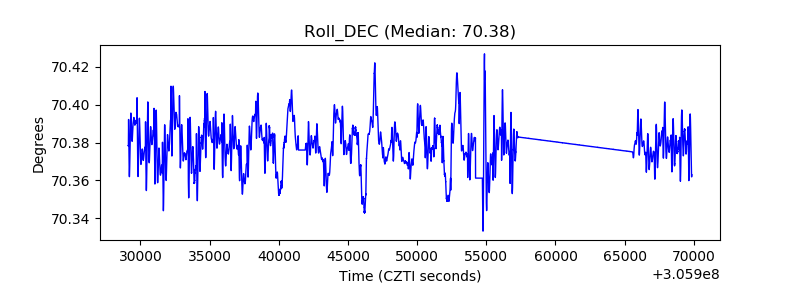 |
| _Roll_RA | 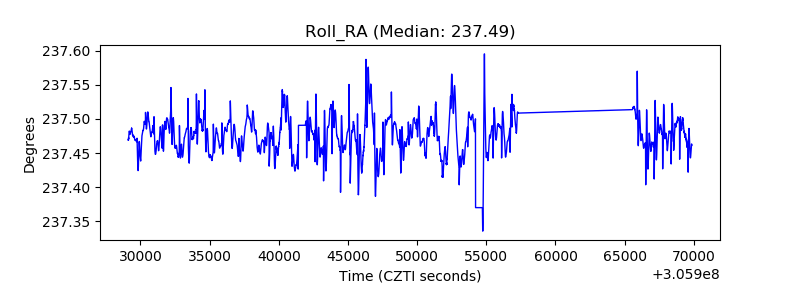 |
| Veto Counter | 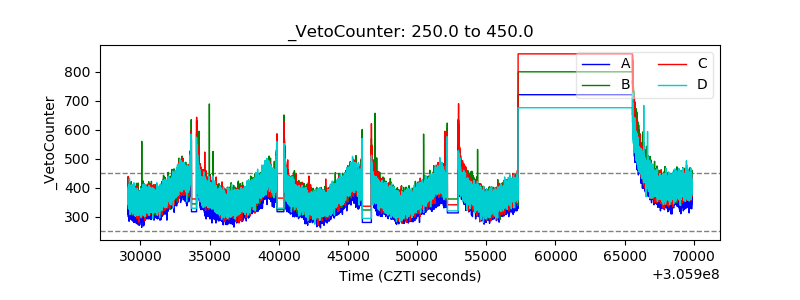 |