| Param | Original file | Final file |
|---|---|---|
| Filename | modeM0/AS1C04_001T01_9000003156_21392cztM0_level2.evt | modeM0/AS1C04_001T01_9000003156_21392cztM0_level2_quad_clean.evt |
| Size (bytes) | 941,132,160 | 183,726,720 |
| Size | 897.5 MB | 175.2 MB |
| Events in quadrant A | 6,010,916 | 1,227,399 |
| Events in quadrant B | 5,697,181 | 1,239,003 |
| Events in quadrant C | 9,984,147 | 1,113,940 |
| Events in quadrant D | 6,007,203 | 1,163,106 |
| Mode M0 | |||
|---|---|---|---|
| Quadrant | BADHDUFLAG | Total packets | Discarded packets |
| A | 0 | 25398 | 145 |
| B | 0 | 24764 | 150 |
| C | 0 | 38125 | 298 |
| D | 0 | 26154 | 188 |
| Mode M9 | |||
|---|---|---|---|
| Quadrant | BADHDUFLAG | Total packets | Discarded packets |
| A | 0 | 11 | 0 |
| B | 0 | 11 | 0 |
| C | 0 | 11 | 0 |
| D | 0 | 12 | 2 |
| Mode SS | |||
|---|---|---|---|
| Quadrant | BADHDUFLAG | Total packets | Discarded packets |
| A | 0 | 247 | 5 |
| B | 0 | 244 | 2 |
| C | 0 | 244 | 2 |
| D | 0 | 245 | 5 |
| Quadrant | Total seconds | Saturated seconds | Saturation percentage |
|---|---|---|---|
| A | 11867 | 82 | 0.690992% |
| B | 11870 | 63 | 0.530750% |
| C | 11865 | 1036 | 8.731563% |
| D | 11868 | 132 | 1.112235% |
Noise dominated data is calculated using 1-second bins in cleaned event files. If a bin has >2000 counts, and if more than 50% of those come from <1% of pixels, then it is considered to be noise-dominated and hence unusable.
| Quadrant | # 1 sec bins | Bins with >0 counts | Bins with >2000 counts | High rate bins dominated by noise | Noise dominated (total time) | Noise dominated (detector-on time) | Marked lightcurve |
|---|---|---|---|---|---|---|---|
| A | 15670 | 11869 | 27 | 27 | 0.17% | 0.23% | 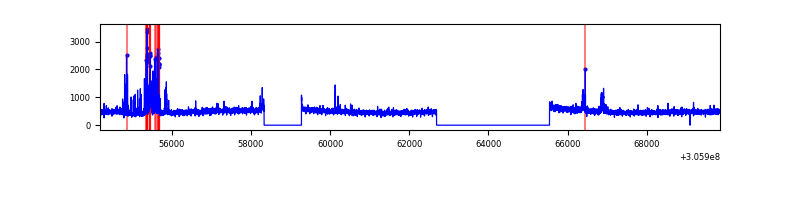 |
| B | 15671 | 11872 | 7 | 7 | 0.04% | 0.06% | 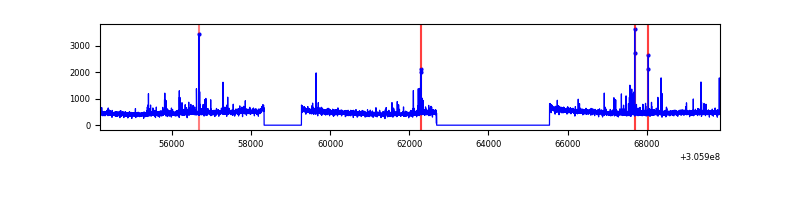 |
| C | 15671 | 11868 | 544 | 544 | 3.47% | 4.58% | 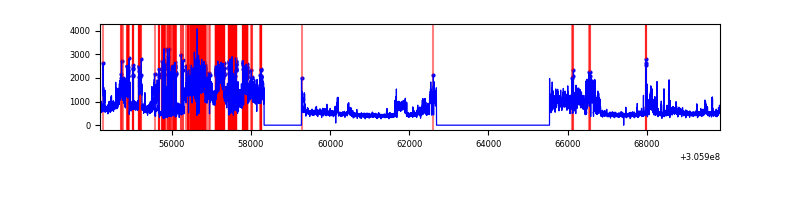 |
| D | 15671 | 11871 | 58 | 58 | 0.37% | 0.49% | 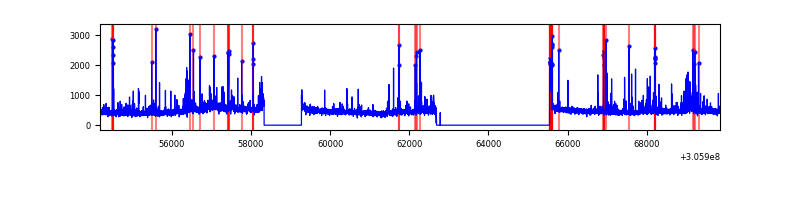 |
Top three noisy pixels from each quadrant. If the there are fewer than three noisy pixels in the level2.evt file, extra rows are filled as -1
| Pixel properties | Quadrant properties | ||||||
|---|---|---|---|---|---|---|---|
| Quadrant | DetID | PixID | Counts | Sigma | Mean | Median | Sigma |
| A | 12 | 96 | 265807 | 949.04 | 1406 | 1379 | 278.6 |
| A | 5 | 168 | 233612 | 833.49 | 1406 | 1379 | 278.6 |
| A | 15 | 174 | 79874 | 281.72 | 1406 | 1379 | 278.6 |
| B | 0 | 230 | 46688 | 175.74 | 1391 | 1356 | 257.9 |
| B | 0 | 228 | 45019 | 169.27 | 1391 | 1356 | 257.9 |
| B | 0 | 190 | 37940 | 141.83 | 1391 | 1356 | 257.9 |
| C | 3 | 233 | 4769108 | 16106.33 | 1285 | 1292 | 296.0 |
| C | 14 | 238 | 205265 | 689.05 | 1285 | 1292 | 296.0 |
| C | 13 | 61 | 8914 | 25.75 | 1285 | 1292 | 296.0 |
| D | 12 | 235 | 365769 | 1128.26 | 1349 | 1314 | 323.0 |
| D | 13 | 174 | 127340 | 390.14 | 1349 | 1314 | 323.0 |
| D | 13 | 153 | 94888 | 289.68 | 1349 | 1314 | 323.0 |
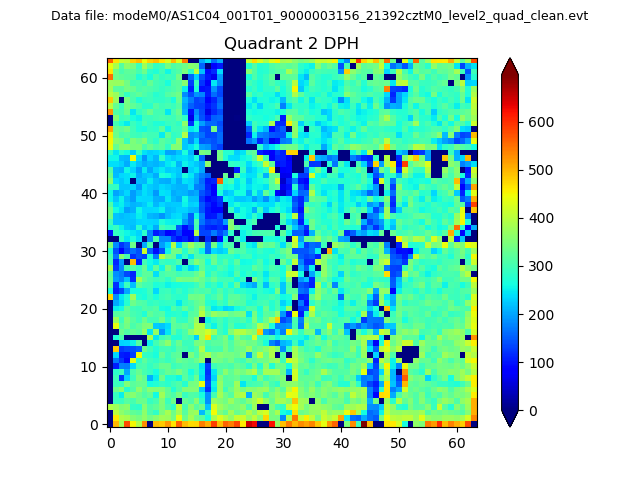
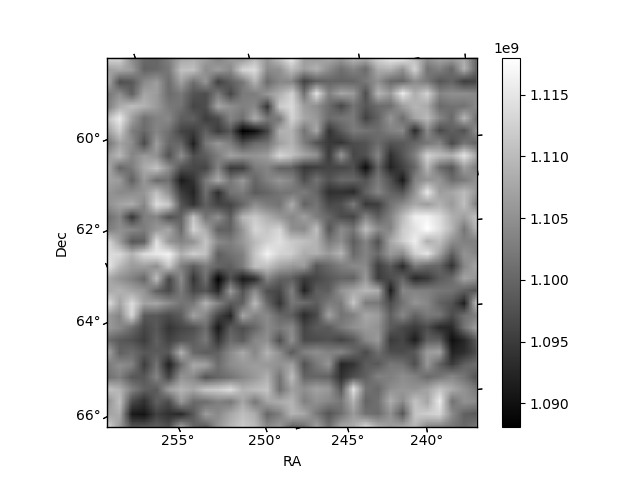
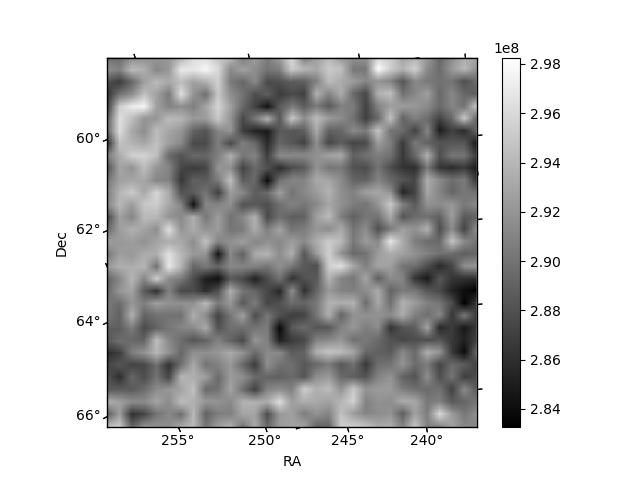
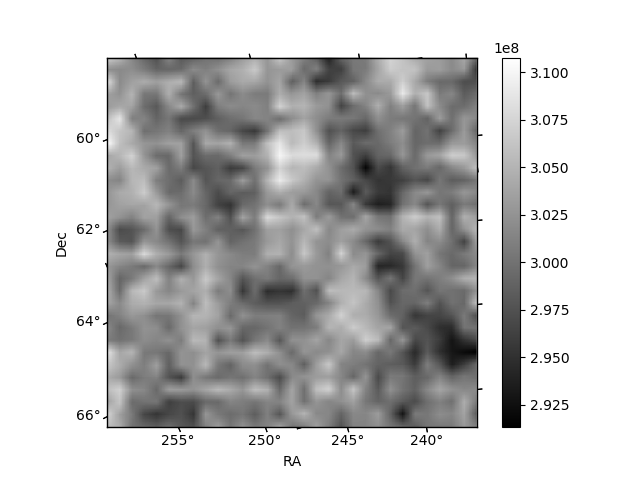
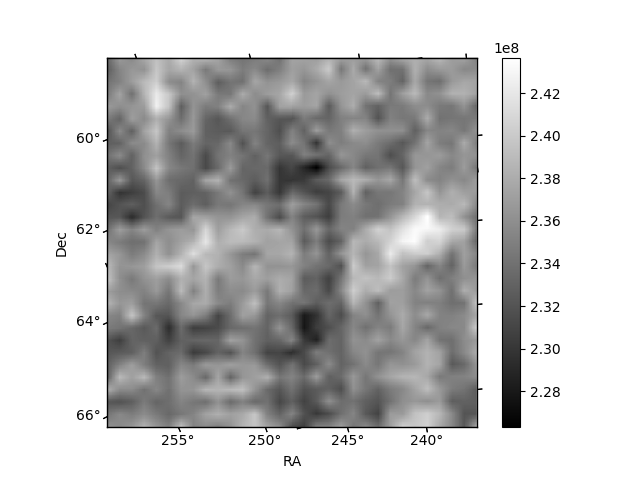
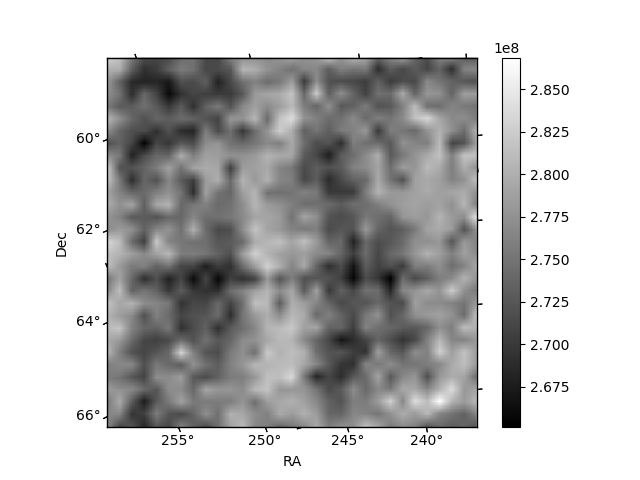
Histogram calculated using DETX and DETY for each event in the final _common_clean file
| Quadrant A | 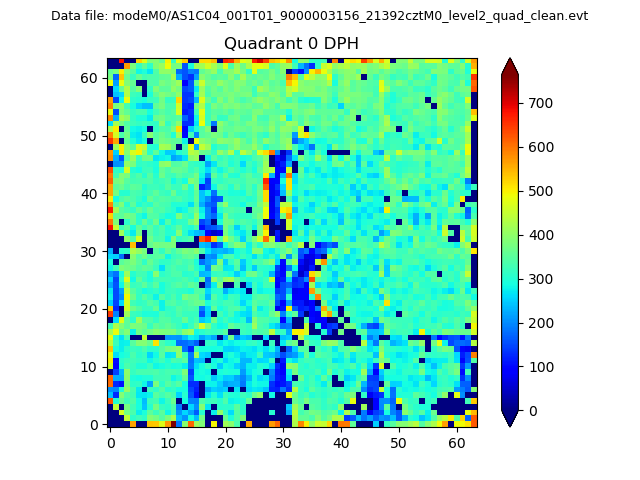 |
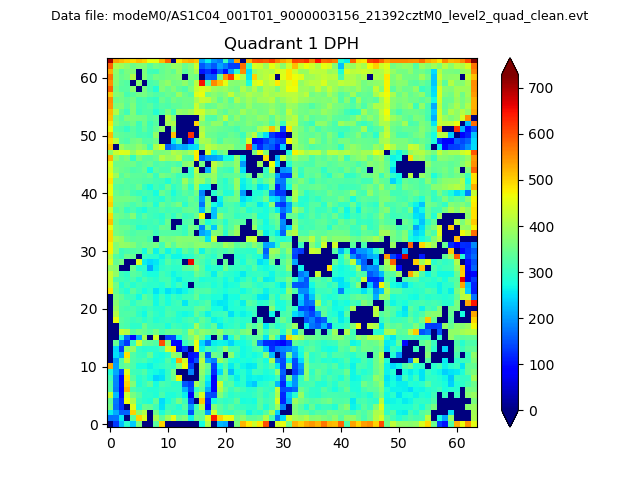 |
Quadrant B |
|---|---|---|---|
| Quadrant D | 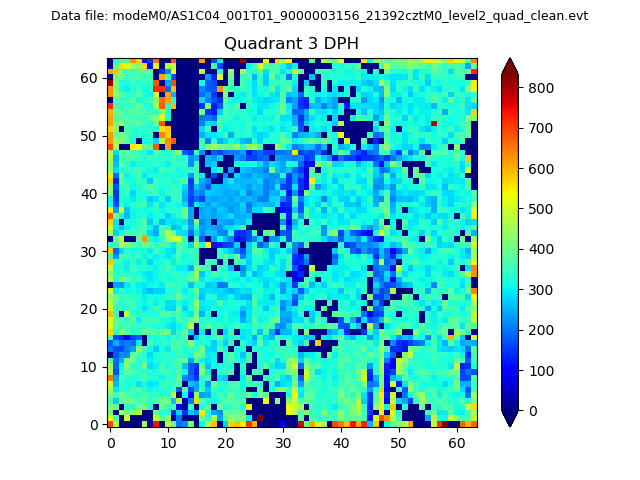 |
 |
Quadrant C |
| Plot type | Count rate plots | Images |
|---|---|---|
| Comparison with Poisson distribution Blue bars denote a histogram of data divided into 1 sec bins. Red curve is a Poisson curve with rate = median count rate of data. |
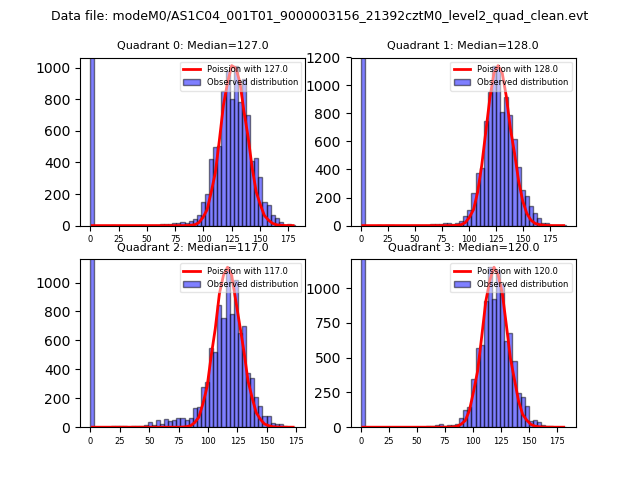 |
 |
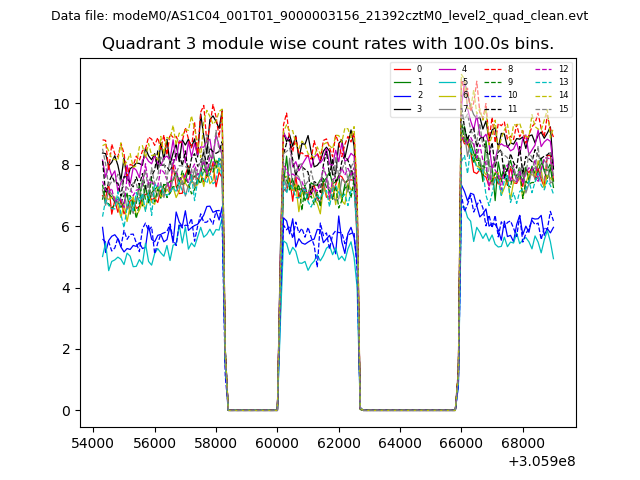
| Quadrant-wise count rates Data is divided into 100 sec bins |
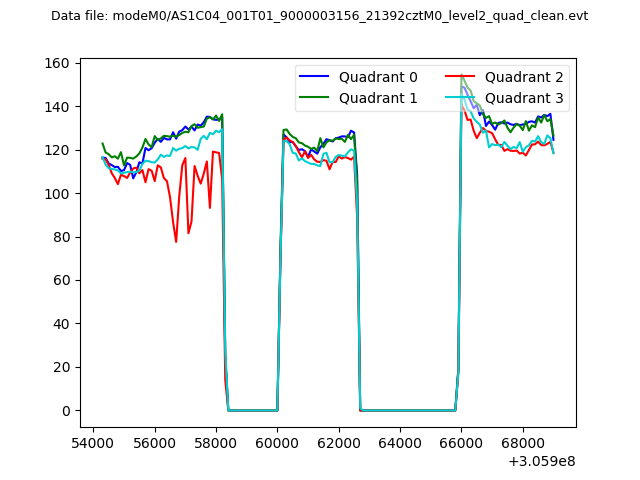 |
|
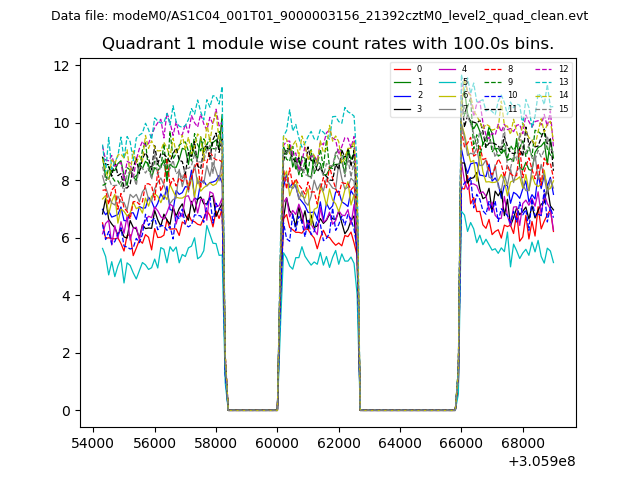
| Module-wise count rates for Quadrant A Data is divided into 100 sec bins |
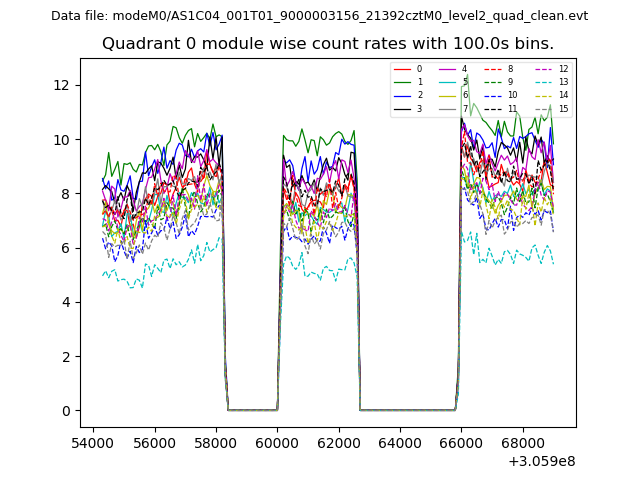 |
 |
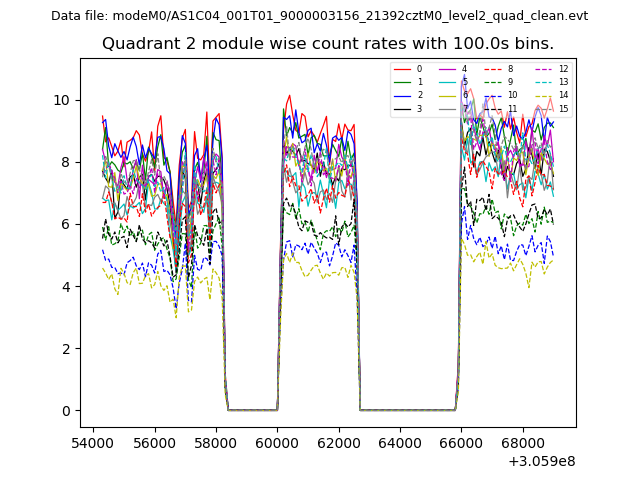
| Module-wise count rates for Quadrant B Data is divided into 100 sec bins |
 |
 |
| Module-wise count rates for Quadrant C Data is divided into 100 sec bins |
 |
 |
| Module-wise count rates for Quadrant D Data is divided into 100 sec bins |
 |
 |
| Parameter | Plot |
|---|---|
| CZT HV Monitor | 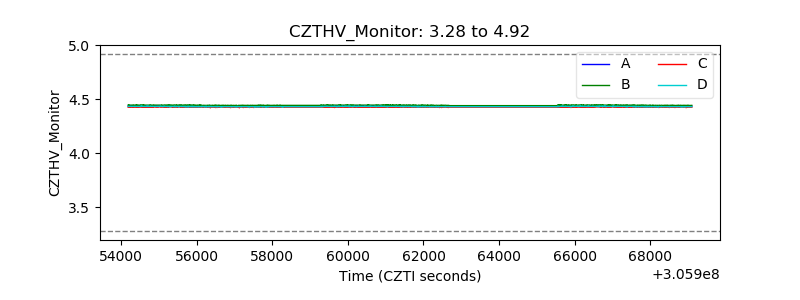 |
| D_VDD |  |
| Temperature 1 |  |
| Veto HV Monitor | 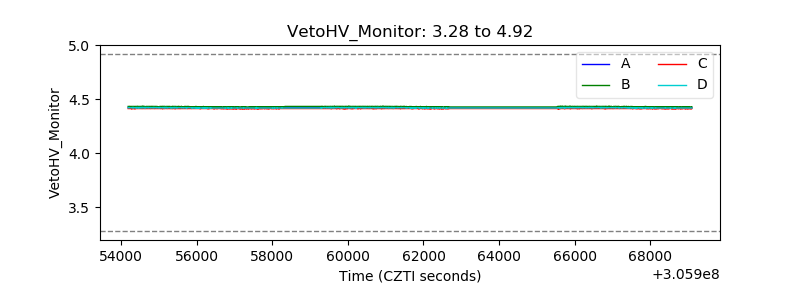 |
| Veto LLD | 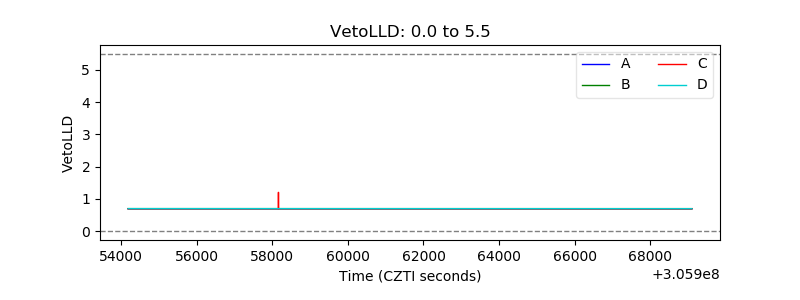 |
| Alpha Counter | 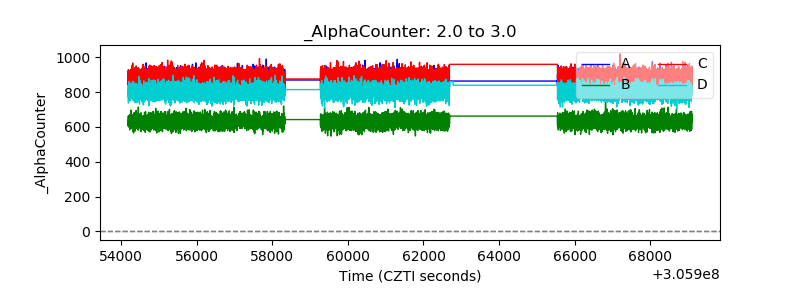 |
| _CPM_Rate | 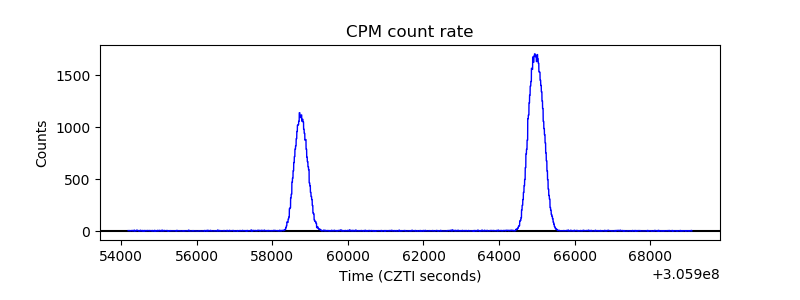 |
| CZT Counter | 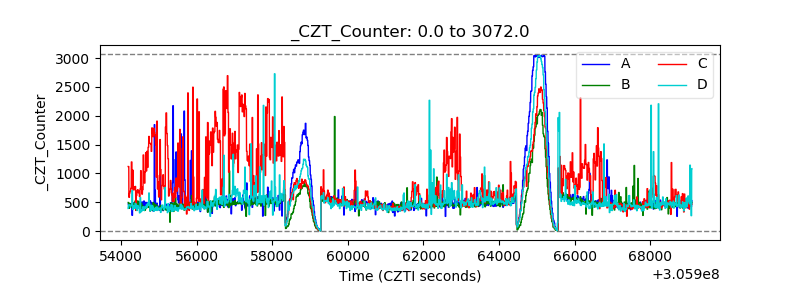 |
| +2.5 Volts monitor |  |
| +5 Volts monitor |  |
| _ROLL_ROT | 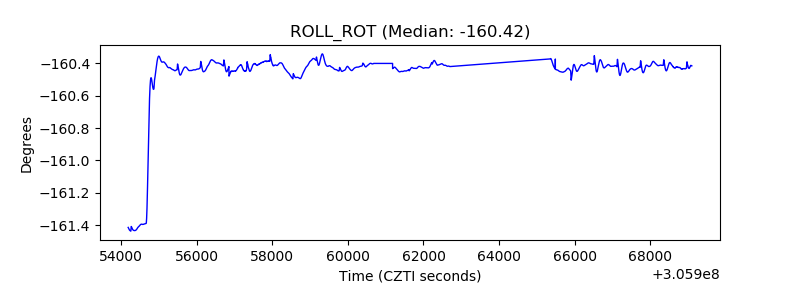 |
| _Roll_DEC | 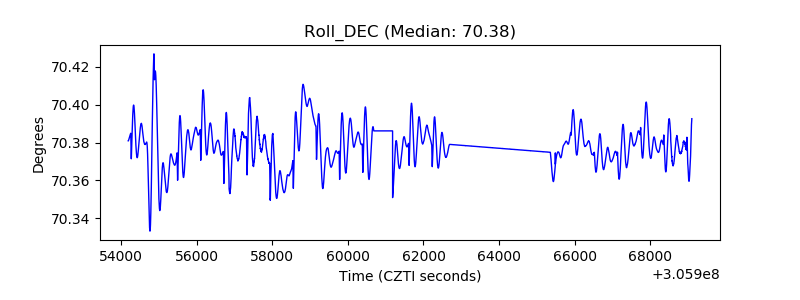 |
| _Roll_RA | 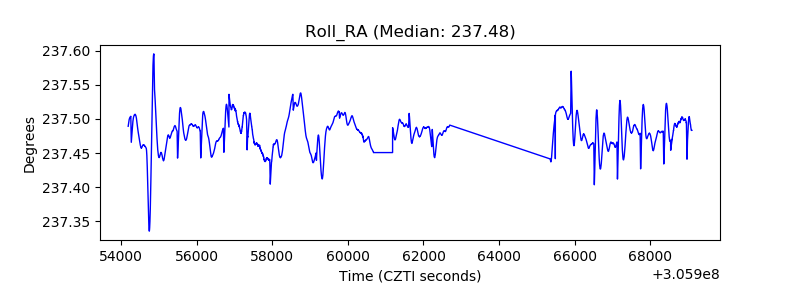 |
| Veto Counter | 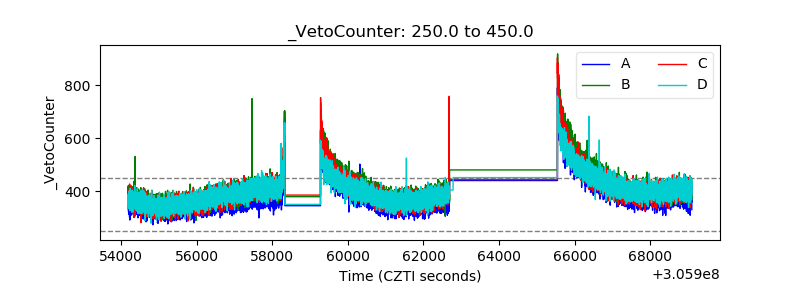 |