| Param | Original file | Final file |
|---|---|---|
| Filename | modeM0/AS1C04_010T01_9000003158cztM0_level2.fits | modeM0/AS1C04_010T01_9000003158cztM0_level2_quad_clean.evt |
| Size (bytes) | 295,018,560 | 211,394,880 |
| Size | 281.4 MB | 201.6 MB |
| Events in quadrant A | 1,896,522 | 1,208,427 |
| Events in quadrant B | 1,785,150 | 1,208,248 |
| Events in quadrant C | 1,799,398 | 1,126,438 |
| Events in quadrant D | 1,548,074 | 952,651 |
| Mode SS | |||
|---|---|---|---|
| Quadrant | BADHDUFLAG | Total packets | Discarded packets |
| A | 0 | 562 | 0 |
| B | 0 | 562 | 0 |
| C | 0 | 562 | 0 |
| D | 0 | 562 | 0 |
| Mode M0 | |||
|---|---|---|---|
| Quadrant | BADHDUFLAG | Total packets | Discarded packets |
| A | 0 | 61260 | 0 |
| B | 0 | 60316 | 0 |
| C | 0 | 75138 | 0 |
| D | 0 | 91397 | 0 |
| Mode M9 | |||
|---|---|---|---|
| Quadrant | BADHDUFLAG | Total packets | Discarded packets |
| A | 0 | 68 | 0 |
| B | 0 | 68 | 0 |
| C | 0 | 68 | 0 |
| D | 0 | 68 | 0 |
| Quadrant | Total seconds | Saturated seconds | Saturation percentage |
|---|---|---|---|
| A | 27707 | 427 | 1.541127% |
| B | 27707 | 445 | 1.606092% |
| C | 27707 | 1331 | 4.803840% |
| D | 27707 | 2811 | 10.145451% |
Noise dominated data is calculated using 1-second bins in cleaned event files. If a bin has >2000 counts, and if more than 50% of those come from <1% of pixels, then it is considered to be noise-dominated and hence unusable.
| Quadrant | # 1 sec bins | Bins with >0 counts | Bins with >2000 counts | High rate bins dominated by noise | Noise dominated (total time) | Noise dominated (detector-on time) | Marked lightcurve |
|---|---|---|---|---|---|---|---|
| A | 33562 | 27702 | 0 | 0 | 0.00% | 0.00% |  |
| B | 33562 | 27702 | 0 | 0 | 0.00% | 0.00% |  |
| C | 33562 | 27702 | 0 | 0 | 0.00% | 0.00% |  |
| D | 33562 | 27686 | 0 | 0 | 0.00% | 0.00% |  |
Top three noisy pixels from each quadrant. If the there are fewer than three noisy pixels in the level2.evt file, extra rows are filled as -1
| Pixel properties | Quadrant properties | ||||||
|---|---|---|---|---|---|---|---|
| Quadrant | DetID | PixID | Counts | Sigma | Mean | Median | Sigma |
| A | 0 | 29 | 1755 | 10.7 | 493 | 468 | 120.2 |
| A | 7 | 110 | 1544 | 8.95 | 493 | 468 | 120.2 |
| A | 9 | 19 | 1421 | 7.93 | 493 | 468 | 120.2 |
| B | 2 | 9 | 1376 | 9.71 | 474 | 454 | 95.0 |
| B | 2 | 8 | 1201 | 7.87 | 474 | 454 | 95.0 |
| B | 5 | 232 | 1157 | 7.4 | 474 | 454 | 95.0 |
| C | 3 | 126 | 1246 | 6.55 | 475 | 446 | 122.2 |
| C | 12 | 241 | 1200 | 6.17 | 475 | 446 | 122.2 |
| C | 9 | 209 | 1175 | 5.97 | 475 | 446 | 122.2 |
| D | 3 | 14 | 1114 | 6.12 | 443 | 406 | 115.6 |
| D | 6 | 231 | 1093 | 5.94 | 443 | 406 | 115.6 |
| D | 1 | 31 | 1061 | 5.66 | 443 | 406 | 115.6 |
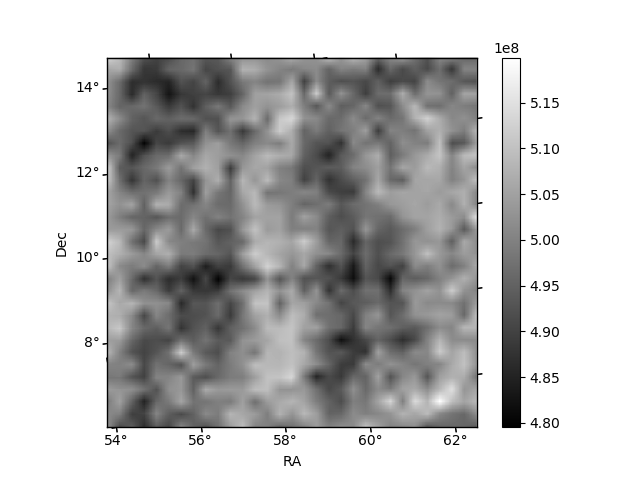
Histogram calculated using DETX and DETY for each event in the final _common_clean file
| Quadrant A | 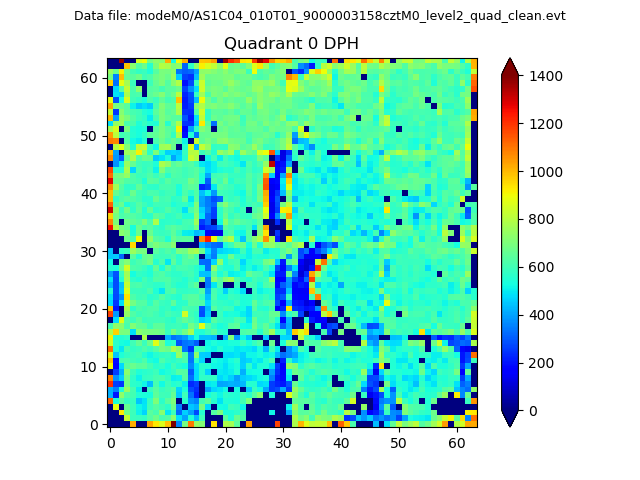 |
 |
Quadrant B |
|---|---|---|---|
| Quadrant D |  |
 |
Quadrant C |
| Plot type | Count rate plots | Images |
|---|---|---|
| Comparison with Poisson distribution Blue bars denote a histogram of data divided into 1 sec bins. Red curve is a Poisson curve with rate = median count rate of data. |
 |
 |
| Quadrant-wise count rates Data is divided into 100 sec bins |
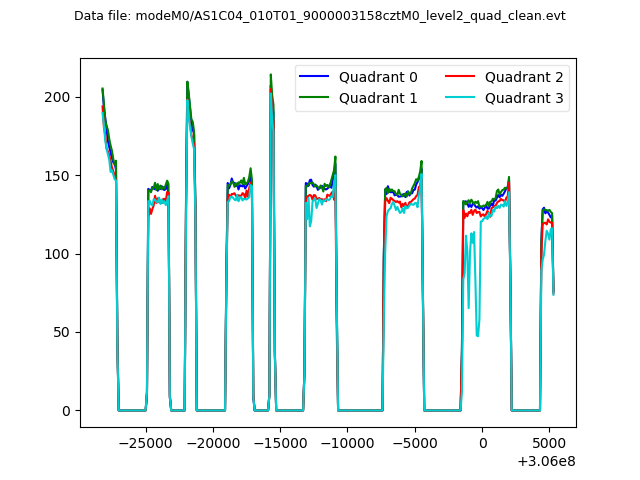 |
|
| Module-wise count rates for Quadrant A Data is divided into 100 sec bins |
 |
 |
| Module-wise count rates for Quadrant B Data is divided into 100 sec bins |
 |
 |
| Module-wise count rates for Quadrant C Data is divided into 100 sec bins |
 |
 |
| Module-wise count rates for Quadrant D Data is divided into 100 sec bins |
 |
 |
| Parameter | Plot |
|---|---|
| CZT HV Monitor |  |
| D_VDD | 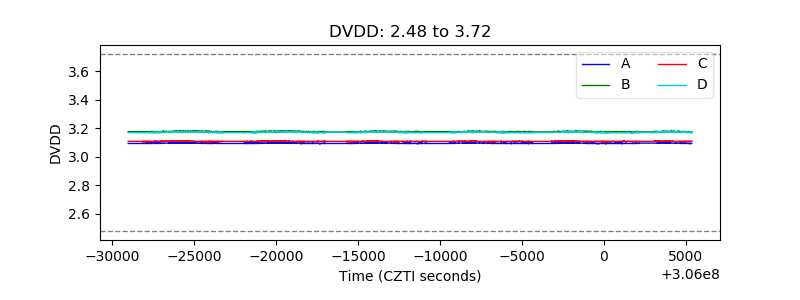 |
| Temperature 1 | 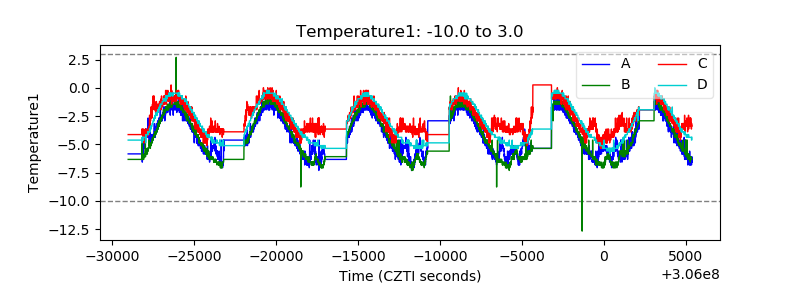 |
| Veto HV Monitor | 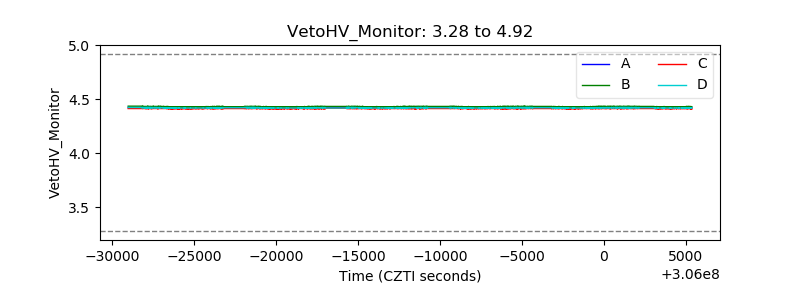 |
| Veto LLD |  |
| Alpha Counter |  |
| _CPM_Rate |  |
| CZT Counter |  |
| +2.5 Volts monitor |  |
| +5 Volts monitor |  |
| _ROLL_ROT |  |
| _Roll_DEC |  |
| _Roll_RA |  |
| Veto Counter |  |